

Abstract
Synthetic biology aims at rationally implementing biological systems from scratch. Given the complexity of living systems and our current lack of understanding of many aspects of living cells, this is a major undertaking. The design of in vitro systems can be considerably easier, because they can consist of fewer constituents, are quasi time invariant, their parameter space can be better accessed and they can be much more easily perturbed and then analysed chemically and mathematically. However, even for simplified in vitro systems, following a comprehensively rational design procedure is still difficult. When looking at a comparatively simple system, such as a medium-sized enzymatic reaction network as it is represented by glycolysis, major issues such as a lack of comprehensive enzyme kinetics and of suitable knowledge on crucial design parameters remain. Nevertheless, in vitro systems are very suitable to overcome these obstacles and therefore well placed to act as a stepping stone to engineering living systems.
Keywords: in vitro systems, enzymatic reaction network, glycolysis
1. Current limits in the engineering of living biological systems
The engineering of biological systems to have them fulfil a useful purpose is a millennia-old human activity, and, correspondingly, a substantial amount of experience and ‘know-how’ has accumulated. Over time, and of course in particular since the introduction of the molecular paradigm into biology, our methods have become ever more sophisticated, and the recombinant implementation of entire new pathways in bacteria or yeast (Nakamura & Whited 2003; Keasling 2008) has become as realistic as the high yield manufacturing of monoclonal antibodies with mammalian cells (Wurm 2004).
Nevertheless, the word engineering in this context suggests a degree of robustness and conceptual sophistication in the process of achieving the useful trait that is rarely met in practice. Engineering as the ‘application of scientific principles to practical purposes, as the design, construction, and operation of efficient and economical … systems’ (American Heritage Dictionary) puts specific emphasis on two terms, design and construction, that are particularly difficult to carry out for biological systems and thus play only a rudimentary role in the contemporary use of the word ‘engineering’ in biology.
Many reasons contribute to this. Design is difficult, because the most basic design requirements are not fulfilled in biology. Any recombinant protein that is synthesized in a bacterial cytoplasm can potentially interact with any other cytoplasmic protein, catalyse reactions with any of the several hundreds of metabolites or otherwise interact with any important physiological process. In other words, it is rather difficult to predict the effect of expanding the cellular genome, in any case quantitatively, but frequently also qualitatively.
One way to substantially simplify this process would be to develop methods of ‘chemical insulation’, in which newly introduced functions operate in the same cytoplasm but no chemical interactions take place. However, such attempts to orthogonalize cellular function are only beginning to emerge (Chin 2006; Wang et al. 2006).
Furthermore, very few computational tools exist that actually support the design process (Marchisio & Stelling 2008; Suarez et al. 2008), and, in general, such tools suffer from the unavailability of crucial details, such as basic information on the structure of important equations or the value of the numerous parameters (see below).
Next, even if an ambitious rational design were available, it is only since rather recently that we have at least in principle the means in hand to construct de novo large segments of genetic information. Examples such as the re-synthesis of the Mycoplasma genitalium genome (Gibson et al. 2008) or of Escherichia coli's 30S ribosomal subunit protein genes (Tian et al. 2004) indicate that de novo DNA synthesis at the systems level is currently used to re-synthesize genetic information of existing biological systems rather than advancing to the construction of ‘novel’ systems.
Finally, one fundamental biological process that has not yet visibly entered the process of design is evolution. Even though selection processes are used to tailor the parameters of certain elements of a design to the proper size range (Yokobayashi et al. 2002; Anderson et al. 2006), proper safeguards against evolution as a process that interferes in particular with the long-term stability of a designed cell remain to be implemented.
2. Assembling simple in vitro systems
Given the challenges of rationally engineering systems as complex as a living cell, it is tempting to reduce the system complexity. One straightforward way to do this is to assemble useful systems in vitro: (i) an in vitro system is relatively stable in time—the system cannot react to external stimuli by changing its composition, even though some constituents might degrade over time, (ii) evolution cannot interfere, and (iii) the number of parameters that can be influenced in controlled fashion is greatly enhanced, as the cytoplasmic membrane no longer separates intra- from extracellular space. Another important property is that the conditions, under which the system is operated, can be made much more similar to the conditions under which crucial parameters of the system were determined previously. For example, the parameter set for enzymes is typically determined with purified enzymes under conditions of high enzyme but low overall protein concentration, ignoring potentially important phenomena such as channelling (Savageau 1995). By escaping the requirement of a functional cell, the number of options to circumvent this caveat is much larger.
In exchange for these advantages, two problems need further attention. The first is the inability of the system to regenerate activities lost due to protein ageing, which, together with the degradation of crucial small molecules such as ATP, would be the prime reason for the system to cease functioning. Here, ageing is used to include phenomena that are well known to occur even under favourable circumstances in the living cell, such as the prolyl residue cis–trans isomerization, deamidation of asparaginyl residues, isomerization of aspartyl residues or oxidative damage to many residues (Clarke 2003), as well as inactivations brought about by the unfavourable reaction conditions potentially applied in the in vitro system, such as accumulating product. The latter point can be frequently addressed by reaction engineering strategies such as continuous process, and the rate of some ageing reactions can be reduced by carefully selecting proper reaction conditions such as oxygen content and pH. However, providing optimal reaction conditions for avoiding the variety of possible covalent amino acid residue modifications might be much more difficult. Here, the capacity to identify the most rapidly ageing member of the system will become crucial. As the rate with which protein inactivating by such covalent modifications proceeds is highly dependent on the specific sequence (Clarke 2003), the half-life of such proteins can be improved by engineering of the amino acid sequence. At least for those modifications for which repair pathways are known, providing active countermeasures—such as methyl-transferases to rescue aspartyl residues enzymes—can be considered, even though this would of course make the in vitro approach more complex.
The second challenge is that the system has to be actively assembled. Depending on the system, this can be a substantial challenge. In cell-free protein synthesis, a system was re-constituted from 32 purified protein components and entire ribosomes (Shimizu et al. 2001). Similarly, purified multi-enzyme systems, though of a smaller size, were frequently assembled from purified components (e.g. Nahalka et al. 2003).
On the other hand, the desired components of a system can be recruited from cell-free extracts, which in addition can be engineered (Jewett et al. 2008). This has the advantage of easy assembly, but might not allow complete control over the in vitro system. Undesired constituents of the cell-free extract might still interfere with system operation, or the precise composition of the system might vary as a consequence of prior cultivation conditions. For example, controlling all accessory protein components required for cell-free protein synthesis allows omitting release factor 1, which in turn allows direct recruitment of an amber stop codon for assignment of an additional amino acid (Shimizu et al. 2006). Still, in particular, the cell-free extract approach was highly successful, most prominently in cell-free protein synthesis (Jewett et al. 2008).
3. Engineering simple in vitro systems
A crucial test of our engineering ability in simplified in vitro systems is whether we can formulate the mathematical models required to mechanistically describe the system behaviour and subsequently formulate meaningful strategies for system modification towards a specific goal based on the mathematical description. Of the two major applications for in vitro systems, cell-free protein synthesis (Shimizu et al. 2006) and multi-enzyme reaction systems (Meyer et al. 2007), this was attempted with some success for the former (Arnold et al. 2005). A model to describe the cell-free production of GFP protein starting from gene expression from a T7 promoter could successfully predict (in some cases with rather good accuracy) quantitatively the behaviour of the concentration of a number of system components such as protein concentration, total mRNA concentration, acetyl phosphate concentration, adenosine phosphates and the levels of elongation factors Tu and T.
A part of cellular function that is understood even in quite some more detail than translation is metabolism and in particular central metabolism (Neidhardt 1996). In addition, recruiting the enzymes of central metabolism could provide access to a number of valuable compounds that would enable interesting routes to valuable fine chemicals (see figure 1). Therefore, we will discuss in the following the glycolysis of E. coli as a model reaction system and then the extent to which we can actually implement a mathematical foundation for engineering glycolysis as an in vitro multi-enzyme system.
Figure 1.

Reactions and enzymes of glycolysis in E. coli and potential for application (grey boxes) for selected metabolites in fine chemistry. For abbreviations, see the legend of table 1. In vivo systems rely on the PTS system, converting PEP to PYR for phosphorylation, and in vitro systems rely on Glk, using the conversion of ATP to ADP for phophorylation.
4. The E. coli glycolysis reaction network
Glycolysis describes the enzymatic conversion of the sugar glucose to pyruvate by nine single enzymatic steps as displayed in table 1. In this pathway, the C6-sugar is phosphorylated twice and subsequently split up into two C3 bodies that are further metabolized to pyruvate. This pathway exhibits both catabolic and anabolic character as per mole of glucose two moles of ATP can be gained and many intermediates serve as building blocks for biosynthesis, e.g. amino acid synthesis. In many organisms, including E. coli, glucose is the preferred substrate (Monod 1947; Adler et al. 1973) and therefore glycolysis is a carefully investigated pathway. The glycolytic pathway can also be operated in reverse (gluconeogenesis) if the ATP-generating enzymatic steps of the glycolysis are replaced by other enzymes that remove phosphates by hydrolysis.
Table 1.
Reactions of glycolysis from an in vitro systems point of view (soluble gucokinase substitutes for the membrane-bound PTS system) including the corresponding enzymes of E. coli W3110 as identified by BioCyc (Karp et al. 2005), EC numbers, the corresponding gene, operon and reported isoenzymes. AMP, ADP, ATP: adenosine mono/di/triphosphate; BPG: 1,3-bisphosphoglycerate; DHAP: dihydroxyacetone phosphate; F6P: fructose-6-phosphate; FBP: fructose 1,6-bisphosphate; G: glucose; G6P: glucose-6-phosphate; GAP: glyceraldehyde 3-phosphate; GMP, GDP, GTP: guanosine mono/di/triphosphate; NAD(H): nicotinamide adenine dinucleotide, oxidized and reduced form; NMP, NDP, NTP: nucleoside mono/di/triphosphate; PEP: phosphoenolpyruvate; 2PG: 2-phosphoglycerate; Pi: phosphate group; 3PG: 3-phosphoglycerate; PTS: phosphotransferase system; PYR: pyruvate; R5P: ribose-5-phosphate; succCoA: succinyl coenyzme A.
| reaction | EC number | enzyme | gene | operon | expression |
|---|---|---|---|---|---|
G+ATP  G6P+ADP G6P+ADP |
2.7.1.2 | glucokinase | glk | glk | constitutive (Meyer et al. 1997) |
G6P  F6P F6P |
5.3.1.9 | glucosephosphate isomerase | pgi | pgi | |
F6P+ATP  FBP+ADP FBP+ADP |
2.7.1.11 | 6-phosphofructokinase 1 | pfkA | pfkA | induced during glycolysis (Kotlarz et al. 1975) |
| 6-phosphofructokinase 2 | pfkB | pfkB | constitutive with 5% activity in wild-type (Kotlarz et al. 1975) | ||
FBP  DHAP+GAP DHAP+GAP |
4.1.2.13 | fructose-bisphosphate aldolase class I | fbaB | fbaB | induced by gluconeogenic substrates with 0–5% of overall Fba activity during growth on G (Thomson et al. 1998) |
| fructose-bisphosphate aldolase class II | fbaA | fbaA-pgk | constitutive (Thomson et al. 1998) | ||
DHAP GAP GAP |
5.3.1.1 | triosephosphate isomerase | tpiA | tpiA | not reported |
GAP+NAD+ Pi  BPG+NADH BPG+NADH |
1.2.1.12 | glyceraldehyde 3-phosphate dehydrogenase-A complex | gapA | gapA | not reported |
BPG+ADP  3PG+ATP 3PG+ATP |
2.7.2.3 | phosphoglycerate kinase | pgk | fbaA-pgk | not reported |
3PG  2PG 2PG |
5.4.2.1 | phosphoglycerate mutase 1 | gpmA | gpmA | not reported |
| phosphoglycerate mutase 2, cofactor independent | ytjC | ytjC | |||
| phosphoglycerate mutase 3, cofactor independent | gpmI | envC-gpmI-yibQ | |||
2PG  PEP+H2O PEP+H2O |
4.2.1.11 | enolase | eno | Eno | |
PEP+ADP  PYR+ATP PYR+ATP |
2.7.1.40 | pyruvate kinase 1 | pykF | pykF | induced by growth on glucose (Waygood et al. 1975) |
| pyruvate kinase 2 | pykA | pykA | constitutive (Waygood et al. 1975) |
In growing E. coli, glucose is taken up by the membrane-located phosphotransferase system that consumes a phosphoenolpyruvate to phosphorylate glucose (Kundig et al. 1964; Postma et al. 1993; Tchieu et al. 2001). In in vitro systems, this step can be circumvented by using the soluble glucokinase in order to carry out the first phosphorylation. Glucokinase is constitutively expressed but growth on glucose lowers the enzyme level to about 50 per cent (Meyer et al. 1997).
Tables 1 and 2 give an overview about available information on the glycolytic enzymes of E. coli. They clearly indicate a number of challenges for the modelling and the provision of reproducible experimental data, for in vivo as well as in vitro systems. First, there are isoenzymes (phosphofructokinases, fructosebisphosphate aldolases, phosphoglycerate mutases and pyruvate kinases) with different kinetic parameters. Then, the synthesis of some enzymes is inducible, that of others not. Most strikingly, many boxes are empty, indicating that the required knowledge has never been obtained in detail even for a model system such as E. coli.
Table 2.
Glycolytic enzymes of E. coli W3110 with their oligomeric structure, specification of reaction mechanism, known effectors and supplementary information including references. Abbreviations as in the legend to table 1.
| enzyme | structure | mechanism type | order | effectors | references, comment |
|---|---|---|---|---|---|
| glucokinase | dimer | Michaelis–Menten | ordered sequential (G first substrate then ATP) | PEP competitive inhibition to ATP (Ogawa et al. 2007) | Meyer et al. (1997), Lunin et al. (2004) |
| glucosephosphate isomerase | di- and tetramer | unknown | not necessary (uni–uni) | 6-phospho-gluconate inhibitor (probably competitive), PEP competitive inhibitor to F6P (Ogawa et al. 2007) | Schreyer & Bock (1980), tetramer has same activity as dimer |
| 6-phosphofructokinase 1 | tetramer | cooperative for F6P, noncooperative for ATP | ordered sequential (ATP first substrate then sugar) | NDPs allosteric acitvators of F6P, ADP competitive inhibitor of ATP, PEP allosteric inhibitor of F6P | Blangy et al. (1968), Kotlarz et al. (1975), Kotlarz & Buc (1982) |
| 6-phosphofructokinase 2 | di- and tetramer | ‘non-allosteric’ | ordered sequential (sugars first substrates) | high ATP and low F6P leads to inhibition, probably by transition into less active tetramer | Kotlarz et al. (1975), Kotlarz & Buc (1982), represents 5% acitivity in wild-type during growth on glucose |
| fructose-bisphosphate aldolase class I | probably octamer | Michaelis–Menten | unknown | PEP and citrate activators affecting mainly the maximal reaction velocity, PEP non-competitive inhibitor to FBP (Ogawa et al. 2007) | Rose et al. (1965), Baldwin & Perham (1978), Thomson et al. (1998), induced by gluconeogenic substrates, in muscle ordered sequential (GAP first product than DHAP) |
| fructose-bisphosphate aldolase class II | dimer | Michaelis–Menten | ordered sequential (DHAP first substrate, GAP second) | not reported | Zgiby et al. (2000) |
| triosephosphate isomerase | dimer | Michaelis–Menten | not necessary (uni–uni) | not reported | Alber et al. (1981) |
| glyceraldehyde 3-phosphate dehydrogenase-A complex | tetramer | cooperative NAD binding | unknown | not reported | negative cooperativity known from other bacteria (D'Alessio & Josse 1971; Leslie & Wonacott 1983; Duee et al. 1996) |
| phosphoglycerate kinase | monomer | unknown | unknown | not reported | Schierbeck & Larsson-Raznikiewicz (1979), Schmidt et al. (1995), in yeast random mechanism and complex behaviour |
| phosphoglycerate mutase 1 | dimer | Michaelis–Menten | not necessary (uni–uni) | not reported | Fraser et al. (1999) |
| phosphoglycerate mutase 2, cofactor independent | unknown | Michaelis–Menten | not necessary (uni–uni) | not reported | Fraser et al. (1999) |
| phosphoglycerate mutase 3, cofactor independent | unknown | unknown | not necessary (uni–uni) | not reported | not described; context of operon: EnvC: protease with a role in cell division; YibQ: predicted polysaccharide deacetylase |
| enolase | dimer | no known cooperative effects | not necessary (uni–uni if water ubiquitous) | not reported | Kuhnel & Luisi (2001), very similar to yeast |
| pyruvate kinase 1 | tetramer | cooperative for NDPs | not reported | FBP allosteric activator, GTP undefined inhibitor, succCoA weak inhibitor but with ATP cooperative inhibition | Waygood & Sanwal (1974), Markus et al. (1980), non-specific to NDPs as phosphate donor but preference for GDP |
| pyruvate kinase 2 | tetramer | cooperative for ADP and PEP | not reported | phosphate allosteric inhibitor and competitive with PEP, NMPs allosteric activators (especially GMP,AMP), sugarphosphates allosteric activators (especially R5P), NTPs non-competitive inhibitors (especially ATP), succCoA competitive against PEP and ADP | Waygood et al. (1975), non-specific to NDPs as phosphate donor but preference for ADP |
The latter point also holds true for the kinetic information summarized in table 2. In some cases, not even the multimeric state of the enzymes is clear. Also the type of mechanism and the eventual order of reactants, both necessary for the modelling of enzyme kinetics, is not always clear. Furthermore, some available information is plainly contradictory, e.g. for phosphofructokinase 1 phosphoenolpyruvate is reported as inhibitor as well as activator. And finally, even though for some enzymes effectors were reported, it is important to bear in mind that this does not mean that the entire set of possible effectors was comprehensively tested, as indicated by the late discovery of inhibitory effects from phosphoenolpyruvate on a number of glycolytic enzymes including glucokinase and phosphoglucoisomerase (Ogawa et al. 2007). In addition, effectors are often not single compounds but rather classes of compounds. Allosteric sites of enzymes recognizing effectors may not have a high specificity resulting in various compounds with analogue chemical groups influencing the reaction. Pyruvate kinase 2 is allosterically activated by various nucleotide monophosphates with different affinities for the single compounds and adenosine and guanosine monophosphate showing the strongest effects (Waygood et al. 1975).
5. Modelling of enzymatic systems with mechanistic descriptions
Ideally, a mathematical model for a multi-enzyme system can be composed from comprehensive rate equations for each enzyme in the system. Using glycolysis as a model system has the advantage that the involved enzymatic steps have been the subject of intensive studies since the 1960s. Enzymes from erythrocytes, trypanosomes, Saccharomyces cerevisiae and E. coli were investigated in quite some detail. However, despite (or because of) this breadth in scope, none of the mentioned pathways was investigated comprehensively for one single organism. Therefore, all mathematical models that try to predict glycolytic dynamics from the properties of the constituting enzymes rely on the combination of data from several organisms. The data were usually obtained from purified enzymes (see above), and it is unclear how the presence of high protein concentrations or other specific enzymes influences enzyme kinetics (this argument is more important for in vivo systems, as in vitro systems can be better adapted to the conditions under which the parameters were acquired). And, finally, if the enzymes are combined into a system, members of the system are exposed to the full set of substrate(s), intermediates and product(s) that can act as effectors, rather than only a selected set of (commercially available) compounds selected by the experimenter. The corresponding comprehensive effector studies are, however, not available. As a result, it is not surprising that even for the archetypical model glycolysis, that of S. cerevisiae, it is not possible to (i) collect a set of equations for all involved enzymes from detailed prior investigations and (ii) that even if the missing data are provided from experiments that mimic a system environment it remains difficult to accurately predict the dynamic behaviour of the aggregated system (Teusink et al. 2000).
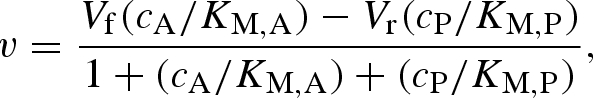
To fully appreciate the challenge, it might be worth taking a closer look at the state of the underlying modelling basics. Traditionally, an important approach to describe the kinetics of enzymatic reactions is the Michaelis–Menten equation (Michaelis & Menten 1913). Despite the widespread use of this description, it was originally developed for a one-substrate reaction under starting conditions (product concentration negligible and therefore reverse reaction and any product inhibition effects negligible). These conditions do not apply in a multi-enzyme system such as an in vitro version of the central metabolism, where many reactions have more than one substrate and all intermediates of the reaction pathway are available. An extended version of the Michaelis–Menten description that describes reversible one-substrate reactions can be useful for the isomerization reactions involved in glycolysis (figure 1)
 |
5.1 |
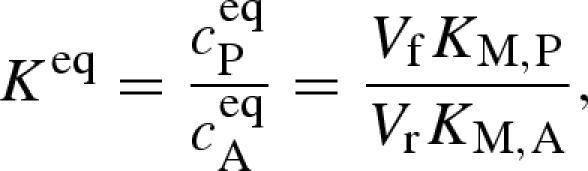
where v is the product formation or reaction rate, V is the limiting reaction rate of either the forward or the back reaction of substrate A and product P, ci describes the concentrations of the involved species and KM,i describes the Michaelis constants of the enzyme for substrate and product. This equation can be made easier to evaluate experimentally by combining it with the Haldane relationship
 |
5.2 |
where the superscript eq indicates equilibrium conditions and Keq is the equilibrium constant of the isomerization.
As pointed out, most enzymatic reactions occur between a higher number of compounds with not necessarily the same number of substrates and products, but the majority of biochemical reactions are of the two substrates and two products type (bi–bi) (Karp et al. 2007). Through the higher number of metabolites, different reaction schemes become theoretically possible, differing in the sequence with which the various substrates associate themselves with the enzyme and with which the products are released. The available possibilities that arise already for a bi–bi reaction are summarized in figure 2. The different mechanisms obey individual rate laws considering the different interactions of enzyme, reactants and their complexes, introducing new terms and parameters. The structure of the equations changes depending on the assumptions made—for example, whereas the classical one-substrate Michaelis–Menten equation remains mathematically the same irrespective of whether the rapid equilibrium assumption or the steady-state assumption was used to derive it—this is not true for reactions with more than one substrate or product, and frequently both assumptions are used in one equation. Consequently, intimate experimental knowledge is required to select the correct rate equation and model the rate correctly (Liebermeister & Klipp 2006), in particular if competitive, uncompetitive or non-competitive inhibition needs to be taken into account that can influence V and/or KM values.
Figure 2.

Reaction schemes for two products and two substrates (bi–bi) enzyme mechanisms: (a) ordered sequential; (b) sequential random order; (c) ping pong.
Another limitation of the Michaelis–Menten mechanism can be seen from the rate law: a change from 10 to 90 per cent of the maximum enzyme activity requires a substrate concentration change by the factor 81 (Segel 1975). Under in vivo conditions, such strong concentrations have not been reported (Theobald et al. 1993, 1997; Chassagnole et al. 2001, 2002; Rais et al. 2001), suggesting that reaction rate control is exerted to a large extent by a different type of mechanism that makes use of cooperativity and allostery.
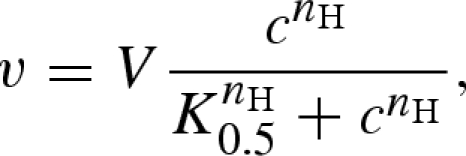
The formation of oligomers required for cooperativity is a frequent phenomenon in biochemistry—for example, most glycolytic enzymes form complexes of two or four identical subunits (homodimers or homotetramers). Here, binding of a substrate to one binding site of one polypeptide influences the affinity of another subunit for the substrate, giving rise to the cooperativity—positive if the affinity for the substrate increases for the other subunits and negative if it decreases. Such behaviour can be described by the empirical Hill equation
 |
5.3 |
where K0.5 is the half saturation constant at which v = 0.5V and nH is the Hill coefficient, an empirical constant capturing the effects of cooperativity (larger than 1 for positive cooperativity) (Hill 1910, 1913).
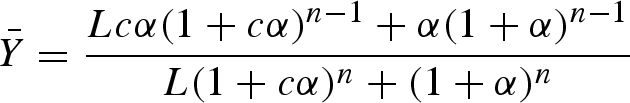
The resulting plot shows a sigmoid curve that, depending on the value of n, requires much less change in substrate concentrations for a substantial change in reaction rate. Allostery, in turn, describes the existence of a special binding site or sites on an enzyme for a metabolite that is not part of the enzyme-catalysed reaction but affects it. However, the two phenomena of cooperativity and allostery are conceptually closely related to each other (Monod et al. 1963), which led to the development of the symmetry model by Monod, Wyman and Changeux (Monod et al. 1965), who assumed the following statements: the oligomer is made up of n identical subunits keeping equivalent properties in the bound form and ligands only interact with their specific binding site on each subunit. Subunits interact in such a way that each monomer as well as the oligomeric assembly has at least two reversibly accessible states. A change from one to another state affects all subunits symmetrically and the affinities between ligands and binding sites are altered. The two states are called R for relaxed and T for tense and they are assumed to be in equilibrium with the constant L. The T state is stable but has only a low substrate affinity, whereas the R state has a high substrate affinity but is rather unstable. Through the uptake of substrate, the binding energy stabilizes the R state. The mathematical description of the fractional saturation  (which is the ratio of binding sites occupied by the ligand and the total number of binding sites) of such a system is
 |
5.4 |
with the parameters α = cA/KR,A and c = KR,A/KT,A, and the equilibrium constants of substrate A binding for the R and T states, KR,A and KT,A, respectively. Under rapid equilibrium conditions, the fraction of binding sites occupied is equivalent to v/V (Segel 1975) and therefore the rate law can be derived from 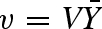 . Under the assumption that the T state has no affinity for the substrate, which is equal to the R state binding the substrate exclusively, then c = 0 and equation (5.4) simplifies to
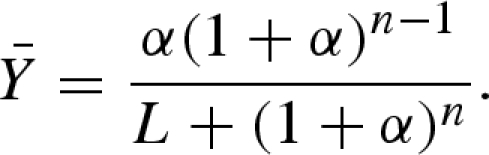 |
5.5 |
Effectors act by changing the equilibrium constant L between the two enzyme states. For the assumption that an inhibitor I binds exclusively to enzyme in the T state with the equilibrium constant KT,I and an activator F to the R state with KR,F and both of them have a stabilizing effect on their state, then effectors change the apparent L value according to
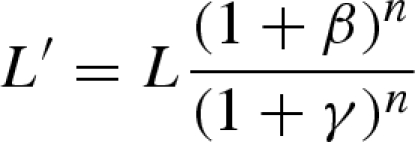 |
5.6 |
with β = cI/KT,I and γ = cF/KR,F.
Alternative models for regulatory enzymes have been suggested by Koshland et al. (1966). In their proposal, subunits can be at individual states, which is the main contrast to the symmetry model of Monod, Wyman and Changeux (Monod et al. 1965). In total, four models for tetrameric regulatory enzymes differing in their geometries and hence the possible subunit interactions have been suggested. As in the case for the symmetry model, two subunit states have been considered with one of them having no affinity for the substrate. Unfortunately, the developed models just reflect the cooperative behaviour but miss the allosteric consideration of effectors (Koshland et al. 1966).
Although the presented models are the most frequently used ones for regulatory enzymes, there are clear limitations following from the original model purpose. In both cases, the goal was to describe binding kinetics of oxygen to haemoglobin (Monod et al. 1965; Koshland et al. 1966), and therefore, assuming one substrate, irreversibility, no effectors and rapid equilibrium assumption of enzyme states was sufficient. Later, the symmetry model of Monod, Wyman and Changeux was generalized to reversible monosubstrate reactions (Popova & Sel'kov 1975) and multi-substrate reactions (Popova & Sel'kov 1976).
6. Modelling of enzymatic systems by linlog kinetics
An alternative approach to modelling dynamic behaviour of enzyme networks which has gained importance in recent years is the linlog kinetics approach introduced by Visser and Heijnen (2003). It is an extension of metabolic control analysis (Kacser & Burns 1973; Heinrich & Rapoport 1974) based on steady-state fluxes and concentrations. Therefore, all concentrations of enzymes, metabolites and effectors are normalized to their steady-state values.
Inspired by linear non-equilibrium thermodynamics, reaction rates are set as proportional to the free Gibbs energy ΔG with a logarithmic dependence on reactants and effectors (Visser and Heijnen 2003; Bulik et al. 2009). Such a rate law has the general description
 |
6.1 |
where v is the reaction rate, E is the enzyme, ci describes concentrations of reactants and effectors and the superscript 0 indicates the steady-state value. The elasticities ε0ci are parameters that quantify the relative change in the reaction rate due to a relative change in metabolite level, while maintaining everything else constant (Visser & Heijnen 2003). Elasticities can be gained from experiments (Kresnowati et al. 2005) or from mechanistic models (Visser et al. 2004). By definition, elasticities are only local properties of enzymes or enzymatic systems and in consequence linlog models are approximations of pathway dynamics around a specific steady state. For an application, mainly in the context of improving bacterial or fungal microorganisms for the formation of chemicals or investigating limited perturbations in in vitro systems, this might be sufficient, and the more detailed mechanistic kinetic modelling can be replaced by the linlog approach where covering the full concentration space is not necessary. This results in a lower experimental and mathematical effort as also the number of necessary parameters decreases (Visser & Heijnen 2003). Within the given constraints, required changes in enzyme level can be calculated, giving targets for the design of recombinant organisms. Visser et al. (2004) proved the validity of the linlog kinetics by application of and comparison with a mechanistic model for E. coli (Chassagnole et al. 2002). Here, flux control coefficients and changes in enzyme and metabolite levels were evaluated but unfortunately no time series of metabolites were published.
Bulik et al. (2009) compared, among others, the linlog approach with mechanistic modelling with respect to describing the dynamics of the purine salvage pathway of hepatocytes and the energy and redox metabolism of erythrocytes, and the linlog approach did not reproduce the behaviour well (relative to the mechanistic approach). However, hybrid models composed of detailed mechanistic rate equations for central regulatory enzymes and simplified ones for the majority of enzymes showed a good improvement in simulation (Bulik et al. 2009). Nevertheless, there were still significant deviations compared with the full mechanistic model.
Both approaches, mechanistic modelling and the linlog approach, are in principle able to reflect well the highly nonlinear character of enzyme kinetics. However, both approaches require the availability of large sets of accurately quantified parameter sets, which are not trivial to acquire, as will be discussed in the next section.
7. Modelling of larger enzyme networks
From the beginning of metabolic modelling, the central carbon metabolism was the focus of research due to its dominating function in anabolism and catabolism (Richter et al. 1975), and it maintained its important role until today (Bali & Thomas 2001; Helfert et al. 2001; Hynne et al. 2001; Lambeth & Kushmerick 2002; Albert et al. 2005; Conant & Wolfe 2007; Hardiman et al. 2007; Schuetz et al. 2007; Maier et al. 2008). Next to modelling the central carbon metabolism, additional pathways, especially of amino acids biosynthesis, are increasingly described by models (Chassagnole et al. 2001; Bhartiya et al. 2003; Yang et al. 2005; Caldara et al. 2008). The available models are then connected to larger scale models (Vaseghi et al. 1999; Chassagnole et al. 2002), but the overall scale of the models has hardly changed over the last 30 years as database research underlines (Rizzi et al. 1997; Le Novere et al. 2006; Chalhoub et al. 2007). Hence, the largest scale dynamic model for E. coli metabolism (Chassagnole et al. 2002) includes 30 reaction rates and 18 balanced metabolites in contrast to the more than 1000 enzymatic reactions encoded and more than 1000 compounds detected in E. coli (Karp et al. 2007). These observations already indicate that metabolic modelling is constrained by severe limitations. One of these limitations is that model parameter space grew faster than computing power and the formulation of rate laws alone is not sufficient for simulation purposes as first values for the parameters introduced must be provided. Publications that describe in detail the biochemistry of relevant enzymes include measured values for parameters. But even if these enzymes were obtained from the same organism for which the model is to be derived, it is unclear how the parameters change when the enzymes are used under different environmental conditions or in a systems context (see above; Teusink et al. 2000; Hadlich et al. 2009). Therefore, an adaptation of the model parameters is unavoidable to simulate system behaviour, and this adaptation has to be carried out by computationally intensive parameter estimation algorithms.
The estimation of model parameters describing the dynamics of the enzymatic system requires special experiments to gain reliable values. Measurements of metabolite concentrations under different steady-state conditions are still essential but require a complement. The dynamic parameters of the model describe in which manner a transition between different steady-state concentrations of the system occurs, so an observation of concentration change over time is mandatory to identify concrete values. In order to gain such metabolite concentration time series, the enzymatic system has to be stimulated to perform the desired transition and concentrations have to be recorded. Both operations are problematic and clearly limited in the case of living systems as will be pointed out in §7.1.
Given the model character of E. coli, it has—like the yeast S. cerevisiae—assumed a central role in experiments directed at modelling large enzyme networks. So far, the focus was on analysing metabolic networks in vivo, and the available methods were designed to obtain time-series data for in vivo systems. The most comprehensive kinetic model for E. coli was developed by the Reuss group (Chassagnole et al. 2002). The goal was to describe quantitatively the system behaviour of the central carbon metabolism of the organism. It includes the sugar transport through the phosphotransferase system into the cell, the subsequent glycolysis and the pentose phosphate pathway. As many of the central questions for in vitro modelling are very similar, we will use this model to analyse current possibilities and limitations of modelling dynamic enzymatic reaction systems, the identification of model parameters and the experimental setup required.
7.1. Reaction system, perturbation, sampling, and quantification
To guarantee the reproducibility of the obtained cellular status and the resulting measurement of metabolites, well-defined protocols are necessary for the growth of cells, as otherwise different protein profiles will lead to arbitrary cellular states and concentrations of metabolites. This requires chemostat cultivations (Novick & Szilard 1950) with synthetic media. The chemostat mode allows the reproducible implementation of a steady state at a selected specific growth rate. Because of its control properties, the chemostat is the typical reactor type for dynamic experiments (Rizzi et al. 1997; Theobald et al. 1997; Vaseghi et al. 1999; Chassagnole et al. 2002), and the continuous reactor (usually in the form of an enzyme membrane reactor) is its counterpart for in vitro systems. A disturbance of the growth conditions enforces a dynamic reaction of the enzymatic network and the metabolite concentrations. Recorded time series of metabolite concentrations as a consequence of changing extracellular concentrations can then be used for the in vivo parametrization of a dynamic model describing the enzymatic reaction rates (Rizzi et al. 1997; Theobald et al. 1997; Vaseghi et al. 1999; Chassagnole et al. 2002). However, for in vivo systems—but not for in vitro systems—the array of possible perturbations is limited. To gain a strong response, the intervention should be as direct as possible, ideally with an involved compound. For in vivo systems, the compound needs to cross the cytoplasmic membrane, so compounds for an effective perturbation must either be able to diffuse easily through the cell membrane or the cell must possess a transporter. Effectively, this has limited the applied perturbations to glucose pulsing from a highly concentrated glucose solution to a glucose-limited culture in a steady state (Theobald et al. 1993, 1997; Weuster-Botz 1997; Schaefer et al. 1999; Chassagnole et al. 2002).
The time frame after which the first sample can be withdrawn after perturbation is given by two processes. First, the time span between the disturbance and the first sample of the transition must be long enough to allow for ideal mixing of the reactor contents, which is necessary to obtain a reproducible sample (Buziol et al. 2002). The second limiting process is the dynamics of cell internal reactions, which is at the time scale of subseconds (Harrison & Maitra 1969; de Koning & van Dam 1992; Chassagnole et al. 2002). These opposing objectives for the sampling of fast metabolic changes can hardly be satisfied for the first samples but indicate the requirement to resolve the time courses of concentrations on the subsecond scale (Mashego et al. 2007). Conventional sampling strategies such as sampling valves, sampling from a bypass or the usage of filtration modules are not even able to resolve a few seconds (de Koning & van Dam 1992; Theobald et al. 1993) (figure 3). By minimizing the dead space of the sampling device relative to the sampling volume, time scales of seconds can be achieved and the process can be automated (Theobald et al. 1997; Schaefer et al. 1999). An alternative sampling method is the stopped-flow technique that is especially suited to access subsecond time scales (Chance 1964) (figure 3). A continuous flow of fermentation broth is transferred into an external turbulent mixing chamber where the perturbation is performed. In the effluent pipe after the chamber, the reaction time is then defined by the residence time required to reach the next sampling valve (Buziol et al. 2002; de Koning & van Dam 1992; Visser et al. 2002). The main advantages of the stopped-flow technique are the decoupling of sampling and reaction time, enabling sampling below 100 ms, the maintenance of the steady state of the culture in the master reactor, and the possibility to collect different sample volumes (Buziol et al. 2002). Chassagnole et al. (2002) combined both approaches, stopped-flow for the first second and negligible dead space for subsequent sampling. Whereas the end time for sampling is determined by the investigated question for in vitro systems, for in vivo systems it is determined by the time constant with which the cells can react to the perturbation by re-adjusting their enzyme concentrations (which is of the order of a few minutes).
Figure 3.

Experimental setup consisting of chemostat culture (left) with rapid sampling (upper panel) and stopped flow (lower panel) technique. Different sampling times are indicated by ti.
A crucial step in analysing reaction systems is to effectively stop the reaction at the time of sampling (figure 4). This is particularly difficult for in vivo systems as the metabolite concentrations need to be measured intracellularly and the intervention taken to stop the reaction during sampling must not lead to a mixing of intra- and extracellular contents. However, the chemical diversity of the intracellular metabolites makes this rather challenging. Furthermore, the method to stop the reaction (‘quenching’) needs to be compatible with the subsequent extraction and analysis procedure. Standard methods of quenching include a rapid temperature and/or pH change (Winder et al. 2008) and for extraction treatment of the cells with boiling ethanol, boiling water, cold perchloric acid, potassium hydroxide or chloroform (Mashego et al. 2007) leading to different recovery profiles for compounds of different chemical properties (Maharjan & Ferenci 2003; Winder et al. 2008).
Figure 4.

Principle setups for integrated, simultaneous and sequential procedures for sampling and quenching of cell and extraction and quantification of metabolites.
The next critical issue is the quantification of metabolites. The concentrations for internal and external metabolites can easily vary over three orders of magnitudes from millimolar to nanomolar. At the same time, available sample volumes are typically low, of the order of a few to a few hundred microlitres. A large spectrum of analytical platforms is currently used, including enzymatic assays, NMR, GC-MS and LC-MS (Schaub et al. 2006; Mashego et al. 2007) (figure 4). In general, the effort required to obtain concentration data of sufficient accuracy is considerable (Buchholz et al. 2001) (figure 5). To our knowledge, there is no study that tries to quantify the aggregate error that stems from sampling, quenching, extraction and analysis, but it seems safe to say that this error is not negligible. Another essential point is the time required to acquire a set of concentrations. The typical arrangement of sample preparation and (where required) sample derivatization, chromatographic separation and subsequent MS-based analysis takes about 1 h per time point (Meyer et al. 2007). This severely limits the number of analyses that can be evaluated per time series, and thus the quality of the parameterization effort.
Figure 5.

The sequential sampling and quenching procedure with its analytical requirements and the resulting set of problems.
Many of the limitations discussed above can be circumvented by investigating cell-free systems. In particular, the absence of a cell membrane removes many obstacles, as it allows system perturbation with compounds that cannot cross the membrane. Furthermore, many sources of error in the chemical analysis are removed—in exchange for a limitation to water-soluble metabolites in the system analysis. In addition, the composition of the in vitro system can be validated before and after the experiment, again increasing the reliability of the analysis. In summary, a substantial part of the difficulties in system analysis can be circumvented by analysing in vitro systems.
7.2. Parameter estimation
The large kinetic model assembled by Chassagnole et al. (2002) shows the full diversity of kinetic rate equations. For glycolyis, reversible Michaelis–Menten-type kinetics derived from both rapid equilbrium and steady-state assumption with or without inhibition and allosteric activation were used as well as the empiric Hill equation or the allosteric model of Monod, Wyman and Changeaux with extensions. The oxidative part of the pentose phosphate pathway was modelled with mass action kinetics, and anabolic synthesis reactions have been implemented either as zeroth-order mass action rate laws or as irreversible Michaelis–Menten kinetics. The irreversible steps in glycolysis restrict the model to describe glycolytic behaviour and exclude the gluconeogenic direction. One potentially difficult problem in analysing the system is the presence of isoenzymes, which refers to different enzymes that catalyse the same reaction, typically with different parameters to satisfy different cellular requirements under different physiological circumstances. Only three such cases were explicitly considered in the model under study, by either lumping the isoenzymes into one rate equation (glucose-6-phophate isomerase and pyruvate kinase reactions) or consciously ignoring one enzyme based on literature data (phosphofructokinase 2). In summary, the model uses 88 parameters, which need to be optimally estimated, and already the numbers from smaller metabolic networks are substantial (Rizzi et al. 1997; Teusink et al. 2000). This requires the restriction of the parameter space to a physiologically meaningful interval, e.g. to constrain KM values to values between 0 and a few millimolar, and a good first estimate improves quality and convergence of parameter estimation strongly. In particular, the usage of in vitro determined values is helpful. To obtain an idea of the scope of the problem, consider 100 parameters with only 10 discrete values, and 10100 combinations need to be evaluated, which cannot be effectively searched even by a computational brute force approach with an estimated 1000 evaluations per second.
A solution for this problem is the usage of strategies implemented to an optimizer program that minimizes the error between simulation and experiment. Because of the strong nonlinearity of mechanistic enzyme kinetics, no a priori knowledge about the behaviour of the error function is given and gradient-based optimization can be expected to yield local minima and thus suboptimal solutions. Global optimization algorithms are required, such as evolution strategies and parameter swarm searches (Streichert & Ulmer 2005; Vaz & Vicente 2007; Draeger et al. 2009). Because of the properties of such global search algorithms, local optimizers can be used for a terminal refinement of the solution.
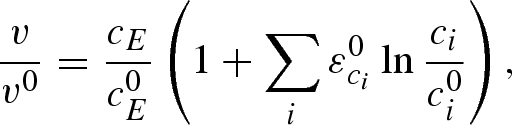
In order to cut the computational cost as a consequence of the previously demonstrated combinatorial explosion, the estimation process can be divided into smaller subproblems for single enzymes as suggested and applied by Rizzi et al. (1997) and by Chassagnole et al. (2002). For the estimation of the limiting reaction rates V of the rate equations, an interesting approach has been chosen by Chassagnole et al. (2002), which was based on previous works (Rizzi et al. 1997; Vaseghi et al. 1999). If at a steady state (superscript 0) the reaction rate v0 of an enzyme
 |
7.1 |
is defined by the limting rate V and a function (the kinetic equation) depending on the steady-state concentrations  and the parameter set
  , then the maximum reaction velocities can be calculated from the equation
 |
7.2 |
As a consequence, one parameter less per rate equation needs to be estimated as it can be calculated and the observed steady-state reaction rate is automatically fulfilled. The required steady-state fluxes can be calculated by metabolic flux analysis (for in vivo systems) or from continuous reactor experiments (for in vitro systems), whereas the steady-state concentrations of metabolites can be gained from measurements (Theobald et al. 1997; Winder et al. 2008) or, if not available, calculated by the use of near-equilibrium constants (Schauer et al. 1981; Vaseghi et al. 1999; Chassagnole et al. 2001). The last set of missing values for the determination of the limiting reaction rates are then the parameters p themselves, which are unknown or at least biased in the case of known in vitro parameters.
Despite the availability of such powerful algorithms, the solutions of the optimization problem continue to be local and the search for them potentially very time consuming. Furthermore, the result of the parametrizing effort can only be as good as the model for which the parameters are estimated. Consequently, whereas acceptable fits of simulations to experimental data can be obtained for specific regions (Chassagnole et al. 2002; Arnold et al. 2005), the predictive power of the model remains limited. Here, it is particularly encouraging that in vitro systems allow at least in principle a much more detailed and comprehensive approach to system analysis. The same reaction system can be exposed to carefully selected combinations of substrates, metabolites and effectors to expose limitations of the model previously overlooked. Even though the corresponding experimental effort will be substantial, it will be much less than manipulating in vivo systems via knock-outs or recombinantly tailored protein levels, which are likely to provoke additional changes in other parts of the system. In other words, with in vitro systems, there is a straightforward path to improve the underlying model assumptions and thus improve the usefulness of the model for engineering.
8. Summary
One way to define the mission of synthetic biology is to implement the foundations of system engineering for biological systems. This is a highly ambitious goal, based mainly on the development of techniques to provide de novo synthesized DNA fragments of considerable length and on the hope that the new discipline of systems biology will ultimately provide the knowledge framework that will enable rational engineering rather than on a current detailed systems understanding. When focusing on one of the best understood simple systems available in biology, the glycolysis of the model bacterium E. coli, it becomes clear that obstacles remain. Basic information is missing for a number of enzymes, some kinetic mechanisms are unknown (and, therefore, the proper formulation of rate equations remains difficult), and the effector profiles of the enzymes have not been investigated comprehensively. Therefore, assembly of a mathematical model from the kinetic equations of the separate enzymes is not fully possible, and the structure of the single equations and the parameter values need to be inferred from dynamic experimental data. However, the cytoplasmic membrane limits the capacity to systematically perturb the intracellular system. In addition, the current analysis methods that were developed for the determination of intracellular metabolite concentrations have limitations in accuracy and, more importantly, throughput. Finally, the parameter sets are usually so large that obtaining the best set remains a challenge.
Although most of these obstacles apply to both in vivo and in vitro systems, each of these obstacles can be addressed more easily in in vitro systems: these systems can be made substantially simpler and more tightly controlled and they are not prone to evolution. They can be investigated with a much larger degree of experimental freedom, allowing a much broader application of optimal experimental design to validate and correct model structure, and they allow a much more diverse series of experiments for parametrization, such as more variable perturbations and different perturbation functions. Therefore, we propose that in vitro systems are very suitable model systems to advance our capacity in all aspects of biological systems engineering, including design.
Acknowledgements
This work was supported by the EU (FP6-NEST Pathfinder Synthetic Biology, project Eurobiosyn no. 12749).
Footnotes
One contribution to a Theme Supplement ‘Synthetic biology: history, challenges and prospects’.
References
- Adler J., Hazelbauer G. L., Dahl M. M. 1973. Chemotaxis toward sugars in Escherichia coli. J. Bacteriol. 115, 824–847. [DOI] [PMC free article] [PubMed] [Google Scholar]
- Alber T., Banner D. W., Bloomer A. C., Petsko G. A., Phillips D., Rivers P. S., Wilson I. A. 1981. On the three-dimensional structure and catalytic mechanism of triose phosphate isomerase. Phil. Trans. R. Soc. Lond. B Biol. Sci. 293, 159–171. ( 10.1098/rstb.1981.0069) [DOI] [PubMed] [Google Scholar]
- Albert M. A., Haanstra J. R., Hannaert V., Van Roy J., Opperdoes F. R., Bakker B. M., Michels P. A. 2005. Experimental and in silico analyses of glycolytic flux control in bloodstream form Trypanosoma brucei. J. Biol. Chem. 280, 28 306–28 315. ( 10.1074/jbc.M502403200) [DOI] [PubMed] [Google Scholar]
- Anderson J. C., Clarke E. J., Arkin A. P., Voigt C. A. 2006. Environmentally controlled invasion of cancer cells by engineered bacteria. J. Mol. Biol. 355, 619–627. ( 10.1016/j.jmb.2005.10.076) [DOI] [PubMed] [Google Scholar]
- Arnold S., Siemann-Herzberg M., Schmid J., Reuss M. 2005. Model-based inference of gene expression dynamics from sequence information. Adv. Biochem. Eng. Biotechnol. 100, 89–179. ( 10.1007/b136414) [DOI] [PubMed] [Google Scholar]
- Baldwin S. A., Perham R. N. 1978. Novel kinetic and structural properties of the class-I d-fructose 1,6-bisphosphate aldolase from Escherichia coli (Crookes’ strain). Biochem. J. 169, 643–652. [DOI] [PMC free article] [PubMed] [Google Scholar]
- Bali M., Thomas S. R. 2001. A modelling study of feedforward activation in human erythrocyte glycolysis. C R Acad. Sci. III 324, 185–199. [DOI] [PubMed] [Google Scholar]
- Bhartiya S., Rawool S., Venkatesh K. V. 2003. Dynamic model of Escherichia coli tryptophan operon shows an optimal structural design. Eur. J. Biochem. 270, 2644–2651. ( 10.1046/j.1432-1033.2003.03641.x) [DOI] [PubMed] [Google Scholar]
- Blangy D., Buc H., Monod J. 1968. Kinetics of the allosteric interactions of phosphofructokinase from Escherichia coli. J. Mol. Biol. 31, 13–35. ( 10.1016/0022-2836(68)90051-X) [DOI] [PubMed] [Google Scholar]
- Buchholz A., Takors R., Wandrey C. 2001. Quantification of intracellular metabolites in Escherichia coli K12 using liquid chromatographic-electrospray ionization tandem mass spectrometric techniques. Anal. Biochem. 295, 129–137. ( 10.1006/abio.2001.5183) [DOI] [PubMed] [Google Scholar]
- Bulik S., Grimbs S., Huthmacher C., Selbig J., Holzhutter H. G. 2009. Kinetic hybrid models composed of mechanistic and simplified enzymatic rate laws—a promising method for speeding up the kinetic modelling of complex metabolic networks. FEBS J. 276, 410–424. ( 10.1111/j.1742-4658.2008.06784.x) [DOI] [PubMed] [Google Scholar]
- Buziol S., Bashir I., Baumeister A., Claassen W., Noisommit-Rizzi N., Mailinger W., Reuss M. 2002. New bioreactor-coupled rapid stopped-flow sampling technique for measurements of metabolite dynamics on a subsecond time scale. Biotechnol. Bioeng. 80, 632–636. ( 10.1002/bit.10427) [DOI] [PubMed] [Google Scholar]
- Caldara M., Dupont G., Leroy F., Goldbeter A., De Vuyst L., Cunin R. 2008. Arginine biosynthesis in Escherichia coli: experimental perturbation and mathematical modeling. J. Biol. Chem. 283, 6347–6358. ( 10.1074/jbc.M705884200) [DOI] [PubMed] [Google Scholar]
- Chalhoub E., Hanson R. W., Belovich J. M. 2007. A computer model of gluconeogenesis and lipid metabolism in the perfused liver. Am. J. Physiol. Endocrinol. Metab. 293, E1676–E1686. ( 10.1152/ajpendo.00161.2007) [DOI] [PubMed] [Google Scholar]
- Chance B. 1964. Rapid mixing and sampling techniques in biochemistry. Pennsylvania University. Eldridge Reeves Johnson Foundation for Medical Physics. Colloquia New York, NY: Academic Press. [DOI] [PubMed] [Google Scholar]
- Chassagnole C., Rais B., Quentin E., Fell D. A., Mazat J. P. 2001. An integrated study of threonine-pathway enzyme kinetics in Escherichia coli. Biochem. J. 356, 415–423. ( 10.1042/0264-6021:3560415) [DOI] [PMC free article] [PubMed] [Google Scholar]
- Chassagnole C., Noisommit-Rizzi N., Schmid J. W., Mauch K., Reuss M. 2002. Dynamic modeling of the central carbon metabolism of Escherichia coli. Biotechnol. Bioeng. 79, 53–73. ( 10.1002/bit.10288) [DOI] [PubMed] [Google Scholar]
- Chin J. W. 2006. Modular approaches to expanding the functions of living matter. Nat. Chem. Biol. 2, 304–311. ( 10.1038/nchembio789) [DOI] [PubMed] [Google Scholar]
- Clarke S. 2003. Aging as war between chemical and biochemical processes: protein methylation and the recognition of age-damaged proteins for repair. Ageing Res. Rev. 2, 263–285. ( 10.1016/S1568-1637(03)00011-4) [DOI] [PubMed] [Google Scholar]
- Conant G. C., Wolfe K. H. 2007. Increased glycolytic flux as an outcome of whole-genome duplication in yeast. Mol. Syst. Biol. 3, 129 ( 10.1038/msb4100170) [DOI] [PMC free article] [PubMed] [Google Scholar]
- D'Alessio G., Josse J. 1971. Glyceraldehyde phosphate dehydrogenase of Escherichia coli. Structural and catalytic properties. J. Biol. Chem. 246, 4326–4333. [PubMed] [Google Scholar]
- de Koning W., van Dam K. 1992. A method for the determination of changes of glycolytic metabolites in yeast on a subsecond time scale using extraction at neutral pH. Anal. Biochem. 204, 118–123. ( 10.1016/0003-2697(92)90149-2) [DOI] [PubMed] [Google Scholar]
- Draeger A., Kronfeld M., Ziller M. J., Supper J., Planatscher H., Magnus J. B., Oldiges M., Kohlbacher O., Zell A. 2009. Modeling metabolic networks in C. glutamicum: a comparison of rate laws in combination with various parameter optimization strategies. BMC Syst. Biol. 3, 5 ( 10.1186/1752-0509-3-5) [DOI] [PMC free article] [PubMed] [Google Scholar]
- Duee E., Olivier-Deyris L., Fanchon E., Corbier C., Branlant G., Dideberg O. 1996. Comparison of the structures of wild-type and a N313T mutant of Escherichia coli glyceraldehyde 3-phosphate dehydrogenases: implication for NAD binding and cooperativity. J. Mol. Biol. 257, 814–838. ( 10.1006/jmbi.1996.0204) [DOI] [PubMed] [Google Scholar]
- Fraser H. I., Kvaratskhelia M., White M. F. 1999. The two analogous phosphoglycerate mutases of Escherichia coli. FEBS Lett. 455, 344–348. ( 10.1016/S0014-5793(99)00910-2) [DOI] [PubMed] [Google Scholar]
- Gibson D. G., et al. 2008. Complete chemical synthesis, assembly, and cloning of a Mcyoplasma genitalium genome. Science 319, 1215–1220. ( 10.1126/science.1151721) [DOI] [PubMed] [Google Scholar]
- Hadlich F., Noack S., Wiechert W. 2009. Translating biochemical network models between different kinetic formats. Metab. Eng. 11, 87–100. ( 10.1016/j.ymben.2008.10.002) [DOI] [PubMed] [Google Scholar]
- Hardiman T., Lemuth K., Keller M. A., Reuss M., Siemann-Herzberg M. 2007. Topology of the global regulatory network of carbon limitation in Escherichia coli. J. Biotechnol. 132, 359–374. ( 10.1016/j.jbiotec.2007.08.029) [DOI] [PubMed] [Google Scholar]
- Harrison D. E., Maitra P. K. 1969. Control of respiration and metabolism in growing Klebsiella aerogenes. The role of adenine nucleotides. Biochem. J. 112, 647–656. [DOI] [PMC free article] [PubMed] [Google Scholar]
- Heinrich R., Rapoport T. A. 1974. A linear steady-state treatment of enzymatic chains. General properties, control and effector strength. Eur. J. Biochem. 42, 89–95. ( 10.1111/j.1432-1033.1974.tb03318.x) [DOI] [PubMed] [Google Scholar]
- Helfert S., Estevez A. M., Bakker B., Michels P., Clayton C. 2001. Roles of triosephosphate isomerase and aerobic metabolism in Trypanosoma brucei. Biochem. J. 357, 117–125. ( 10.1042/0264-6021:3570117) [DOI] [PMC free article] [PubMed] [Google Scholar]
- Hill A. V. 1910. The possible effects of the aggregation of the molecules of haemoglobin on its dissociation curves. J. Physiol. 40, iv–vii. [Google Scholar]
- Hill A. V. 1913. The combinations of haemoglobin with oxygen and with carbon monoxide. I. Biochem. J. 7, 471–480. [DOI] [PMC free article] [PubMed] [Google Scholar]
- Hynne F., Dano S., Sorensen P. G. 2001. Full-scale model of glycolysis in Saccharomyces cerevisiae. Biophys. Chem. 94, 121–163. ( 10.1016/S0301-4622(01)00229-0) [DOI] [PubMed] [Google Scholar]
- Jewett M. C., Calhoun K. A., Voloshin A., Wuu J. J., Swartz J. R. 2008. An integrated cell-free metabolic platform for protein production and synthetic biology. Mol. Syst. Biol. 4, 220 ( 10.1038/msb.2008.57) [DOI] [PMC free article] [PubMed] [Google Scholar]
- Kacser H., Burns J. A. 1973. The control of flux. Symp. Soc. Exp. Biol. 27, 65–104. [PubMed] [Google Scholar]
- Karp P. D., et al. 2005. Expansion of the BioCyc collection of pathway/genome databases to 160 genomes. Nucleic Acids Res. 33, 6083–6089. ( 10.1093/nar/gki892) [DOI] [PMC free article] [PubMed] [Google Scholar]
- Karp P. D., et al. 2007. Multidimensional annotation of the Escherichia coli K-12 genome. Nucleic Acids Res. 35, 7577–7590. ( 10.1093/nar/gkm740) [DOI] [PMC free article] [PubMed] [Google Scholar]
- Keasling J. D. 2008. Synthetic biology for synthetic chemistry. ACS Chem. Biol. 3, 64–76. ( 10.1021/cb7002434) [DOI] [PubMed] [Google Scholar]
- Koshland D. E., Jr, Némethy G., Filmer D. 1966. Comparison of experimental binding data and theoretical models in proteins containing subunits. Biochemistry 5, 365–385. ( 10.1021/bi00865a047) [DOI] [PubMed] [Google Scholar]
- Kotlarz D., Buc H. 1982. Phosphofructokinases from Escherichia coli. Methods Enzymol. 90, 60–70. ( 10.1016/S0076-6879(82)90107-0) [DOI] [PubMed] [Google Scholar]
- Kotlarz D., Garreau H., Buc H. 1975. Regulation of the amount and of the activity of phosphofructokinases and pyruvate kinases in Escherichia coli. Biochim. Biophys. Acta 381, 257–268. [DOI] [PubMed] [Google Scholar]
- Kresnowati M. T., van Winden W. A., Heijnen J. J. 2005. Determination of elasticities, concentration and flux control coefficients from transient metabolite data using linlog kinetics. Metab. Eng. 7, 142–153. ( 10.1016/j.ymben.2004.12.002) [DOI] [PubMed] [Google Scholar]
- Kuhnel K., Luisi B. F. 2001. Crystal structure of the Escherichia coli RNA degradosome component enolase. J. Mol. Biol. 313, 583–592. ( 10.1006/jmbi.2001.5065) [DOI] [PubMed] [Google Scholar]
- Kundig W., Ghosh S., Roseman S. 1964. Phosphate bound to histidine in a protein as an intermediate in a novel phospho-transferase system. Proc. Natl Acad. Sci. USA 52, 1067–1074. ( 10.1073/pnas.52.4.1067) [DOI] [PMC free article] [PubMed] [Google Scholar]
- Lambeth M. J., Kushmerick M. J. 2002. A computational model for glycogenolysis in skeletal muscle. Ann. Biomed. Eng. 30, 808–827. ( 10.1114/1.1492813) [DOI] [PubMed] [Google Scholar]
- Le Novere N., et al. 2006. BioModels Database: a free, centralized database of curated, published, quantitative kinetic models of biochemical and cellular systems. Nucleic Acids Res. 34, D689–D691. ( 10.1093/nar/gkj092) [DOI] [PMC free article] [PubMed] [Google Scholar]
- Leslie A. G., Wonacott A. J. 1983. Coenzyme binding in crystals of glyceraldehyde-3-phosphate dehydrogenase. J. Mol. Biol. 165, 375–391. ( 10.1016/S0022-2836(83)80262-9) [DOI] [PubMed] [Google Scholar]
- Liebermeister W., Klipp E. 2006. Bringing metabolic networks to life: convenience rate law and thermodynamic constraints. Theor. Biol. Med. Model 3, 41 ( 10.1186/1742-4682-3-41) [DOI] [PMC free article] [PubMed] [Google Scholar]
- Lunin V. V., Li Y., Schrag J. D., Iannuzzi P., Cygler M., Matte A. 2004. Crystal structures of Escherichia coli ATP-dependent glucokinase and its complex with glucose. J. Bacteriol. 186, 6915–6927. ( 10.1128/JB.186.20.6915-6927.2004) [DOI] [PMC free article] [PubMed] [Google Scholar]
- Maharjan R. P., Ferenci T. 2003. Global metabolite analysis: the influence of extraction methodology on metabolome profiles of Escherichia coli. Anal. Biochem. 313, 145–154. [DOI] [PubMed] [Google Scholar]
- Maier K., Hofmann U., Reuss M., Mauch K. 2008. Identification of metabolic fluxes in hepatic cells from transient 13C-labeling experiments: Part II. Flux estimation. Biotechnol. Bioeng. 100, 355–370. ( 10.1002/bit.21746) [DOI] [PubMed] [Google Scholar]
- Marchisio M. A., Stelling J. 2008. Computational design of synthetic gene circuits with composable parts. Bioinformatics 24, 1903–1910. ( 10.1093/bioinformatics/btn330) [DOI] [PubMed] [Google Scholar]
- Markus M., Plesser T., Boiteux A., Hess B., Malcovati M. 1980. Analysis of progress curves. Rate law of pyruvate kinase type I from Escherichia coli. Biochem. J. 189, 421–433. [DOI] [PMC free article] [PubMed] [Google Scholar]
- Mashego M. R., Rumbold K., De Mey M., Vandamme E., Soetaert W., Heijnen J. J. 2007. Microbial metabolomics: past, present and future methodologies. Biotechnol. Lett. 29, 1–16. ( 10.1007/s10529-006-9218-0) [DOI] [PubMed] [Google Scholar]
- Meyer A. J., Pellaux R., Panke S. 2007. Bioengineering novel in vitro metabolic pathways using synthetic biology. Curr. Opin. Microbiol. 10, 246–253. ( 10.1016/j.mib.2007.05.009) [DOI] [PubMed] [Google Scholar]
- Meyer D., Schneider-Fresenius C., Horlacher R., Peist R., Boos W. 1997. Molecular characterization of glucokinase from Escherichia coli K-12. J. Bacteriol. 179, 1298–1306. [DOI] [PMC free article] [PubMed] [Google Scholar]
- Michaelis L., Menten M. L. 1913. The kinetics of the inversion effect. Biochem. Z. 49, 333–369. [Google Scholar]
- Monod J. 1947. The phenomenon of enzymatic adaptation and its bearings on problems of genetics and cellular differentiation. Growth 11, 223–289. [Google Scholar]
- Monod J., Changeux J. P., Jacob F. 1963. Allosteric proteins and cellular control systems. J. Mol. Biol. 6, 306–329. [DOI] [PubMed] [Google Scholar]
- Monod J., Wyman J., Changeux J. P. 1965. On the nature of allosteric transitions: a plausible model. J. Mol. Biol. 12, 88–118. [DOI] [PubMed] [Google Scholar]
- Nahalka J., Liu Z. Y., Chen X., Wang P. G. 2003. Superbeads: immobilization in ‘sweet’ chemistry. Chem. Eur. J. 9, 373–377. ( 10.1002/chem.200390038) [DOI] [PubMed] [Google Scholar]
- Nakamura C. E., Whited G. M. 2003. Metabolic engineering for the microbial production of 1,3-propanediol. Curr. Opin. Biotechnol. 14, 454–459. ( 10.1016/j.copbio.2003.08.005) [DOI] [PubMed] [Google Scholar]
- Neidhardt F. C. (ed.) 1996. Escherichia coli and Salmonella. Washington, DC: ASM Press. [Google Scholar]
- Novick A., Szilard L. 1950. Experiments with the chemostat on spontaneous mutations of bacteria. Proc. Natl Acad. Sci. USA 36, 708–719. ( 10.1073/pnas.36.12.708) [DOI] [PMC free article] [PubMed] [Google Scholar]
- Ogawa T., Mori H., Tomita M., Yoshino M. 2007. Inhibitory effect of phosphoenolpyruvate on glycolytic enzymes in Escherichia coli. Res. Microbiol. 158, 159–163. ( 10.1016/j.resmic.2006.11.003) [DOI] [PubMed] [Google Scholar]
- Popova S. V., Sel'kov E. E. 1975. Generalization of the model by Monod, Wyman and Changeux for the case of a reversible monosubtrate reaction SR,TP. FEBS Lett. 53, 269–273. ( 10.1016/0014-5793(75)80034-2) [DOI] [PubMed] [Google Scholar]
- Popova S. V., Sel'kov E. E. 1976. Generalization of the Monod–Wyman–Changeux model for the case of multisubstrate reactions. Mol. Biol. (Mosk.) 10, 1116–1126. [PubMed] [Google Scholar]
- Postma P. W., Lengeler J. W., Jacobson G. R. 1993. Phosphoenolpyruvate:carbohydrate phosphotransferase systems of bacteria. Microbiol. Rev. 57, 543–594. [DOI] [PMC free article] [PubMed] [Google Scholar]
- Rais B., Chassagnole C., Letellier T., Fell D. A., Mazat J. P. 2001. Threonine synthesis from aspartate in Escherichia coli cell-free extracts: pathway dynamics. Biochem. J. 356, 425–432. ( 10.1042/0264-6021:3560425) [DOI] [PMC free article] [PubMed] [Google Scholar]
- Richter O., Betz A., Giersch C. 1975. The response of oscillating glycolysis to perturbations in the NADH/NAD system: a comparison between experiments and a computer model. Biosystems 7, 137–146. ( 10.1016/0303-2647(75)90051-9) [DOI] [PubMed] [Google Scholar]
- Rizzi M., Baltes M., Theobald U., Reuss M. 1997. In vivo analysis of metabolic dynamics in Saccharomyces cerevisiae: II. Mathematical model. Biotechnol. Bioeng. 55, 592–608. ( 10.1002/(SICI)1097-0290(19970820)55:4%3C592::AID-BIT2%3E3.0.CO;2-C) [DOI] [PubMed] [Google Scholar]
- Rose I. A., O'Connell E. L., Mehler A. H. 1965. Mechanism of the aldolase reaction. J. Biol. Chem. 240, 1758–1765. [PubMed] [Google Scholar]
- Savageau M. A. 1995. Enzyme kinetics in vitro and in vivo: Michaelis–Menten revisited. In Cell chemistry and physiology, vol. 4, pp. 93–146. Stamford, CT: JAI Press Inc. [Google Scholar]
- Schaefer U., Boos W., Takors R., Weuster-Botz D. 1999. Automated sampling device for monitoring intracellular metabolite dynamics. Anal. Biochem. 270, 88–96. ( 10.1006/abio.1999.4048) [DOI] [PubMed] [Google Scholar]
- Schaub J., Schiesling C., Reuss M., Dauner M. 2006. Integrated sampling procedure for metabolome analysis. Biotechnol. Prog. 22, 1434–1442. ( 10.1021/bp050381q) [DOI] [PubMed] [Google Scholar]
- Schauer M., Heinrich R., Rapoport S. M. 1981. Mathematische Modellierung der Glykolyse und des Adeninnukleotidstoffwechsels menschlicher Erythrozyten. I. Reaktionskinetische Ansatze, Analyse des in vivo-Zustandes und Bestimmung der Anfangsbedingungen fur die in vitro-Experimente. Acta Biol. Med. Ger. 40, 1659–1682. [PubMed] [Google Scholar]
- Schierbeck B., Larsson-Raznikiewicz M. 1979. Product inhibition studies of yeast phosphoglycerate kinase evaluating properties of multiple substrate binding sites. Biochim. Biophys. Acta 568, 195–204. [DOI] [PubMed] [Google Scholar]
- Schmidt P. P., Travers F., Barman T. 1995. Transient and equilibrium kinetic studies on yeast 3-phosphoglycerate kinase. Evidence that an intermediate containing 1,3-bisphosphoglycerate accumulates in the steady state. Biochemistry 34, 824–832. ( 10.1021/bi00003a016) [DOI] [PubMed] [Google Scholar]
- Schreyer R., Bock A. 1980. Phosphoglucose isomerase from Escherischia coli K 10: purification, properties and formation under aerobic and anaerobic condition. Arch. Microbiol. 127, 289–298. ( 10.1007/BF00427206) [DOI] [PubMed] [Google Scholar]
- Schuetz R., Kuepfer L., Sauer U. 2007. Systematic evaluation of objective functions for predicting intracellular fluxes in Escherichia coli. Mol. Syst. Biol. 3, 119 ( 10.1038/msb4100162) [DOI] [PMC free article] [PubMed] [Google Scholar]
- Segel I. H. 1975. Enzyme kinetics behavior and analysis of rapid equilibrium and steady-state enzyme systems. New York: Wiley. [Google Scholar]
- Shimizu Y., Inoue A., Tomari Y., Suzuki T., Yokogawa T., Nishikawa K., Ueda T. 2001. Cell-free translation reconstituted with purified components. Nat. Biotechnol. 18, 751–755. ( 10.1038/90802) [DOI] [PubMed] [Google Scholar]
- Shimizu Y., Kuruma Y., Ying B.-W., Umekage S., Ueda T. 2006. Cell-free translation systems for protein engineering. FEBS J. 273, 4133–4140. ( 10.1111/j.1742-4658.2006.05431.x) [DOI] [PubMed] [Google Scholar]
- Streichert F., Ulmer H. 2005. JavaEvA—a Java framework for evolutionary algorithms. Tübingen: Centre for Bioinformatics Tübingen, University of Tübingen. [Google Scholar]
- Suarez M., Tortosa P., Carrera J., Jaramillo A. 2008. Pareto optimization in computational protein design with multiple objectives. J. Comput. Chem. 29, 2704–2711. ( 10.1002/jcc.20981) [DOI] [PubMed] [Google Scholar]
- Tchieu J. H., Norris V., Edwards J. S., Saier M. H., Jr 2001. The complete phosphotranferase system in Escherichia coli. J. Mol. Microbiol. Biotechnol. 3, 329–346. [PubMed] [Google Scholar]
- Teusink B., et al. 2000. Can yeast glycolysis be understood in terms of in vitro kinetics of the constituent enzymes? Testing biochemistry. Eur. J. Biochem. 267, 5313–5329. ( 10.1046/j.1432-1327.2000.01527.x) [DOI] [PubMed] [Google Scholar]
- Theobald U., Mailinger W., Reuss M., Rizzi M. 1993. In vivo analysis of glucose-induced fast changes in yeast adenine nucleotide pool applying a rapid sampling technique. Anal. Biochem. 214, 31–37. ( 10.1006/abio.1993.1452) [DOI] [PubMed] [Google Scholar]
- Theobald U., Mailinger W., Baltes M., Rizzi M., Reuss M. 1997. In vivo analysis of metabolic dynamics in Saccharomyces cerevisiae. I. Experimental observations. Biotechnol. Bioeng. 55, 305–316. ( 10.1002/(SICI)1097-0290(19970720)55:2%3C305::AID-BIT8%3E3.0.CO;2-M) [DOI] [PubMed] [Google Scholar]
- Thomson G. J., Howlett G. J., Ashcroft A. E., Berry A. 1998. The dhnA gene of Escherichia coli encodes a class I fructose bisphosphate aldolase. Biochem. J. 331, 437–445. [DOI] [PMC free article] [PubMed] [Google Scholar]
- Tian J., Gong H., Sheng N., Zhou X., Gulari E., Gao X., Church G. 2004. Accurate multiplex gene synthesis from programmable DNA microchips. Nature 432, 1050–1054. ( 10.1038/nature03151) [DOI] [PubMed] [Google Scholar]
- Vaseghi S., Baumeister A., Rizzi M., Reuss M. 1999. In vivo dynamics of the pentose phosphate pathway in Saccharomyces cerevisiae. Metab. Eng. 1, 128–140. ( 10.1006/mben.1998.0110) [DOI] [PubMed] [Google Scholar]
- Vaz A., Vicente L. 2007. A particle swarm pattern search method for bound constrained global optimization. J. Global Optim. 39, 197–219. ( 10.1007/s10898-007-9133-5) [DOI] [Google Scholar]
- Visser D., Heijnen J. J. 2003. Dynamic simulation and metabolic re-design of a branched pathway using linlog kinetics. Metab. Eng. 5, 164–176. ( 10.1016/S1096-7176(03)00025-9) [DOI] [PubMed] [Google Scholar]
- Visser D., et al. 2002. Rapid sampling for analysis of in vivo kinetics using the BioScope: a system for continuous-pulse experiments. Biotechnol. Bioeng. 79, 674–681. ( 10.1002/bit.10328) [DOI] [PubMed] [Google Scholar]
- Visser D., Schmid J. W., Mauch K., Reuss M., Heijnen J. J. 2004. Optimal re-design of primary metabolism in Escherichia coli using linlog kinetics. Metab. Eng. 6, 378–390. ( 10.1016/j.ymben.2004.07.001) [DOI] [PubMed] [Google Scholar]
- Wang L., Xie J., Schultz P. G. 2006. Expanding the genetic code. Annu. Rev. Biophys. Biomol. Struct. 35, 225–249. ( 10.1146/annurev.biophys.35.101105.121507) [DOI] [PubMed] [Google Scholar]
- Waygood E. B., Sanwal B. D. 1974. The control of pyruvate kinases of Escherichia coli. I. Physicochemical and regulatory properties of the enzyme activated by fructose 1,6-diphosphate. J. Biol. Chem. 249, 265–274. [PubMed] [Google Scholar]
- Waygood E. B., Rayman M. K., Sanwal B. D. 1975. The control of pyruvate kinases of Escherichia coli. II. Effectors and regulatory properties of the enzyme activated by ribose 5-phosphate. Can. J. Biochem. 53, 444–454. [DOI] [PubMed] [Google Scholar]
- Weuster-Botz D. 1997. Sampling tube device for monitoring intracellular metabolite dynamics. Anal. Biochem. 246, 225–233. ( 10.1006/abio.1997.2009) [DOI] [PubMed] [Google Scholar]
- Winder C. L., Dunn W. B., Schuler S., Broadhurst D., Jarvis R., Stephens G. M., Goodacre R. 2008. Global metabolic profiling of Escherichia coli cultures: an evaluation of methods for quenching and extraction of intracellular metabolites. Anal. Chem. 80, 2939–2948. ( 10.1021/ac7023409) [DOI] [PubMed] [Google Scholar]
- Wurm F. 2004. Production of recombinant protein therapeutics in cultivated mammalian cells. Nat. Biotechnol. 22, 1393–1398. ( 10.1038/nbt1026) [DOI] [PubMed] [Google Scholar]
- Yang C. R., Shapiro B. E., Hung S. P., Mjolsness E. D., Hatfield G. W. 2005. A mathematical model for the branched chain amino acid biosynthetic pathways of Escherichia coli K12. J. Biol. Chem. 280, 11 224–11 232. ( 10.1074/jbc.M411471200) [DOI] [PubMed] [Google Scholar]
- Yokobayashi Y., Weiss R., Arnold F. H. 2002. Directed evolution of a genetic circuit. Proc. Natl Acad. Sci. USA 99, 16 587–16 591. ( 10.1073/pnas.252535999) [DOI] [PMC free article] [PubMed] [Google Scholar]
- Zgiby S. M., Thomson G. J., Qamar S., Berry A. 2000. Exploring substrate binding and discrimination in fructose1, 6-bisphosphate and tagatose 1,6-bisphosphate aldolases. Eur. J. Biochem. 267, 1858–1868. ( 10.1046/j.1432-1327.2000.01191.x) [DOI] [PubMed] [Google Scholar]