

Abstract
X-ray and neutron-scattering techniques characterize proteins in solution and complement high-resolution structural studies. They are useful when either a large protein cannot be crystallized, in which case scattering yields a solution structure, or a crystal structure has been determined and requires validation in solution. These solution structures are determined by the application of constrained modelling methods based on known subunit structures. First, an appropriate starting model is generated. Next, its conformation is randomized to generate thousands of models for trial-and-error fits. Comparison with the experimental data identifies a small family of best-fit models. Finally, their significance for biological function is assessed. We illustrate this in application to structure determinations for secretory immunoglobulin A, the most prevalent antibody in the human body and a first line of defence in mucosal immunity. We also discuss the applications to the large multi-domain proteins of the complement system, most notably its major regulator factor H, which is important in age-related macular degeneration and renal diseases. We discuss the importance of complementary data from analytical ultracentrifugation, and structural studies of protein–protein complexes. We conclude that constrained scattering modelling makes useful contributions to our understanding of antibody and complement structure and function.
Keywords: immunoglobulin A, complement factor H, analytical ultracentrifugation, constrained modelling, neutron scattering, X-ray scattering
1. Introduction
Macromolecular structure determinations have made powerful advances in the last three decades. Between 1976 and 2008, over 55 000 experimentally determined macromolecular structures were deposited in the Protein Data Bank (http://www.rcsb.org), of which over 47 000 were from crystallography, over 7600 were from NMR and over 200 were from electron microscopy. X-ray and neutron-constrained scattering modelling as an additional means to determine structures form the focus of this review. Overall shape information is provided by solution scattering (and also from electron microscopy). Solution scattering offers the possibility of studying intact, large molecules in near-physiological conditions. It is applicable to protein sizes above approximately 15 kDa. The first overall views of many protein structures have been obtained by X-ray or neutron scattering. The two strengths of solution scattering are (i) the ability to produce molecular structures when crystals cannot be obtained (although only at medium structural resolution) and (ii) the validation of protein crystal structures in solution. For both of these, constrained scattering modelling methods are essential. In distinction to scattering, crystallography provides atomic-resolution detail for a broad range of macromolecules of all sizes, while NMR does so for smaller macromolecules. In combination, all these methods greatly increase the understanding of the biological system of interest. Thus, crystallography provides unrivalled fine structural detail, but two limitations are (i) the need to obtain well-ordered crystals and (ii) the sometime unphysiological buffers needed to obtain crystals that may affect the protein conformation. NMR provides solution structures (although the macromolecular concentrations for NMR can be higher than its physiological range), and these can be explored as a function of pH and ionic strength, including the monitoring of any significant flexibility within the structure. The main limitation of NMR is the comparatively low size of the macromolecules that can be studied.
In recent years, a greater range of proteins have been successfully studied by scattering, including antibodies of adaptive immunity and the complement proteins of innate immunity. Scattering is a diffraction method that studies the overall structure of macromolecules in random orientations in solution (Perkins et al. 2008). This is distinct from crystallography, which studies the diffraction from ordered and orientated macromolecules. In the experiment, the intensities I(Q) of the scattering curve are measured as a function of Q, where Q = 4π sin θ/λ (2θ = scattering angle; λ = wavelength; figure 1). Two types of data analyses are performed. Using data at the lowest scattering angles, Guinier plots of ln I(Q) versus Q2 lead to the molecular weight from the I(0) parameter at zero Q and the radius of gyration RG. Linearity of the Guinier plots establishes the monodispersity of the macromolecule. At larger Q values, the radius of gyration of the cross section RXS is obtained for elongated macromolecules. Using the full Q range of the scattering data, the Fourier transformation of the I(Q) scattering curve (measured in reciprocal space with units of nm−1) results in the distance distribution function P(r). The P(r) curve provides the maximum dimension of the macromolecule and its shape in real space, together with an independent measure of the I(0) and RG values. High-flux sources include X-rays at the European Synchrotron Radiation Facility (ESRF), and neutrons at the Institut Laue-Langevin (ILL), and the instruments there have been upgraded with improved detectors. During the past decade, more extensive applications of scattering have resulted from accessing lower sample concentrations and larger Q ranges with shorter data acquisition times. A typical scattering instrument is depicted in figure 2. The concurrent improvements in antibody and complement protein purifications have provided sufficient quantities of native or recombinant proteins for structural studies. The resulting abundance of high-quality scattering data for structural analyses means that proteins can now be studied in extensive concentration series or as a function of pH or ionic strength.
Figure 1.

Schematic representations of the scattering experiment. (a) Scattering from two point scatterers (filled circles) within a globular macromolecule. The diffracted rays are in phase with each other but out of step by λ at the scattering angle 2θ shown. This causes constructive interference. The accumulation of these events at low 2θ values gives rise to the scattering pattern of the macromolecule. (b) The diffraction from high-scattering-density macromolecules in a low-scattering-density solution gives rise to a scattering pattern on an area detector. q is the scattering vector ks− ki, whose magnitude Q = |q| = 4π sin θ /λ. The radial average of the scattering pattern about the position of the direct main beam (masked by a beam stop) gives rise to the scattering curve I(Q) in reciprocal space. Fourier transformation of this to the P(r) curve gives real-space information. Adapted from Perkins et al. (2008).
Figure 2.

Schematic side and back three-dimensional views of the new neutron-scattering instrument SANS2d at the TS2 at ISIS with two area detectors inside its detector tank. Figure kindly provided courtesy of D. Turner and Dr R. K. Heenan, ISIS.
Scattering modelling determines a three-dimensional structure or shape that best accounts for the observed scattering curve. Even though unique structure determinations are not possible for reason of the random molecular orientations observed by scattering, modelling is able to rule out structures that are incompatible with the scattering curves. Hence, the basic premise of constrained modelling is that, by fixing parts of the structural analyses to what is already known about the macromolecule, the scattering fits are subject to significantly fewer modelling variables. The procedure rejects poor-fit models, and ranks the good-fit models in order of their compatibility with the data. Constrained modelling originated with small sphere models and the Debye equation (Glatter & Kratky 1982). Initially, several fixed assemblies of small spheres, sometimes with guidance from electron micrograph images, were manually adjusted in their relative orientation until the scattering curve calculated from the spheres accounted for the experimental scattering curve (Perkins & Furtado 2005). The disadvantage of this procedure is that the resulting molecular models are not easily visualized in terms of individual residues or known structures that make up the macromolecule.
The latest instrumental developments in data acquisition (see above) have been complemented by constrained solution scattering modelling (Perkins et al. 1998, 2008). This time, known structures that make up the macromolecule are used directly in the scattering curve calculations. First, a stereochemically accurate and complete starting macromolecular model is created using molecular graphics, starting from molecular structures from known crystal or NMR structures. Inspection reveals the features that are likely to vary and which need to be defined by the modelling fits. A large number of models in conformationally randomized orientations are generated for comparison with the experimental data by a trial-and-error procedure. Usually less than 1 per cent of these conformers will yield good curve fits, and thus these define the solution structure of interest. The best 8–10 models are deposited in the Protein Data Bank. The resulting structural information is obtained to a precision of 0.5–1.0 nm, in comparison to the 2–4 nm resolutions of scattering modelling performed without these constraints. Even though the best models correspond to medium structural resolutions, the resulting best-fit models reveal the topology of the molecular structure and often provide biologically useful information on subunit arrangements.
This strategy was first used to model pentameric human immunoglobulin (Ig) M manually in terms of known Fab and Fc crystal structures from IgG (Perkins et al. 1991). It was automated to model human immunoglobulin A1 (IgA1) through the use of Unix scripts (Boehm et al. 1999). Subsequent applications have included other antibody classes (Perkins & Bonner 2008), the unravelling of the assembly of secretory IgA (SIgA) from two antibody monomers, a J chain domain and a five-domain secretory component (SC; Bonner et al. 2009a,b) and several complement proteins including factor H (FH) and properdin (Aslam & Perkins 2001; Sun et al. 2004). These last two examples will be discussed below. A detailed account of these studies for the specialist is presented elsewhere (Perkins et al. 2008). The present review updates and summarizes this strategy for the more general reader.
2. Experimental data acquisition
Intense beams of X-rays or neutrons are required for biological scattering experiments. The reason for this is that the probability of a diffraction event when a X-ray photon (or a neutron) approaches an electron or a nucleus is very low at 10−25 (or 10−23), respectively. Biology experiments usually involve dilute macromolecular samples; therefore, the signal–noise ratios can be poor. High-flux sources overcome this significant limitation. The most powerful X-ray synchrotrons are the ‘third-generation’ machines that are exemplified by the 6 GeV ESRF in Grenoble, France. The most powerful neutron reactor source is the 58 MW High-Flux Reactor at the ILL in Grenoble, France, while the most successful spallation (pulsed) neutron source is ISIS, Oxfordshire, UK. ISIS was upgraded in 2008 by the addition of its £145 million Second Target Station (TS2) to significantly increase its neutron flux.
Typical synchrotron X-ray scattering instruments include those at Instrument ID02 at the ESRF (Narayanan et al. 2001). The synchrotron generates a white beam of all wavelengths including X-rays. This beam is received at ID02, and is focused and monochromated before it reaches the sample. Conventional small-angle scattering is performed with pin-hole optics, using a setup based on a two-dimensional detector in a vacuum within a 10 m long detector tank for low and medium Q measurements, together with a second detector mounted outside the tank to record the scattering curve at large Q. At ID02, the maximum photon flux at the sample position is of the order of 3 × 10¹³ photons s−1 (100 mA)−1. The maximum sample exposure times are approximately 10 s at ESRF. To control and remove radiation damage effects, samples (25 µl volume) are continuously moved during beam exposures through a 1 mm wide quartz capillary tube controlled by a mechanical syringe.
Neutron-scattering instruments maximize the incident flux on the sample by the use of physically large designs and large samples, also using pin-hole optics. The main scattering instruments at the ILL are D11 and D22. The maximum neutron flux is 1.2 × 10⁸ neutrons cm−2 s−1 on D22. After beam monochromatization and collimation, the diffraction from samples in quartz cells (1 or 2 mm thickness; volume 150 or 300 µl) is recorded on two-dimensional detectors positioned inside large vacuum detector tubes to achieve the required Q range. At ISIS, the pulsed neutron beam is monochromatized using time-of-flight techniques. Each neutron in every pulse from the target will reach the detector at different times depending on its velocity from the target. The neutron velocity determines its wavelength. Because all the neutrons in each pulse are used for data acquisition, the entire Q range can be measured simultaneously. This is ideal for both P(r) calculations and for kinetic time-dependence experiments at ISIS. At TS2, the new SANS2d scattering camera (figure 2) has two detectors and will be comparable in performance with D11 and D22 at ILL.
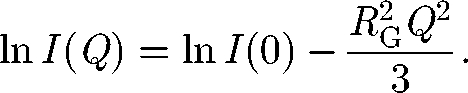
Scattering data are first analysed at low Q values. Guinier analyses of the scattering curve I(Q) (figure 1) provide the radius of gyration RG (a measure of macromolecular elongation) and the molecular weight Mr from the forward scattered intensity I(0). The Guinier fit of ln I(Q) as a function of Q2 (Glatter & Kratky 1982) is based on
 |
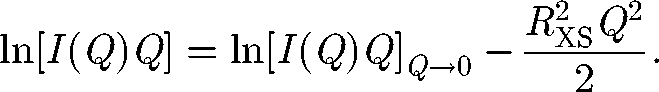
A satisfactory analysis requires that the fitted data include Q values well below Q × RG of 1 for the approximation to be valid. For elongated macromolecules, the mean cross-sectional radius of gyration RXS and the cross-sectional intensity at zero angle [I(Q)Q]Q→0 are obtained using fits in a larger Q range:
 |
X-ray-induced radiation damage is often significant, usually causing the protein to aggregate. A manuscript submitted for publication based on X-ray scattering can be rejected if no checks have been reported to confirm its absence. Proteins can also aggregate in heavy water buffers. Sample dilution series are important to confirm that concentration-dependent effects on the scattering curve are absent. Both these issues are analysed using the Guinier RG plots.
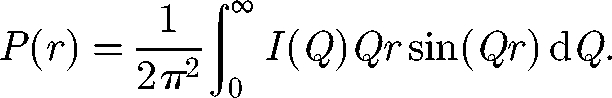
If the complete scattering curve I(Q) in reciprocal space is transformed into the distance distribution function P(r) in real space (figure 1), the solution structure is more directly visualized. P(r) corresponds to the distribution of all the distances r between all the volume elements within the macromolecule. The point at which P(r) becomes zero at large r gives the maximum length L of the protein. The maximum M in the P(r) curve gives the most commonly occurring distances within the macromolecule. The P(r) calculation gives an alternative calculation of the RG and I(0) values that should agree with the Guinier-determined values
 |
X-ray scattering is distinguished by high primary beam intensities and minimal instrumental errors caused by wavelength polychromicity and beam divergence. X-ray scattering reveals the hydrated dimensions of the macromolecule. Hydration means that a monolayer of water molecules is hydrogen bonded to the protein surface, and the electron density of this bound water is higher than that of bulk water, making this detectable (Perkins 2001).
X-rays interact with electrons, and thus the scattering intensity is proportional to atomic number, whereas the interaction of neutrons with the atomic nuclei does not vary in a regular way with atomic number. Neutron scattering is different from X-ray scattering for reason of the method of contrast variation. The very different neutron-scattering lengths of hydrogen and deuterium mean that lipids, proteins and nucleic acids each have their own distinct scattering densities that are equivalent to buffers containing 8, 42 and 65 per cent 2H2O in that order. In contrast variation experiments, different mixtures of H2O and 2H2O are used to vary the buffer scattering density. The right choice of buffer will locate a structure within a multi-component macromolecule, e.g. the location of detergents or lipids in solubilized membrane proteins, or the location of DNA or RNA in their complexes with protein. Deuteration-labelling methods mean that a deuterated macromolecule can be located within a large complex. In contrast variation analyses, the neutron RG values depend on the heavy water buffer, and this is analysed using Stuhrmann plots in at least three contrasts (Ibel & Stuhrmann 1975). By working in 100 per cent 2H2O buffers, the neutron buffer background is very low, even in the presence of high salt (X-rays are absorbed strongly in high-salt buffers). By neutrons, radiation damage effects are absent. The hydration shell is not visible in neutron scattering for reason of the exchange of H and 2H atoms with bulk solvent. Hence the unhydrated dimensions of the macromolecule are studied by neutrons.
More detailed background on these practical aspects is given elsewhere (Perkins et al. 2008).
3. Algorithm for constrained scattering modelling
Constrained modelling extends the experimental Guinier and P(r) analyses by determining the three-dimensional molecular model that accounts for the observed scattering curve. Known atomic structures from NMR or crystallography provide the major constraint of scattering curve modelling. If not available, they are usually obtained by the use of homology (or ‘comparative’) modelling using a package such as Modeller. Other constraints include the known sequence to define the subunit connectivity and the macromolecular volume, and any known symmetry in the structure. Unique structure determinations are not possible. The strength of constrained modelling is to rule out molecular structures that are incompatible with the scattering curves. The relatively few models that emerge from this procedure can provide biologically useful information. The four stages of constrained modelling are now summarized (figure 3).
Figure 3.

The constrained modelling algorithm and its output. The atomic coordinates of an extended SC model (composed of domains D1–D5) are converted into spheres using a three-dimensional grid of cubes. A Debye sphere is assigned to each cube that contains sufficient atoms (shown in projection). The hydration shell spheres are added. The neutron-scattering curve is calculated using the unhydrated sphere model. The X-ray scattering curve and the sedimentation coefficient are calculated from the hydrated sphere model. The use of 10 000 randomized conformations leads to their computed scattering parameters. These are displayed graphically. For two modelling searches for SC (shown as white and grey circles: see text), the R-factor and RXS values are compared with the RG values. The best-fit model with a good RG value is near the minimum of the R-factor values, and has a high RXS value. The extended model shows a poor curve fit, and its parameters deviate from the minimum of the graphs. Adapted from Perkins & Bonner (2008). Copyright © The Biochemical Society (http://www.biochemsoctrans.org/).
3.1. Trial structures
The prerequisite is a starting unhydrated coordinate model for the macromolecule. Completeness is important; for example, in an antibody, all the oligosaccharide chains need to be added (figure 4). From this, a sufficiently large number of conformationally randomized but stereochemically correct structures are generated in order to sample all the possible conformations permitted by the structure. In the case of subunits joined by a linker peptide, this linker is identified from the starting model, then different conformations are derived for the linkers. Initially, the linker is modelled as an extended β-strand structure. Then, molecular dynamics methods are used to generate 2000–10 000 randomized conformers of this. Once the linkers are merged with atomic structures for the subunits in order to assemble full models, this total is usually sufficient to explore the conformational variants in the macromolecule by scattering modelling.
Figure 4.

Ribbon views of three antibody structures (IgA1, IgA2 and IgD) and SC. All four structures were determined by constrained scattering modelling. The SC domain arrangement is folded back and results in the best-fit solution shown in figure 3. Oligosaccharide structures are shown in cyan. Their PDB codes are as follows: human IgA1, 1iga; human IgA2m(1), 1r70; human IgD, 1zvo; human SC, 2ocw. Adapted from Perkins & Bonner (2008). Copyright © The Biochemical Society (http://www.biochemsoctrans.org/).
3.2. Curve simulations
The scattering curve I(Q) is calculated using Debye's Law adapted to spheres, essentially by computing all the distances r from each sphere to the remaining spheres and summing the results. Several hundred Debye spheres are used to replace thousands of atoms in the macromolecular structure, and these provide sufficient details for modelling while being less demanding in terms of processor power (Glatter & Kratky 1982). The coordinate model is placed within a grid of cubes and converted to spheres. The optimal cube side (approx. 0.55 nm) and the atom cutoff for a cube to be allocated as a sphere (about four atoms) are first determined using one of the most extended macromolecular models. The theoretical scattering curves are then calculated for each of the 2000–10 000 models. These are compared one by one with the best scattering curves used for the P(r) calculation.
For comparison with the X-ray scattering curve, no corrections for the instrumental geometry or wavelength are required. However a hydration shell has to be added to the model because this is visualized by X-rays as an electron-dense layer of solvent that surrounds the protein with a similar scattering density to that of the protein. In typical dilute buffers with 137 mM NaCl (physiological), a hydration shell is well represented as a monolayer of water surrounding the protein surface, which corresponds to 0.3 g of water per gram of glycoprotein (Perkins 2001). To compute this, extra spheres are added around every sphere in the model, and then the duplicated and excess spheres are removed in order to achieve the required macromolecular hydrated volume (Ashton et al. 1997). Crystallographic observed water molecules are usually incomplete in number and cannot be used.
For comparison with the neutron-scattering curve, the hydration shell is largely invisible (Perkins 2001), thus unhydrated models are used. The neutron-scattering density of the hydration shell after any relevant hydrogen–deuterium exchange is close to that of the bulk water solvent, and not to that of the protein. While no neutron curve corrections are needed at low Q, the physically large neutron camera dimensions lead to issues of wavelength spread (typically 10%) and beam divergence effects (typically 0.016 rad) at large Q. The calculated curve is corrected for both these. In addition, a flat neutron background arises from the incoherent scatter from non-exchangeable macromolecular protons or residual solvent protons. This requires a uniform correction of 0.5–2.7 per cent of I(0) at all Q-values (Furtado et al. 2004; Bonner et al. 2007).
3.3. Comparisons against X-ray and neutron data
The comparison of the 2000–10 000 scattering curves against the experimental X-ray and neutron curves is performed as automatically as possible. First, the number of spheres in each model is compared against the expected total number of spheres expected from the sequence and composition. Models should have at least 95 per cent of the expected number of spheres, and this comparison eliminates the subset of conformationally randomized models whose subunits have sterically overlapped with each other. Next, Unix script files are used to compute the Guinier RG and RXS values directly from each modelled curve. Thus models are retained using these parameters as filters if their Guinier-fitted RG and RXS values are within 5 per cent (or ±0.3 nm) from the experimental values. After filtering is complete, the goodness-of-fit R-factor (=100 × Σ |I(Q)exp − I(Q)cal)| / Σ |I(Q)exp|) is computed to rank the final models according to their R-factors. Good R-factors are less than 10 per cent, and preferably below 5 per cent (figure 3). A graph of R-factors versus RG values will show a clear minimum at an RG value that corresponds to the experimental RG value. This graph confirms that a sufficient number of conformationally randomized models have been tested, and is a key control of the modelling.
3.4. Interpretation of the best-fit structures
Generally, starting from 2000–10 000 randomized models, approximately 1 per cent of these will give good curve fits. The best curve fits are confirmed by visual inspection of the experimental and modelled I(Q) and P(r) curves (figure 3). The best-fit coordinate models are visually inspected for a stereochemically reasonable outcome, such as the absence of atoms that are too close to each other. Because this is an experimental structure determination, this is eligible for the Protein Data Bank (http://www.rcsb.org). The α-carbon coordinates for about 10 best-fit models are deposited in this to illustrate the type of structures that are consistent with the scattering data.
The key feature of this constrained modelling procedure is that the full stereochemically complete macromolecular structure is computed prior to the curve fitting, not afterwards. In distinction to this, alternative ‘ab initio’ scattering fit approaches such as SASHA, DAMMIN and GASBOR remain popular (Svergun & Koch 2003). Using these, the scattering curve is modelled using three-dimensional mathematical functions that reproduce the external shape, surface or envelope of the macromolecule. The method assumes that the protein can be represented by a compact structure of uniform scattering density. The fits are relatively quick compared with constrained modelling. In distinction to constrained modelling, the main difference is that no coordinate models are involved in the fits, so there are no structural constraints. Subsequently, visual comparisons of the computed surface envelope with related crystal structures provide an interpretation of the outcome. The outcome cannot be deposited in the Protein Data Bank because no coordinates are determined. More background on ab initio approaches including others are summarized elsewhere (Perkins et al. 2008). Other approaches to modelling are termed ‘rigid body’. The Svergun group has developed algorithms for this (e.g. MASSA, ASSA, DIMFOM, GLOBSYMM, SASREF and BUNCH; Svergun & Koch 2003) and some other new methods (PRFIT and IMP) have been described in Krukenberg et al. (2008). Other recent reviews have addressed alterative methods to fit scattering data (e.g. Lipfert & Doniach 2007; Putnam et al. 2007).
Each application of constrained scattering modelling depends on the structure in question. Four different types can be distinguished (Perkins et al. 2005). The simplest scheme involves an homo-oligomeric protein in which the modelling adjusts the relative position of its subunits. The subunits are not connected by covalent links, and their position is constrained by symmetry (C3d in §5). Next is the case of two protein subunits tethered by a single covalent linker, in which only the orientation between the two subunits requires to be fitted. This is exemplified by the modelling of an antibody dimer that is tethered at a known location between the monomers (dIgA in §4). Monomeric antibody structures such as IgA represent a third group in which two identical subunits (the Fab fragments) are tethered to a third subunit (the Fc fragment) by two flexible peptide linkers that can be as long as 64 residues. The fourth group involves four or more subunits that are connected by peptide linkers. This is represented below by SC with five Ig domains (§4) and complement FH with 20 short complement regulator (SCR) domains (§5).
4. Antibody structures by constrained modelling
Constrained modelling is well suited for determining antibody solution structures and evaluating their flexibility. Monomeric antibodies are composed of two Fab and one Fc fragments joined by two linker peptides called the hinges (Janeway et al. 2005). The hinge conformation comprises the main variable in scattering modelling. The hinge conformation is central to antibody structure and function in all five human antibody classes (IgG, IgA, IgM, IgE and IgD), in which it is the most diverse structural element (figure 4). It can be very short (IgG, IgA) or very long with 64 residues (IgD), or the linker is replaced by an extra pair of domains (IgE, IgM). Very few crystal structures for intact antibodies are known, and only for the IgG class. These crystal structures are obtained using non-physiological buffers in high salt as precipitant, and report a single snapshot view of the two hinge conformations in a single symmetric or asymmetric structure that is frozen by the intermolecular contacts within the crystal packing. The advantage of constrained modelling is to provide solution structures that report on the averaged arrangement of the Fab and Fc fragments in solution, and comment on the degree of flexibility in the hinge region by surveying the best-fit structures.
SIgA is assembled from two monomers of IgA, a small joining (J) chain and a five-domain SC (Bonner et al. 2009a,b). The mucosal surfaces, including the gastrointestinal, respiratory, and urogenital tracts, have the largest surface area within the human body in contact with the external environment. Pathogenic micro-organisms, their potentially toxic products and, indeed, some components of ingested food and inhaled air are potential threats and are therefore antigenic at mucosal surfaces. SIgA is the principal antibody isotype present at external mucosal surfaces where it mediates the first line of immune defence by neutralizing and clearing the antigens. In serum, an increased IgA level is associated with IgA nephropathy, which is the most common form of chronic glomerulonephritis worldwide. IgA nephropathy is a renal disease involving the inflammation of the glomeruli in the kidneys, and is characterized by the mesangial deposition of polymeric IgA1 from serum. Polymeric IgA consists of two (or sometimes three or four) IgA monomers bound covalently through a J chain. Thus structural information on IgA assembly is essential for insight on the molecular mechanism of both SIgA and dimeric IgA (dIgA).
The SIgA structure was elucidated using a step-wise strategy starting from its subunits (figure 4). First, we determined structures for monomeric IgA1 and IgA2 (the two human subclasses of IgA; Boehm et al. 1999; Furtado et al. 2004), then this was followed by structures for the dIgA1 dimer and the five-domain structure of recombinant SC (Bonner et al. 2007, 2008). Finally, the structures of SIgA1 and SIgA2 were elucidated (Bonner et al. 2009a,b). These are each discussed in turn.
IgA1 and IgA2 represent how monomeric antibodies are modelled. Thus, IgA1 has an O-glycosylated 23-residue hinge region. The O-glycosylation reduced the flexibility in this hinge, and this was indicated by the appearance of two peaks and not one in the X-ray P(r) curve. The constrained modelling of IgA1 was based on 12 000 random hinge conformations generated from molecular dynamics, including hinges that were forced to be longer in order to populate more extended hinge conformations. The use of twofold symmetry about the Fc fragment simplified the modelling. The final outcome gave 104 extended T-shaped structures for IgA1, which resulted in good X-ray and neutron-scattering fits. IgA1 was seen to have a longer and less flexible antigenic reach compared with most other antibodies (figure 4; Boehm et al. 1999). The IgD structure is similar to that of IgA1 (Sun et al. 2005). The human IgA2(m1) allotype of IgA2 has a much shorter 10-residue hinge and a disulphide bridge joining the light chains of the two Fab fragments. The modelling of IgA2 was computationally complicated by the disulphide bridge between the two Fab fragments. This issue was easily resolved by generating 10 000 IgA2 models without this bridge, then fitting these to the scattering data. It turned out that about half the best-fit IgA2 structures had the correct Cys–Cys bridge spacing in the bridge. Here, good curve fits were obtained with compact T-shaped and Y-shaped IgA2 models with a much more limited antigenic reach than IgA1 (figure 4; Furtado et al. 2004).
The SC analysis represents the modelling of multi-domain proteins with four or more domains. This shows whether these form an extended or folded-back domain arrangement. SC has five heavily glycosylated Ig domains D1–D5. The analysis benefitted from the study of SC fragments as well as intact SC. By scattering, the overall lengths of recombinant SC and its two D1–D3 and D4–D5 fragments were all similar in length at 10–13 nm. This was unexpected and indicated that the domain arrangement had folded back. Constrained modelling using X-ray and neutron-scattering data confirmed this by showing that SC has a J-shaped structure shown in figure 4 and not the extended one shown in figure 3 (Bonner et al. 2007). The outcome was the same irrespective of whether the fragments were each modelled first, or all the five domains were modelled together, in order to create 5000 SC models. Inspection of the final J-shaped models explained the proteolysis site that yielded the D1–D3 and D4–D5 fragments. This site occurs on a long and exposed linker between the D3 and D4 domains. In addition, the models also showed that the D1 domain is exposed for the initial interaction with dIgA to form SIgA, and a Cys502 residue is exposed on the D5 domain to form the covalent link with dIgA. This clarified how SC might interact with dIgA to form SIgA.
The dIgA modelling optimized the position of two rigid subunits relative to each other. Thus, dimeric IgA1 was modelled using two IgA1 structures. Given the knowledge that the monomers were connected between the base of the Fc fragments, the two monomers were positioned end to end. A full set of x-, y- and z-axis rotations of one monomer about the other systematically tested all orientations between them. A small family of near-planar dimer structures resulted. The modelling was completed by optimizing the hinge conformation that positioned the Fab fragments relative to the Fc dimer (Bonner et al. 2008). Good quality X-ray and neutron curve fits were obtained (figure 5a–c). The consistency of both fits supported the outcome of the modelling. The dIgA structure showed that all four Fab fragments react with antigen independently of each other. It also explained the accessibility of the Fc fragments of dIgA for interactions with the FcαRI receptor on cell surfaces.
Figure 5.

X-ray and neutron-scattering curve fits for the best-fit model for dIgA1 and SIgA1. The data are from ID02 at ESRF and from LOQ at ISIS. (a–c) The best-fit dIgA1 model; (d–f) the best-fit SIgA1 model. The X-ray and neutron experimental I(Q) (open circles) and P(r) curves (black lines) are compared with the best-fit modelled I(Q) curves (red lines). (d) The experimental scattering curves of dIgA1 and SIgA1 are compared. The P(r) curves are shown as insets in the top-right corners, for which the horizontal axis of each corresponds to r (in nm). The ribbon trace of this best-fit model is shown in red. The oligosaccharide content of dIgA1 is shown in cyan, and the location of SC on the outermost convex edge of the Fc dimer in SIgA1 is shown in black and labelled D1–D5. Redrawn from Bonner et al. (2008, 2009a).
SIgA is formed by the association of dIgA with SC. A noticeable difference was reproducibly seen between the scattering curves from dIgA1 and SIgA1 in the middle Q range, while both curves were more similar at low Q (figure 5d). This showed that dIgA and SIgA were similarly elongated, but they differed in their cross-sectional structure measured across the diameter of the central Fc dimer. The modelling for SIgA combined the 5000 randomized SC structures with the best-fit dIgA structure from above. The 5000 SC models were tested in 10 different positions on dIgA. Analyses showed that extended SC structures positioned along the outermost length of the Fc dimer in planar dIgA structures best accounted for the SIgA1 structure (figure 5f; Bonner et al. 2009a). The same outcome was obtained for SIgA2, although the Fab fragments in SIgA2 became non-planar when compared with SIgA1 (Bonner et al. 2009b). The testing of many commonly assumed SIgA models in the literature gave worsened curve fits. The resulting SIgA structure (figure 5d–f) provided a convincing explanation of why the SIgA structure is resistant to proteolysis in the harsh environment of mucosal secretions. This resistance is attributed to both the location of SC and the glycosylation of SIgA1, which block access to many bacterial proteases. The SIgA structure also accounted for the binding of SIgA to the FcαRI receptor by showing that the structure possesses the required accessibility on the Fc fragments.
5. Complement structures by constrained modelling
Complement comprises a set of 30–40 proteins that forms the basis for innate immunity in the immune system (Walport 2001; Janeway et al. 2005). It is a major defence and clearance system in blood. It is activated by the presence of pathogens such as bacteria by one of three pathways, the classical, lectin or alternative pathways. All three pathways lead to the activation of C3, the central complement component, to C3b. C3b ultimately leads to the formation of a membrane attack complex that lyses bacteria. FH is a major essential regulator of C3b in the alternative pathway that prevents complement-mediated human host cell damage. Thus FH competes with the protease that binds to C3b to form the C3b convertase, accelerates the decay of the C3 convertase enzyme that produces C3b, and acts as a cofactor for the proteolytic cleavage of C3b to form inert products. In the course of its function, FH also interacts with other ligands such as C-reactive protein (CRP) and anionic heparin polysaccharides that constitute an analogue of heparan sulphate that coats human host cells. The FH structure is comprised of 20 SCR domains (figure 6), where the SCR is the most commonly occurring superfamily in complement. One SCR comprises about 61 amino acids. Crystal and NMR structures are known for small SCR fragments from several different complement proteins. These structures show that the inter-SCR orientations are highly variable and cannot be predicted. Thus, constrained modelling is ideal to assess overall solution structures for full-length FH, which is too flexible and glycosylated to crystallize intact. An understanding of how this large FH structure behaves and interacts with its ligands such as C3b (figure 7) is essential for a molecular understanding of complement regulation.
Figure 6.

X-ray scattering curve fits for the best-fit model for (a) FH, (b) CR1 and (c) CR2. The X-ray experimental I(Q) (circles) and P(r) curves (black lines) are compared with the best-fit modelled I(Q) curves (red lines). The P(r) curves are shown as insets in the top-right corners. The best-fit models are shown to the right as ribbon views. FH has 20 SCR domains, and eight of nine glycosylation sites are occupied (Okemefuna et al. in press b). CR1 has 30 SCR domains in which 14 glycosylation sites out of 25 putative sites are occupied, and there are four long homologous repeats (LHR) in the sequence (Furtado et al. 2008). CR2 has 15 SCR domains in which 11 glycosylation sites are occupied (Gilbert et al. 2006). The SCR domains containing oligosaccharide chains (in yellow) are labelled.
Figure 7.

The best-fit scattering models for FH, CR1 and CR2 are compared with the crystal structures of C3, C3b and C3d. Their SCR domains are numbered. The SCR-6/8 fragment is shown for comparison. Here and in figure 6, the FH, CR1 and CR2 conformations as shown do not predict any proximity relationships between neighbouring SCR domains, but indicate only the degree to which the SCR domains are partially folded back. The C3 and C3b structures are shown to the same scale. The green TED domain in C3b corresponds to the C3d fragment of C3. The vertical scale bars correspond to the lengths of FH, CR1 and CR2 determined from the P(r) curves.
The importance of FH is illustrated by its involvement in disease. Age-related macular degeneration (AMD) causes loss of central vision. It is the leading cause of blindness in the over-50s in the Western world. A key feature of AMD is the presence of drusen which are extracellular deposits between Bruch's membrane and the retinal pigment epithelium. The accumulation of drusen-associated molecules suggests an unregulated complement attack associated with AMD as well as the possible involvement of FH in the formation of large protein aggregates. A common Tyr402His polymorphism in FH is associated with many AMD cases (Hageman et al. 2005). Another FH disease is atypical haemolytic uraemic syndrome, which is a common cause of renal failure, and many FH mutations giving rise to this are clustered towards its C-terminus (Saunders et al. 2007).
The constrained modelling of intact FH showed that FH had a folded-back SCR domain structure (Aslam & Perkins 2001). This was the first modelling study of this type. The optimal procedure randomized the linkers in an almost fully extended conformation, such that the ends of the linkers (and the SCR domains) became randomly reorientated. However the resulting curve fit was only good in a Q range out to 0.4 nm−1. Much improved curve fits out to Q of 1.8–2.0 nm−1 were obtained using the same procedure for complement receptors type 1 (CR1) with 30 SCR domains and type 2 (CR2) with 15 SCR domains (figure 6b,c; Gilbert et al. 2006; Furtado et al. 2008). The reinvestigation of the FH curve fits showed that very good FH curve fits were obtained (figure 6a), once the occurrence of FH self-association had been identified and its effect minimized (Nan et al. 2008; Okemefuna et al. in press b). In fact, structural comparisons showed that FH is more compact in its domain arrangement than either CR1 or CR2 (figure 7). Constrained modelling became particularly interesting to identify the extent of conformational changes in FH that occur in buffers of different NaCl concentrations between 50 and 350 mM NaCl. These changes show that electrostatic interactions are important for the overall FH domain arrangement. These cause FH to become more compact in solution or extended, and may affect its interactions with its C3b ligand (figure 7).
The study of the three FH fragments SCR-1/5, SCR-6/8 and SCR-16/20 provided additional insights (Fernando et al. 2007; Okemefuna et al. 2008). All three SCR fragments exhibited similar partial folding-back to that of the starting FH structure (figure 7). The SCR-6/8 and SCR-16/20 fragments showed weak self-association to form dimers. Dimer formation limits the utility of constrained modelling, which assumes that the scattering curve corresponds to a monomer. Nonetheless, it was possible to deduce that the SCR-6 and SCR-8 domains move towards each other in SCR-6/8 to give a bent structure (figure 7). The P(r) curve turned out to be sensitive to the bending of this fragment as well as the presence of dimers. The final bent scattering model for SCR-6/8 showed good agreement with the crystal structure of SCR-6/8 that was published afterwards, even though the crystallographers unfortunately did not reference the prior scattering structure determination of SCR-6/8 (Prosser et al. 2007).
Properdin is another multi-domain complement protein that was analysed by a different variant of constrained modelling (Sun et al. 2004). Properdin occurs as dimers or trimers of a protomer containing seven thrombospondin repeat (TSR) domains, where TSR domains comprise the second most abundant protein superfamily in complement. A homologous crystal structure is available from human thrombospondin. The TSR domains are separated only by single residue linkers. Unlike the conformational randomization of the longer linkers found in FH, the constrained modelling of properdin could be accomplished based on single peptide bond rotations at each linker. Good curve fits for the dimer and trimer forms of properdin were obtained out to a Q value of 1.2 nm−1.
A third variant of constrained modelling is based on available crystal structures. In its simplest form, the identity of the crystal and solution structures is verified; thus, the crystal structure is validated in solution. Complications arise if protein multimerization occurs. The complement fragment C3d is a 35 kDa cleavage fragment of C3b that contains the active site region of C3b (figure 7). Originally, unbound C3d showed a pronounced concentration dependence in its X-ray RG values and P(r) curves with an apparent monomer–dimer dissociation constant KD of 23 ± 3 µM in 50 mM NaCl (Gilbert et al. 2005; Perkins et al. 2005). The C3d crystal structure gave good curve fits for C3d monomers at low concentrations (Gilbert et al. 2005). However, recent analytical ultracentrifugation (AUC) showed that the presumed monomer–dimer equilibrium in 50 mM NaCl is better described as a monomer–dimer–trimer equilibrium and that C3d is in fact monomeric in 137 mM NaCl (Li et al. 2008).
In conclusion, constrained scattering modelling analyses can be applied to the multi-domain complement proteins as well as to antibodies. The modelling strategy depends on the protein. The cautionary case of C3d shows the importance of understanding the experimental data before proceeding with modelling. The utility of modelling is summarized in figure 7, which provides a useful comparison of the sizes of FH, CR1 and CR2, and their relationships to their various C3b and C3d ligands.
6. Analytical ultracentrifugation and modelling
Solution scattering assumes that the protein is monodisperse. If a protein degrades into fragments, aggregates or self-associates to form multimers, scattering is not the easiest technique to observe these events, and AUC becomes useful (Cole et al. 2008). Traditionally, sample monodispersity is identified by sedimentation equilibrium experiments by checking the molecular weight. By the appropriate choice of rotor speeds at several concentrations, the sample reaches an equilibrium between its sedimentation rate to the bottom of the rotor cell, which is opposed by its diffusion rate. The fitting of the AUC data to an exponential function gives molecular weights Mr. During the past decade, AUC has refocused on sedimentation velocity experiments. These are much improved because of the development of interference optics to supplement absorbance optics, and by the use of software such as Sedfit, Sedphat, Sedanal and DCDT+ that fit sedimentation boundaries to give sedimentation coefficients s (Cole et al. 2008). The boundary fits using the Lamm equation in Sedfit result in size-distribution analyses c(s), which are most accurate and convenient for monodisperse systems and non-interacting systems (figure 8). These offer a clearer view of the sample composition than those offered by equilibrium fits. Monodispersity is revealed by the observation of a single c(s) peak. If multiple c(s) peaks are observed for the sample, this indicates degradation, oligomerization or aggregation. Note that the c(s) algorithm assumes that all the species within the sample have a similar shape (i.e. similar frictional ratios f/fo) and that any equilibria between the species giving rise to the multiple peaks are slow on the time scale of sedimentation (hours). If the equilibrium is rapid, reaction boundaries are observed instead. The c(s) analyses provide a unique means of identifying sample heterogeneity in the scattering experiment. They offer greater resolution and precision than size-exclusion chromatography, which monitors the effective hydrodynamic radius. In the above examples, Sedfit was used to analyse SC (degradation), FH (oligomerization), C3d and the SCR-6/8 and 16/20 fragments (self-association) prior to their constrained modelling (figure 8). For these studies, Sedfit was used to perform these analyses because their focus is on non-interacting systems. In practice, Sedanal can fit the sedimentation boundary shape for any reversible system to a reacting modelling including kinetics. Estimates of s, Mr and dissociation and rate constants are possible to extract with Sedanal.
Figure 8.

Sedimentation velocity size-distribution analyses c(s) of the SCR-1/5 and SCR-16/20 fragments of FH and native FH using Sedfit. The fitted boundary scans are shown in the left panels and the corresponding c(s) analyses are shown in the right panels. Only every tenth scan in the boundary fits is shown for reason of clarity. Only data using interference optics are shown. (a) SCR-1/5 shows a single c(s) peak (1) at 2.4 S to indicate that this is monomeric at 0.85 mg ml−1. (b) SCR-16/20 shows two peaks (1 and 2) at 2.9 and 3.9 S to show that this exists as monomer and dimer at 0.22 mg ml−1. (c) FH at 5.92 mg ml−1 shows multiple sedimentation behaviour in its boundary scans. (d) The corresponding boundary fits for FH at 0.17 mg ml−1 show that its sedimentation is more uniform. (e) The five c(s) size-distribution analyses for FH are shown at a concentration of 0.17 (bottom), 0.63, 1.53, 2.99 and 5.92 mg ml−1 (top). The FH monomer is denoted as 1, and the FH oligomers are labelled from 2 to 7 to correspond to putative dimer, trimer, tetramer and higher forms. Adapted from Okemefuna et al. (2008) and Nan et al. (2008).
The sedimentation velocity experiments provide s values. These monitor the degree of elongation of the macromolecule according to the Svedberg equation, where s is proportional to Mr/f and f is the frictional coefficient. In practice, s is often expressed as s020,w, which is an extrapolation to zero concentration, the temperature is corrected to 20°C and the buffer density and viscosity are corrected to those of water. The s020,w value is analogous to the RG value from scattering, but is an independent structural parameter. Constrained modelling can use s020,w values. Because this is a single-parameter measurement, the s020,w values do not lead to three-dimensional structural models. The advantage is that the calculation of the s020,w values will corroborate the outcome of the scattering modelling. The direct conversion of the atomic coordinate model into small spheres is one approach. The sphere model (also known as a ‘bead’ model) has to include a hydration shell of spheres, so this is the same hydrated model as that used for X-ray scattering fits (Ashton et al. 1997). The models are submitted to Hydro software to calculate the s020,w value (Garcia de la Torre et al. 1994). Substantial computing power is required. Another approach is to input the atomic coordinates directly into Hydropro (Garcia de la Torre et al. 2000). Here, Hydropro represents the protein as a hollow shell of equally sized spheres that represents the macromolecular surface. Hydration in Hydropro is considered empirically by reassigning the effective atomic sphere radius at the protein surface as 0.31 nm. A third approach is to use simple shape models (e.g. ellipsoids or large spheres of different sizes) for s020,w modelling. Because these models cannot follow the details of a molecular structure, they are unconvincing and should not be used.
The utility of s020,w modelling is the validation of scattering modelling. To be acceptable, the agreement between the experimental and modelled s020,w value should be within 0.3 S. The pair-wise comparisons in table 1 show that this is generally the case. Larger discrepancies can be difficult to resolve because they can arise from the experimental data, the modelling or both. Fortunately, this is the exception rather than the rule. If the calculated value is larger than the experimental value, this may mean that the macromolecule is highly hydrated. The analysis of 22 protein structures from constrained scattering modelling showed that both programs gave similar agreements with a mean deviation of ±0.21 S (figure 9). This establishes the effectiveness of both Hydro and Hydropro for sedimentation coefficient modelling.
Table 1.
Comparison of experimental and modelled sedimentation coefficients. (Upper: antibody-related data. Lower: complement-related data. The Hydro values are calculated from the hydrated X-ray sphere models. The Hydropro values are calculated from the full coordinate models used to generate the sphere models. n.a., not available.)
| protein | experimental so20,w value (S) | Hydro so20,w (S) | Hydropro so20,w (S) | reference |
|---|---|---|---|---|
| human serum albumin | 4.16 ± 0.10 | n.a. | 4.17 ± 0.05 | Almogren et al. (2006) |
| CR2-Ig antibody chimaera | 4.49 ± 0.11 | 4.99 ± 0.06 | 4.66 ± 0.06 | Almogren et al. (2006) |
| Crry-Ig antibody chimaera | 5.4 ± 0.1 | 5.64 ± 0.26 | 5.29 ± 0.23 | Almogren et al. (2006) |
| IgA1 | 6.15 ± 0.10 | 6.82 ± 0.07 | 6.23 ± 0.05 | Almogren et al. (2006) |
| IgA2m(1) | 6.42 ± 0.15 | 7.25 ± 0.13 | 6.76 ± 0.12 | Almogren et al. (2006) |
| IgD | 6.32 ± 0.15 | n.a. | 6.65 ± 0.14 | Almogren et al. (2006) |
| IgA1-human serum albumin adduct | 6.40 ± 0.02 | n.a. | 7.54 ± 0.09 | Almogren et al. (2006) |
| SC | 4.0 | 4.06 | n.a. | Bonner et al. (2007) |
| dimeric IgA1 | 9.70 | n.a. | 8.94 | Bonner et al. (2008) |
| SIgA1 | 10.8 | n.a. | 11.4 | Bonner et al. (2009b) |
| SIgA2 | 12.1 | n.a. | 11.94 | Bonner et al. (2009a) |
| FH SCR-1/20 | 5.56 ± 0.05 | n.a. | 5.01 | Okemefuna et al. (in press b) |
| FH SCR-1/5 | 2.37 ± 0.03 | 2.33 | 2.22 | Okemefuna et al. (2008) |
| FH SCR-6/8 | 1.93 ± 0.07 | 1.81 | 1.72 | Fernando et al. (2007) |
| FH SCR-16/20 | 2.87 ± 0.20 | 3.20 | 3.06 | Okemefuna et al. (2008) |
| CR1 SCR-1/30 | 5.77 ± 0.07 | 5.78 | 5.56 | Furtado et al. (2008) |
| C3d | 3.0 ± 0.3 | 3.1 | 2.9 | Li et al. (2008) |
| Crry SCR-1/5 | 2.4 ± 0.1 | 2.51 ± 0.03 | n.a. | Aslam et al. (2003) |
| CR2 SCR-1/15 | 4.03 ± 0.13 | n.a. | 3.94 | Li et al. (2008) |
| CR2 SCR-1/15-C3d complex | 4.52 ± 0.11 | n.a. | 4.57 ± 0.04 | Li et al. (2008) |
| CR2 SCR-1/2 | 1.40 ± 0.03 | 1.71 | n.a. | Gilbert et al. (2006) |
| CR2 SCR-1/2-C3d complex | 3.45 ± 0.01 | 3.96 | n.a. | Gilbert et al. (2006) |
Figure 9.

Comparisons of the modelled and experimental s020,w values for 22 proteins using Hydro (filled circles) and Hydropro (open triangles) programs. The data are listed in table 1. The regression coefficients for both fitted lines are 0.99. The mean difference between the modelled and experimental values is 0.21 S for both programs.
7. Modelling of protein–protein complexes
The utility of constrained modelling is enhanced by its extension to protein–protein complexes. Scattering requires strong complex formation. This is important for reason of the requirement of monodispersity in scattering experiments, meaning that no unbound protein should be present. Antibodies and complement proteins with molecular weights ranging between 150 and 500 kDa are generally studied at 1–5 mg ml−1 concentrations, thus their molarities range between 2 and 30 µM. The corresponding molarities for complement proteins of sizes 20–40 kDa range between 30 and 240 µM. Accordingly, nanomolar dissociation constants KD are required for tight complex formation. This condition was readily met in the assembly of SIgA from its components (above). The IgA dimer is covalently formed and readily purified; likewise SIgA is a covalent complex.
The complement complexes are often weakly formed. Complement functions through a coordinated series of weak binding events that are amplified through local concentration events at cell surfaces. This enables complement to be targeted appropriately. The complement proteins often interact through ionic interactions, thus complex formation is promoted in low-salt conditions. Hence, a common experimental strategy is to decrease the ionic strength of the buffer from physiological (137 mM NaCl) to 50 mM. Unfortunately, low-salt conditions can lead to artefacts. Thus C3d multimerizes in 50 mM NaCl, but does not do so in 137 mM NaCl (Li et al. 2008).
CR2 is a membrane glycoprotein with 15 SCR domains found at cell surfaces of mature B lymphocytes and follicular dendritic cells. CR2 contains a C3d binding site at SCR-1/2 (figure 7). Crystal structures for unbound SCR-1/2 and its complex with C3d have proved to be controversial (Szakonyi et al. 2001; Prota et al. 2002). In both, the two SCR domains formed a folded-back V-shaped arrangement of SCR domains with an angle of 37–40° between them, and only SCR-2 made contact with C3d. Functional studies show that this SCR domain arrangement does not explain its solution properties, because both SCR-1 and SCR-2 are involved in contacts with C3d. Constrained X-ray scattering in 50 mM NaCl was applied to resolve the discrepancy (Gilbert et al. 2005). The eight-residue linker peptide between SCR-1 and SCR-2 was structurally randomized starting from the crystal structure. Fitting showed that the most favoured SCR arrangement in solution corresponded to an opened-up V-shaped structure with an angle of 69° between the domains (figure 10). For the SCR-1/2 complex with C3d, in which SCR-2 was assumed (i.e. constrained) to interact with C3d according to the crystal structure, the modelling showed that SCR-1 formed an open V-shaped structure with an angle of 39° between the SCR domains, and SCR-1 was located at the surface of C3d (figure 10). This result was supported by accompanying mutagenesis experiments with CR2 SCR-1/2, which showed that SCR-1 interacted with C3d (Hannan et al. 2005). This analysis shows how crystal structures of complexes can be tested by the use of constrained scattering modelling.
Figure 10.

Constrained modelling fits of the CR2 SCR-1/2 complex with C3d. (a) The X-ray scattering curve of CR2 SCR-1/2 is compared with the best-fit model curve (continuous white line). (b) A best-fit CR2 SCR-1/2 model with an open V-shaped domain structure. (c) The crystal structure of CR2 SCR-1/2 shows a closed V-shaped structure, in which SCR-1 is shown in the same view as in (b). (d) X-ray scattering curve of the CR2-C3d complex is compared with the best-fit model curve (continuous white line). (e) One of the best-fit models for the complex showing that both SCR-1 and SCR-2 are in contact with the surface of C3d. (f) The crystal structure of the complex shows that only SCR-2 is in contact with the surface of C3d. Both C3d and SCR-2 are viewed in the same orientation in (e,f). Adapted from Perkins et al. (2008).
Scattering and AUC were used to study the complex between full-length CR2 and C3d in both 50 and 137 mM NaCl (Li et al. 2008). Even though unbound CR2 gave good scattering curves in 137 mM NaCl, CR2 was sufficiently aggregated in 50 mM NaCl to preclude scattering experiments of its C3d complex. Complex formation with C3d in 137 mM NaCl was not detectable by scattering. AUC was not affected by these issues. Thus s020,w modelling (table 1) showed that the CR2-C3d complex in 50 mM NaCl showed no detectable conformational change in the CR2 domain arrangement. The lack of observable complexes in 137 mM NaCl suggests that in vivo CR2 and C3d interact through a local concentration mechanism at surfaces. By this, the weak CR2–C3d interactions are amplified by a sufficient amount of CR2 molecules present on the B-cell surface and C3d-bound ligands on the antigen(s)-coated pathogenic surface. This appears to be a good way for B-cells to respond specifically only to C3d-coated pathogens, i.e. CR2 will not bind to unbound free C3d in blood.
Scattering and AUC were likewise used to study the interaction between the C-terminal SCR-19/20 domains of FH and C3d (figure 7). From AUC, the size-distribution c(s) analyses of SCR-16/20 or FH with C3d in 50 and 137 mM NaCl buffer revealed a number of species, showing that multimeric complexes had formed at physiologically relevant concentrations (Okemefuna et al. in press a). X-ray scattering showed that the maximum dimension of the C3d complexes with SCR-16/20 at 29 nm was not much longer than that of the unbound SCR-16/20 dimer. Modelling suggested that the AUC and scattering data were most simply explained in terms of associating dimers of each of SCR-16/20 and C3d. In cases such as these, when a simple 1 : 1 binding stoichiometry is not observed, and the overall binding affinity is weak, constrained scattering modelling has limited utility. Nonetheless, the observation of multimers provided new mechanistic insight into FH regulation during excessive complement activation, in particular when host cell surfaces are decorated by large amounts of C3d, which in turn may bind more FH to protect the host cells.
CRP is an acute phase protein of the pentraxin family that binds ligands in a Ca2+-dependent manner and activates complement. It is formed from five protomers arranged in a planar ring (figure 11). The combination of (i) AUC to identify pentamers and decamers of CRP and a third denatured form and (ii) X-ray scattering to quantify the proportion of pentamer and decamer provided key insights into the solution properties of CRP and the most appropriate buffers to use for working with CRP. Studies of CRP in the acute phase response are sometimes controversial because of functional results apparently obtained with denatured or non-physiological forms of CRP. Here, AUC showed that CRP in the presence of Ca2+ exists as a rapid pentamer–decamer equilibrium, and the pentamer is very stable (Okemefuna et al. in preparation). The decamer existed as a reaction boundary. In the absence of Ca2+, AUC showed that CRP dissociates into non-physiological monomers, thus emphasizing the importance of Ca2+ for CRP functional studies and clarifying the outcome of some of the earlier functional studies with CRP. Given that over 2 mM Ca2+ is present in blood (Hurwitz 1996), CRP pentamers will be the stable form in vivo. X-ray scattering showed a clear concentration dependence. Two crystal structures for pentameric and decameric CRP were used to generate good scattering curve fits for CRP over a wide concentration range, confirming the amounts of pentamers and decamers present, and yielding a KD close to 20 µM for this equilibrium (figure 11).
Figure 11.

X-ray scattering analyses of the pentamer and decamer of CRP in the presence of Ca2+. (a) X-ray scattering fit for a mixture of 54 per cent pentamer and 46 per cent decamer. The CRP concentration is 1.3 mg ml−1. (b) X-ray scattering curves calculated from the pentamer and decamer crystal structures. These were used to fit the curve in (a). The pronounced minimum in the decamer curve occurs at Q of 0.87 nm−1. (c) Crystal structures of the pentamer (face view) and decamer (side view), where the decamer is formed through contacts between the α-helical A faces. In the pentamer, bound Ca2+ is shown as two grey spheres in each protomer (Okemefuna et al. in preparation).
The above four examples show that, while strong complexes are amenable to constrained scattering modelling, weakly formed complexes require the use of both scattering and AUC to unravel these. The extent to which weak complexes can be analysed by scattering modelling depends on the available constraints. AUC methods become essential to identify the species that exist. For many studies of complexes, the choice of the buffer is crucial for both structural and functional studies.
8. Conclusions and future considerations
Solution scattering is applicable to a broad range of structural and compositional studies of macromolecules. Its utility is significantly enhanced by the use of high-flux beam sources, which provides abundant scattering data with much improved signal–noise ratios, and AUC experiments that are carried out concurrently. While antibody and complement proteins have been discussed here, the methods are applicable to other proteins, nucleic acids and even to heparin oligosaccharides (Khan et al. 2008). The utility of scattering is also much improved by constrained modelling. This benefits from the vast number of accessible high-resolution structures in the Protein Data Bank to initiate the data fits. The key procedure is the evaluation of a full range of stereochemically correct conformations for curve fitting that addresses the biological questions of interest, from which a best-fit structure can be determined.
Current state-of-the-art scattering experiments provide significant new insights into structure–function relationships, which are not available by other methods. Examples have been described when no crystal structures are available, or are apparently not achievable, and even after a crystal structure is determined. For intact antibodies, scattering provides much needed insights into their hinge conformations, and the assembly of large antibody macromolecules that have not been crystallized to date. For many complement proteins, the first molecular structures at medium structural resolutions have been determined. Complexes formed between the complement proteins and their macromolecular ligands have been studied, although their weak affinities can complicate analyses, and other methods such as AUC are needed. To date (April 2009), 27 structures have been deposited in the Protein Data Bank as a permanent archive of constrained scattering modelling (http://www.rcsb.org; perform an ‘Author (Structure + Citation)’ search on the home page using ‘Perkins, SJ’ as the search term), of which 11 are antibody related and 14 are complement based.
Acknowledgements
We thank the Wellcome Trust and BBSRC for support. We are particularly grateful to our IgA colleagues Dr Blaise Corthesy, Dr Jennifer M. Woof and Prof. Michael A. Kerr, and our factor H colleagues Dr Imre Lengyel, Dr Robert B. Sim and Prof. David Gordon for their support. We also thank Jayesh Gor at UCL, Dr Theyencheri Narayanan, Dr Stephanie Finet, Dr Pierre Panine and Dr Anuj Shukla at ESRF and Dr Richard K. Heenan and Dr Stephen M. King at ISIS for instrumental support, without which these projects would not have been completed.
Footnotes
One contribution of 13 to a Theme Supplement ‘Biological physics at large facilities’.
References
- Almogren A., Furtado P. B., Sun Z., Perkins S. J., Kerr M. A. 2006. Biochemical and structural properties of the complex between human immunoglobulin A1 and human serum albumin by X-ray and neutron scattering and analytical ultracentrifugation. J. Mol. Biol. 356, 413–431 (doi:10.1016/j.jmb.2005.11.060) [DOI] [PubMed] [Google Scholar]
- Ashton A. W., Boehm M. K., Gallimore J. R., Pepys M. B., Perkins S. J. 1997. Pentameric and decameric structures in solution of the serum amyloid P component by X-ray and neutron scattering and molecular modelling analyses. J. Mol. Biol. 272, 408–422 (doi:10.1006/jmbi.1997.1271) [DOI] [PubMed] [Google Scholar]
- Aslam M., Perkins S. J. 2001. Folded-back solution structure of monomeric Factor H of human complement by synchrotron X-ray and neutron scattering, analytical ultracentrifugation and constrained molecular modelling. J. Mol. Biol. 309, 1117–1138 (doi:10.1006/jmbi.2001.4720) [DOI] [PubMed] [Google Scholar]
- Aslam M., Guthridge J. M., Hack B. K., Quigg R. J., Holers V. M., Perkins S. J. 2003. The extended multidomain solution structures of the complement protein Crry and its chimaeric conjugate Crry-Ig by scattering, analytical ultracentrifugation and constrained modelling: implications for function and therapy. J. Mol. Biol. 329, 525–550 (doi:10.1016/S0022-2836(03)00492-3) [DOI] [PubMed] [Google Scholar]
- Boehm M. K., Woof J. M., Kerr M. A., Perkins S. J. 1999. The Fab and Fc fragments of IgA1 exhibit a different arrangement from that in IgG: a study by X-ray and neutron solution scattering and homology modelling. J. Mol. Biol. 286, 1421–1447 (doi:10.1006/jmbi.1998.2556) [DOI] [PubMed] [Google Scholar]
- Bonner A., Perrier C., Corthésy B., Perkins S. J. 2007. Solution structure of human secretory component and implications for biological function. J. Biol. Chem. 282, 16 969–16 980 (doi:10.1074/jbc.M701281200) [DOI] [PubMed] [Google Scholar]
- Bonner A., Furtado P. B., Almogren A., Kerr M. A., Perkins S. J. 2008. Implications of the near-planar solution structure of human myeloma dimeric IgA1 for mucosal immunity and IgA nephropathy. J. Immunol. 180, 1008–1018 [DOI] [PubMed] [Google Scholar]
- Bonner A., Almogren A., Furtado P. B., Kerr M. A., Perkins S. J. 2009a. Location of secretory component on the Fc edge of dimeric IgA1 reveals insight into the role of secretory IgA1 in mucosal immunity. Mucosal Immunol. 2, 74–84 (doi:10.1038/mi.2008.68) [DOI] [PubMed] [Google Scholar]
- Bonner A., Almogren A., Furtado P. B., Kerr M. A., Perkins S. J. 2009b. The non-planar secretory IgA2 and near-planar secretory IgA1 solution structures rationalise their different mucosal immune responses. J. Biol. Chem. 284, 5077–5087 (doi:10.1074/jbc.M807529200) [DOI] [PMC free article] [PubMed] [Google Scholar]
- Cole J. L., Lary J. W., Moody T. P., Laue T. M. 2008. Analytical ultracentrifugation: sedimentation velocity and sedimentation equilibrium. Methods Cell Biol. 84, 143–179 (doi:10.1016/S0091-679X(07)84006-4) [DOI] [PMC free article] [PubMed] [Google Scholar]
- Fernando A. N., Furtado P. B., Clark S. J., Gilbert H. E., Day A. J., Sim R. B., Perkins S. J. 2007. Associative and structural properties of the region of complement Factor H encompassing the Tyr402His disease-related polymorphism and its interactions with heparin. J. Mol. Biol. 368, 564–581 (doi:10.1016/j.jmb.2007.02.038) [DOI] [PubMed] [Google Scholar]
- Furtado P. B., Whitty P. W., Robertson A., Eaton J. T., Almogren A., Kerr M. A., Woof J. M., Perkins S. J. 2004. Solution structure determination of human IgA2 by X-ray and neutron scattering and analytical ultracentrifugation and constrained modelling: a comparison with human IgA1. J. Mol. Biol. 338, 921–941 (doi:10.1016/j.jmb.2004.03.007) [DOI] [PubMed] [Google Scholar]
- Furtado P. B., Huang C. Y., Ihyembe D., Hammond R. A., Marsh H. C., Perkins S. J. 2008. The partly-folded back solution structure arrangement of the 30 SCR domains in human complement receptor type 1 (CR1) permits access to its C3b and C4b ligands. J. Mol. Biol. 375, 102–118 (doi:10.1016/j.jmb.2007.09.085) [DOI] [PubMed] [Google Scholar]
- Garcia de la Torre J., Navarro S., Martinez M. C. L., Diaz F. G., Cascales J. L. 1994. HYDRO: a computer program for the prediction of hydrodynamic properties of macromolecules. Biophys. J. 67, 530–531 (doi:10.1016/S0006-3495(94)80512-0) [DOI] [PMC free article] [PubMed] [Google Scholar]
- Garcia de la Torre J., Huertas M. L., Carrasco B. 2000. Calculation of hydrodynamic properties of globular proteins from their atomic-level structure. Biophys. J. 78, 719–730 (doi:org/10.1016/S0006-3495(00)76630-6) [DOI] [PMC free article] [PubMed] [Google Scholar]
- Gilbert H. E., Eaton J. T., Hannan J. P., Holers V. M., Perkins S. J. 2005. Solution structure of the complex between CR2 SCR 1-2 and C3d of human complement: an X-ray scattering and sedimentation modelling study. J. Mol. Biol. 346, 859–873 (doi:10.1016/j.jmb.2004.12.006) [DOI] [PubMed] [Google Scholar]
- Gilbert H. E., Asokan R., Holers V. M., Perkins S. J. 2006. The flexible 15 SCR extracellular domains of human complement receptor type 2 can mediate multiple ligand and antigen interactions. J. Mol. Biol. 362, 1132–1147 (doi:10.1016/j.jmb.2006.08.012) [DOI] [PubMed] [Google Scholar]
- Glatter O., Kratky O. (eds) 1982. Small angle X-ray scattering. New York, NY: Academic Press [Google Scholar]
- Hageman G. S., et al. 2005. A common haplotype in the complement regulatory gene factor H (HF1/CFH) predisposes individuals to age-related macular degeneration. Proc. Natl Acad. Sci. USA 102, 7227–7232 (doi:10.1073/pnas.0501536102) [DOI] [PMC free article] [PubMed] [Google Scholar]
- Hannan J. P., Young K. A., Guthridge J. M., Asokan R., Szakonyi G., Chen X. S., Holers V. M. 2005. Mutational analysis of the Complement Receptor Type 2 (CR2/CD21)–C3d interaction reveals a putative charged SCR1 binding site for C3d. J. Mol. Biol. 346, 845–858 (doi:10.1016/j.jmb.2004.12.007) [DOI] [PubMed] [Google Scholar]
- Hurwitz S. 1996. Homeostatic control of plasma calcium concentration. Crit. Rev. Biochem. Mol. Biol. 31, 41–100 (doi:10.3109/10409239609110575) [DOI] [PubMed] [Google Scholar]
- Ibel K., Stuhrmann H. B. 1975. Comparison of neutron and X-ray scattering of dilute myoglobin solutions. J. Mol. Biol. 93, 255–265 (doi:10.1016/0022-2836(75)90131-X) [DOI] [PubMed] [Google Scholar]
- Janeway C. A., Travers P., Walport M., Schlomchik M. J. 2005. Immunobiology: the immune system in health and disease. New York, NY: Garland Science Publishing [Google Scholar]
- Khan K., Gor J., Mulloy B., Perkins S. J. 2008. Solution structure of heparin and its complexes with the factor H SCR-6/8 domains and factor H: implications for disease. Mol. Immunol. 45, 4126 (doi:10.1016/j.molimm.2008.08.092) [Google Scholar]
- Krukenberg K. A., Förster F., Rice L. M., Sali A., Agard D. A. 2008. Multiple conformations of E. coli Hsp90 in solution: insights into the conformational dynamics of Hsp90. Structure 16, 755–765 (doi:10.1016/j.str.2008.01.021) [DOI] [PMC free article] [PubMed] [Google Scholar]
- Li K., Okemefuna A. I., Gor J., Hannan J. P., Asokan R., Holers V. M., Perkins S. J. 2008. Solution structure of the complex formed between human complement C3d and full length complement receptor Type 2. J. Mol. Biol. 384, 137–150 (doi:10.1016/j.jmb.2008.08.084) [DOI] [PubMed] [Google Scholar]
- Lipfert J., Doniach S. 2007. Small-angle X-ray scattering from RNA, proteins, and protein complexes. Annu. Rev. Biophys. Biomol. Struct. 36, 307–327 (doi:10.1146/annurev.biophys.36.040306.132655) [DOI] [PubMed] [Google Scholar]
- Nan R., Gor J., Perkins S. J. 2008. Implications of the progressive self-association of wild-type human Factor H for complement regulation and disease. J. Mol. Biol. 375, 891–900 (doi:10.1016/j.jmb.2007.11.015) [DOI] [PubMed] [Google Scholar]
- Narayanan T., Diat O., Bosecke P. 2001. SAXS and USAXS on the high brilliance beamline at the ESRF. Nucl. Instrum. Methods Phys. Res. A 467–468, 1005–1009 (doi:10.1016/S0168-9002(01)00553-8) [Google Scholar]
- Okemefuna A. I., Gilbert H. E., Griggs K. M., Ormsby R. J., Gordon D. L., Perkins S. J. 2008. The regulatory SCR-1/5 and cell-surface-binding SCR-16/20 fragments of Factor H reveal partially folded-back solution structures and different self-associative properties. J. Mol. Biol. 375, 80–101 (doi:10.1016/j.jmb.2007.09.026) [DOI] [PubMed] [Google Scholar]
- Okemefuna A. I., Li K., Nan R., Ormsby R. J., Sadlon T., Gordon D. L., Perkins S. J. In press a Multimeric interactions between complement Factor H and its C3d ligand provide new insight on complement regulation. J. Mol. Biol. (doi:10.1016/j.jmb.2009.06.013) [DOI] [PubMed] [Google Scholar]
- Okemefuna A. I., Nan R., Gor J., Perkins S. J. In press b Electrostatic interactions contribute to the folded-back conformation of wild-type human Factor H. J. Mol. Biol. (doi:10.1016/j.jmb.2009.06.010) [DOI] [PubMed] [Google Scholar]
- Okemefuna A. I., Stach L., Rana S., Ziai Buetas A., Gor J., Mangione P., Pepys M. B., Perkins S. J. In preparation C-reactive protein exists in an NaCl-concentration-dependent pentamer-decamer equilibrium in physiological buffer containing calcium. [DOI] [PMC free article] [PubMed] [Google Scholar]
- Perkins S. J. 2001. X-ray and neutron scattering analyses of hydration shells: a molecular interpretation based on sequence predictions and modelling fits. Biophys. Chem. 93, 129–139 (doi:10.1016/S0301-4622(01)00216-2) [DOI] [PubMed] [Google Scholar]
- Perkins S. J., Bonner A. 2008. Structure determinations of human and chimaeric antibodies by solution scattering and constrained molecular modelling. Biochem. Soc. Trans. 36, 37–42 (doi:10.1042/BST0360037) [DOI] [PubMed] [Google Scholar]
- Perkins S. J., Furtado P. B. 2005. Complement and immunoglobulin protein structures by X-ray and neutron solution scattering and analytical ultracentrifugation. In Structural biology of the complement system (eds Morikis D., Lambris J. D.), pp. 293–315 Boca Raton, FL: Taylor and Francis [Google Scholar]
- Perkins S. J., Nealis A. S., Sutton B. J., Feinstein A. 1991. The solution structure of human and mouse immunoglobulin IgM by synchrotron X-ray scattering and molecular graphics modelling: a possible mechanism for complement activation. J. Mol. Biol. 221, 1345–1366 (doi:10.1016/0022-2836(91)90937-2) [DOI] [PubMed] [Google Scholar]
- Perkins S. J., Ashton A. W., Boehm M. K., Chamberlain D. 1998. Molecular structures from low angle X-ray and neutron scattering studies. Int. J. Biol. Macromol. 22, 1–16 (doi:10.1016/S0141-8130(97)00088-3) [DOI] [PubMed] [Google Scholar]
- Perkins S. J., Gilbert H. E., Lee Y. C., Sun Z., Furtado P. B. 2005. Relating small angle scattering and analytical ultracentrifugation in multidomain proteins. In Modern analytical ultracentrifugation: techniques and methods (eds Scott D. J., Harding S. E., Rowe A. J.), pp. 291–319 London, UK: Royal Society of Chemistry [Google Scholar]
- Perkins S. J., Okemefuna A. I., Fernando A. N., Bonner A., Gilbert H. E., Furtado P. B. 2008. X-ray and neutron scattering data and their constrained molecular modelling. Methods Cell Biol. 84, 375–423 (doi:10.1016/S0091-679X(07)84013-1) [DOI] [PubMed] [Google Scholar]
- Prosser B. E., et al. 2007. Structural basis for complement factor H-linked age-related macular degeneration. J. Exp. Med. 204, 2277–2283 (doi:10.1084/jem.20071069) [DOI] [PMC free article] [PubMed] [Google Scholar]
- Prota A. E., Sage D. R., Stehle T., Fingeroth J. D. 2002. The crystal structure of human CD21: implications for Epstein–Barr virus and C3d binding. Proc. Natl Acad. Sci. USA 99, 10 641–10 646 (doi:10.1073/pnas.162360499) [DOI] [PMC free article] [PubMed] [Google Scholar]
- Putnam C. D., Hammel M., Hura G. L., Tainer J. A. 2007. X-ray solution scattering (SAXS) combined with crystallography and computation: defining accurate macromolecular structures, conformations and assemblies in solution. Quart. Rev. Biophys. 40, 191–285 (doi:10.1017/S0033583507004635) [DOI] [PubMed] [Google Scholar]
- Saunders R. E., et al. 2007. The interactive Factor H–atypical haemolytic uraemic syndrome mutation database and website: update and integration of membrane cofactor protein and factor I mutations with structural models. Hum. Mutat. 28, 222–234 (doi:10.1002/humu.20435) [DOI] [PubMed] [Google Scholar]
- Sun Z., Reid K. B. M., Perkins S. J. 2004. The multidomain solution structures of the complement protein properdin dimer and trimer by X-ray scattering, analytical ultracentrifugation and constrained modeling. J. Mol. Biol. 343, 1327–1343 (doi:10.1016/j.jmb.2004.09.001) [DOI] [PubMed] [Google Scholar]
- Sun Z., Almogren A., Furtado P. B., Chowdhury B., Kerr M. A., Perkins S. J. 2005. Semi-extended solution structure of human myeloma immunoglobulin D determined by constrained X-ray scattering. J. Mol. Biol. 353, 155–173 (doi:10.1016/j.jmb.2005.07.072) [DOI] [PubMed] [Google Scholar]
- Svergun D. I., Koch M. H. J. 2003. Small-angle scattering studies of biological macromolecules in solution. Rep. Prog. Phys. 66, 1735–1782 (doi:10.1088/0034-4885/66/10/R05) [Google Scholar]
- Szakonyi G., Guthridge J. M., Li D., Young K. A., Holers V. M., Chen X. S. 2001. Structure of complement receptor 2 in complex with its C3d ligand. Science 292, 1725–1728 (doi:10.1126/science.1059118) [DOI] [PubMed] [Google Scholar]
- Walport M. J. 2001. Complement. N. Engl. J. Med. 344, 1058–1066, 1140–1144 (doi:10.1056/NEJM200104053441406) [DOI] [PubMed] [Google Scholar]