

Abstract
Small-angle X-ray scattering (SAXS) and elastic and quasi-elastic neutron scattering techniques were used to investigate the high-pressure-induced changes on interactions, the low-resolution structure and the dynamics of lysozyme in solution. SAXS data, analysed using a global-fit procedure based on a new approach for hydrated protein form factor description, indicate that lysozyme completely maintains its globular structure up to 1500 bar, but significant modifications in the protein–protein interaction potential occur at approximately 600–1000 bar. Moreover, the mass density of the protein hydration water shows a clear discontinuity within this pressure range. Neutron scattering experiments indicate that the global and the local lysozyme dynamics change at a similar threshold pressure. A clear evolution of the internal protein dynamics from diffusing to more localized motions has also been probed. Protein structure and dynamics results have then been discussed in the context of protein–water interface and hydration water dynamics. According to SAXS results, the new configuration of water in the first hydration layer induced by pressure is suggested to be at the origin of the observed local mobility changes.
Keywords: lysozyme, structure, dynamics, small-angle X-ray scattering, quasi-elastic neutron scattering, high pressure
1. Introduction
The first study of the effects of pressure on protein structure and function dates back to 1914, when Bridgman observed that a pressure of several kilobars gave egg white an appearance similar but not identical to that of a cooked egg (Bridgman 1914). Since then, a number of studies have been performed to investigate in detail the pressure–temperature phase diagram of proteins using UV-difference spectroscopy, fluorescence, vibrational spectroscopy (Heremans 1997; Kunugi & Tanaka 2002; Smeller 2002) and, more recently, small-angle X-ray scattering (SAXS) (Spinozzi et al. 2007) and NMR (Refaee et al. 2003).
Pressure is a fundamental thermodynamic variable for defining protein conformational states (Kauzmann 1987). A protein in solution generally equilibrates among multiple conformational substates, differing in partial molar volume. Pressure affects conformational equilibria through volume differences, which perturb conformational equilibria through, respectively, heat capacity (total energy and volume changes) or chemical potential differences (Weber 1992). This is why the use of pressure perturbation to study the conformational properties of proteins, and namely the structure–function relationship, has gradually increased during past decades using site-specific probes such as Trp fluorescence (Weber & Drickamer 1983), NMR spectroscopy (Fuentes & Wand 1998) and FTIR spectroscopy (Frauenfelder et al. 1990; Striolo et al. 2003). Recently, the fine structural changes of lysozyme under pressure have been monitored with NMR (Refaee et al. 2003). α-Helical and β-sheet domains were found to be only slightly affected by pressure, with volume changes of less than 1 per cent for pressures up to 2000 bar.
High-pressure effects are of interest because they also help us to understand how macromolecules behave under normal conditions because protein compressibility is directly related to structural and conformational fluctuations of proteins at normal atmospheric pressure (Cooper 1976). Pressure is also of practical interest because it is one of the basic variables to account for when one faces the subject of life in extreme environments, as for instance in exobiology or in biology of deep-sea organisms. Owing to the present view of proteins as dynamic objects, which encompass internal motions to fulfil specific functions, it became clear that it is crucial to study the effect of pressure on protein internal dynamics. In fact, proteins in solution are marginally stable under conditions of high temperature and pressure (Gross & Jaenicke 1994), while their catalytic efficiency may be reduced even at non-denaturing pressures (Gross et al. 1993). A recent study (Striolo et al. 2003) proved that lysozyme already undergoes a significant secondary structure reorganization for pressures just above 100 bar. However, this experiment concerned lysozyme films, hence surface effects as well as solvent arrangement around the protein can greatly modify protein stability. As unfolding processes for proteins in solution are, in general, induced at pressures larger than 2000 bar (Zipp & Kauzmann 1973; Heremans & Smeller 1998; Kunugi & Tanaka 2002), the range of pressures at which proteins maintain their folding is quite large. More in detail, pressure may modify the shape of the protein energy landscape, by altering the local curvature of the potential well minima or the height of the energy barriers between substates (Meinhold et al. 2007).
For this reason, we may expect that by applying moderate non-denaturing pressures, the properties of water in the interface with the protein surface are more affected than in the bulk. On the other hand, changes of dissipative forces of the solvent, induced by pressure, can in turn strongly modify the protein fast structural fluctuations. On these grounds, some new insights into the relationship between the protein dynamics and the hydration shell can be given by perturbing the system with moderate pressure, and following protein and solvent structural alterations together with protein thermal fluctuations.
This is what has been done and reported in this paper, where new results of combined SAXS and neutron scattering (NS) investigations of lysozyme in D2O solutions at pressures up to 1500 bar are shown and discussed. The SAXS technique allows us to accurately monitor the overall structural changes of the protein, of the hydration shell around the protein and of the protein–protein interactions, while NS sheds light on the roto-translational diffusion and internal dynamics of the protein. In particular, incoherent NS probes primarily single-particle motions of hydrogen atoms on length scales of the order of Angstroms and time scales ranging from picoseconds to nanoseconds, as hydrogen has an incoherent scattering cross section much larger than deuterium and other atoms. As hydrogen atoms are almost uniformly distributed through the biomolecules, global diffusive motions and internal fluctuations of proteins can be sampled (Bee 1992). The combination of NS and SAXS enables us to clarify the pressure-dependent interplay between protein structure and dynamics.
Let us conclude that the whole set of high-pressure SAXS data has been analysed by means of a new, original method for a fast calculation of protein form factors from atomic coordinates, which includes the description of solvation molecules as dummy atoms. The new approach is detailed in a dedicated appendix.
2. Material and methods
2.1. Sample preparation
Hen egg-white lysozyme was purchased from Sigma Chemical Co. Both for X-ray and NS experiments, protein solutions were prepared by dissolving the lysozyme powder in deuterated water. For each experiment, the protein concentration was 10 w/w %, as checked by spectrophotometry by using an extinction coefficient  at 280 nm. In all cases, the pD of protein solutions was adjusted to 7.5 by microlitre addition of 1 M NaOH. The resulting ionic strength was 30 mM.
2.2. Experimental procedures
2.2.1. Small-angle X-ray scattering.
Data were collected on the SAXS beamline at the Elettra Synchrotron in Trieste, Italy. Measurements were executed at 20°C using a high-pressure cell (Pressl et al. 1997) equipped with diamond windows of 0.75 mm thickness each, covering a pressure range from 1 to 1500 bar, below the expected pressure denaturation threshold. The X-rays' wavelength θ was 0.77 Å, corresponding to the energy of 16 keV. The investigated Q-range ( , where 2θ is the scattering angle) was 0.035−0.6 Å−1. SAXS profiles were recorded on an MAR345 image plate detector. The acquisition time for each SAXS image was 5 min and we waited for 5 min between one measurement and the next one in order to perform each experiment under equilibrium conditions.
Both lysozyme solutions and buffer SAXS measurements were performed at the same pressure values. Raw data were radially averaged by FIT2D software (Hammersley 2004) and calibrated using silver behenate (Puxkandl et al. 2002). Transmission values were measured for each investigated pressure condition. The buffer contribution, corrected for the protein volume fraction, was subtracted from the protein solution signal at each investigated pressure.
2.2.2. Neutron scattering experiments.
The quasi-elastic neutron scattering (QENS) experiment was performed on the IN5 disk chopper time-of-flight spectrometer at the Institut Laue Langevin (ILL) (Ollivier et al. 2004). Measurements were carried out using an incident neutron wavelength of 5 Å, which gives a Q-range of 0.4−2.2 Å−1 and an energy resolution of 100 µeV (slowest accessible time around 15 ps) at full width half maximum. Experiments were performed at 20°C using a stainless high-pressure sample holder for liquids. Protein solution and buffer were both measured at ambient pressure, 370, 1000, 1500 and 2000 bar. At the end of the pressure cycle, the protein solution was measured again at ambient pressure. Detector efficiency corrections have been performed normalizing the data by standard vanadium. The time-of-flight data could be used up to ∼Q = 1.7 Å−1 as a consequence of a particular feature on the scattering function related to the geometry of the sample holder, which was specifically built for the backscattering spectrometer.
The elastic incoherent neutron scattering (EINS) experiments were performed at the backscattering spectrometer IN13 at ILL, with an energy resolution of 8 µeV (integrating motions slower than approx. 80 ps) at ambient pressure, 300, 700 and 1500 bar, using the same high-pressure sample holder of the QENS experiment. The elastic intensities, measured as a function of the pressure, were normalized with respect to the ambient pressure intensity.
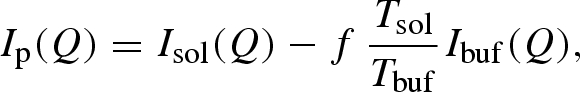
For both NS experiments, the signal from the protein alone, Ip(Q), as a function of pressure has been estimated by directly subtracting the intensity of the buffer sample, Ibuf(Q), from that of the solution, Isol(Q), through the simple relationship
 |
2.1 |
where Tsol and Tbuf are the measured transmission of the solution and the buffer, respectively, and f is a coefficient that takes into account the protein excluded volume. The f-value was estimated to be equal to 0.9. Because of the low transmission of the sample holder (T = 0.75 at Q = 2.23 Å−1), data collection lasted between 8 and 10 h per pressure value. The reduced QENS data were analysed using ILL LAMP programs (Richard et al. 2003).
3. Results and discussion
SAXS, EINS and QENS have been used to derive the effect induced by pressure on the structure and dynamics of a protein in fully hydrated conditions, lysozyme solutions, at the constant concentration of 10 w/w % and under the same experimental conditions (heavy water as solvent, pD = 7.5 and 30 mM ionic strength). According to the techniques used, the results will be reported separately, in different paragraphs, hence a unique mechanism will be tentatively discussed in the conclusion.
3.1. Structure: small-angle X-ray scattering results
SAXS curves are reported in figure 1. At first glance, it is evident that neither abrupt structural modifications nor aggregation occur at increasing pressures. Data reported in the form of a Kratky plot (Kratky et al. 1979) (figure 2) strongly confirm this suggestion: even at the higher investigated pressures, lysozyme maintains a compact and globular structure. On the other hand, it can be seen that pressure appears to mainly affect the SAXS curves at very low Q range (figure 3), suggesting that changes in the protein–protein interaction properties occur. In particular, the interaction peak moves towards bigger Q values, while its height decreases with pressure. As shown in the first two panels of figure 4, where the position and height of the interaction peak as resulting from a parabolic fit of the experimental data at low Q range are reported, the changes are not linear with pressure. This basic analysis seems to demonstrate the presence of two discontinuities: one between 200 and 400 bar and the other between 600 and 800 bar.
Figure 1.

Set of experimental SAXS curves obtained for lysozyme solution at increasing pressures, reported in bars on the left. Continuous lines represent the theoretical fitting curves obtained using the described global fit model. For the sake of clarity, each curve has been scaled by a factor multiple of 2 cm−1.
Figure 2.

Kratky plots obtained from the experimental SAXS curves at the lowest and the highest investigated pressures. Open square, 1 bar; open diamond, 1500 bar.
Figure 3.

Zoom on the low Q range of experimental SAXS curves and their theoretical fits. Corresponding pressures (in bar units) are: open square, 1; filled square, 100; open circle, 350; filled circle, 500; open triangle, 700; filled triangle, 900; reverse open triangle, 1100; reverse filled triangle, 1300; open diamond, 1500.
Figure 4.

From top to bottom: position and height of the interaction peak determined by a fit of the low Q experimental SAXS curves and parameters resulting from the global-fit procedure. All parameters are reported versus pressure.
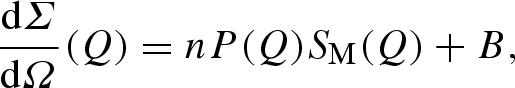
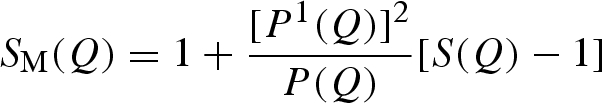
In order to quantitatively analyse SAXS data, a proper modelling of both particle form factor and particle–particle structure factor is then required. Indeed, the experimental macroscopic differential scattering cross section dΣ/dΩ(Q) (shortly, the experimental scattering intensity), obtained from a SAXS experiment, is described by the classical expression (see equation (A 29) in the appendix)
 |
3.1 |
where n is the protein number density, P(Q) the protein form factor, SM(Q) the so-called measured structure factor related to the particle–particle structure factor S(Q) (see equation (A 30) in the appendix) and B a flat background.
In the present case, P(Q) has been calculated from the lysozyme crystallographic structure (PDB entry 6lyz; Diamond 1974) using a new approach (which is the basis for a new free downloadable software SASMOL; Spinozzi et al. 2009). The method is presented and discussed in detail in the appendix, but it could be interesting to note here that its main novelty resides in the description of the solvent molecules in the first (and eventually second, third and so on) protein solvation shell, which are found by burying the protein molecule in a tetrahedral close-packed (tcp) assembly of Gaussian spheres. In particular, the number of water molecules in contact with lysozyme is found to be 383 (Spinozzi et al. 2008).
The structure factor S(Q) was calculated in the random phase approximation (Narayanan & Liu 2003; Ortore et al. 2008), considering the two-body interaction potential as the sum of a hard sphere, a screened Coulombic and attractive Yukawian potentials. The hard-sphere potential plainly depends on the average protein radius, R, which in simple terms can be related to lysozyme molecular volume that, increasing pressure, varies according to protein compressibility (Kundrot & Richards 1987; Katrusiak & Dauter 1996; Fourme et al. 2001). The Coulombic screened potential depends on the number Z of charges per protein, on the dielectric constant of the medium ε (which is known to increase as a function of pressure (Floriano & Nascimento 2004)) and on the ionic strength of the solution IS (Spinozzi et al. 2002). According to previous data (Gruner 2004), the protein charge is not expected to be largely affected by high pressure, at least if unfolding events do not occur. The attractive Yukawian potential is related to short-range attraction and depends on the energy at the protein–protein contact J and on the characteristic decay length d. This potential can be influenced by pressure through modifications of the lateral chain mobility as well as by changes in protein hydration properties or in protein surface architecture.
Therefore, equation (3.1) was used to analyse in a unique fitting calculation (called global fit approach (Ortore et al.
2005, 2008; Sinibaldi et al. 2007)) all the scattering curves as a function of pressure. Among the parameters of the model, some are known, whereas others are found by the fitting procedure. Moreover, some fitting parameters are common to all the curves, i.e. do not depend on pressure p; others are associated with each curve, i.e. are a function of p. However, for the latter, we used a regularization method (Glatter 2002), which avoids dramatic variations or oscillations of values with p. Molecular volumes of bulk water and lysozyme were considered to change with pressure according to their compressibilities, which were described by Tait's equation (Hayward 1967). For bulk water, the compressibility at zero pressure,  , and the first derivative of the isothermal bulk modulus at zero pressure,
  , were considered known parameters and fixed to 4.59 × 10⁻⁵ bar−1 and 5.68, respectively, according to experimental compressibility data (Macdonald 1969). For lysozyme, the two corresponding parameters,
  and ηp, were considered fitting parameters, common to all investigated conditions. On the other hand, we let the protein charge Z, the relative mass density of the first hydration shell ρ1/ρ0 and the parameters J and d that describe the attractive potential to be singularly fitted for each scattering curve, their dependency on pressure being, in general, unknown. The already discussed volumetric properties of bulk water, hydration water and lysozyme, as a function of p, allow us to indirectly derive the dependency on p of other model parameters, such as the average protein radius R, the protein number density n, the relative variation γ of the lysozyme volume (see appendix) and the solution ionic strength IS.
Fitting curves obtained from the global analysis are superimposed on the experimental data in figure 1: the good quality of results can be easily appreciated. As expected, the new approach (see appendix) enables us to obtain a very good fit even at the largest Q values. On the other hand, the interaction peak at low Q values is really well fitted (figure 3). The fitting parameters resulting from the global approach are reported as a function of pressure in the different panels of figure 4. At first, it should be noticed that fitting parameters are in good agreement with previous data: at ambient pressure, the hydration shell becomes 13 per cent more dense than the bulk (Svergun et al. 1998a; Merzel & Smith 2002), while lysozyme compressibility is found to be  bar−1, with ηp ≃ 0, in good agreement with previous results (Kundrot & Richards 1987).
Considering the other single fitting parameters, it can be observed from figure 4 that hydration shell density regularly increases at increasing pressures. It is noteworthy that a soft transition occurs at around 700 bar, the value of pressure at which the protein mobility changes (§§3.2 and 3.3). The strength J of the attractive potential decreases as a function of pressure, while the corresponding range d increases. However, larger changes occur again in the pressure range between 200 and 800 bars, after which both J and d remain rather constant. A similar trend characterizes the lysozyme charge Z, even if the charge decreases at increasing pressure: indeed, at pressures larger than 800 bar, Z is constant, and becomes reduced for one electrostatic unit. It should be observed that charge modifications can be due to a partial rearrangement of the amino acids on lysozyme surface induced by pressure; in fact, we have calculated that, at pD = 7.5, just the burying of one arginine residue from the lysozyme surface to the core modifies the protein charge for one electrostatic unit (Taulier & Chalikian 2003).
Figure 5 shows the whole protein–protein interaction potential calculated at each investigated pressure; the influence of each repulsive and attractive potential can be appreciated in the inset of this figure. It can be seen that the attractive potential is more influenced by pressure with respect to the Coulombic potential. However, both of them mainly mutate in the pressure range under 1000 bar.
Figure 5.

Interaction potentials calculated at each investigated pressure using fitted parameters. The main figure represents the total interaction potential, while in the inset attractive and repulsive potentials have been reported. Arrows indicate increasing pressures. All the interaction potentials are shown for distances bigger than the protein diameter. An average uncertainty on the curves is represented by the error bar.
3.2. Dynamics: elastic neutron scattering
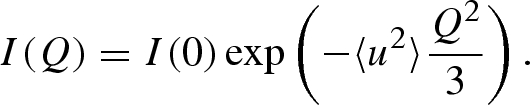
EINS experiments have been performed in order to probe the mean square displacement (MSD) of the protons. At very low temperatures, all atoms are immobile, except for the zero-point motions that generate an uncertainty on the atoms' localization, as measured in the spectra by the Debye–Waller factor
 |
3.2 |
In this expression, 〈u2〉 is interpreted as the average radius of the region dynamically occupied by hydrogen atoms. When a quasi-elastic signal appears, there is a reduction in the intensity scattered within the energy windows defined by the experimental resolution of the spectrometer. Hence, the effective value of 〈u2〉 fitted by the previous equation becomes larger than the value solely due to vibrations.
As already described, the elastic intensities, measured as a function of p, were normalized with respect to the ambient pressure intensity values. Then, from data analysis, we inferred the differential conformational MSD, 〈u2〉p − 〈u2〉 p = 1, which allowed for small relative differences in the atomic fluctuations. Figure 6 shows MSD values as a function of pressure. As already observed for other proteins (Meinhold & Smith 2005; Calandrini et al. 2008), increasing the pressure, we monitored a reduction in protein fluctuations, suggesting a loss in protein mobility that follows a change in the local energy landscape. In particular, we detected that, already at 300 bar, the protein fluctuations are altered with respect to ambient pressure, while a pronounced change in the MSD occurs in the investigated low-pressure range (up to 700 bar). A less marked change in protein mobility has been instead observed between 700 and 1500 bar.
Figure 6.

Differential MSD 〈u2〉p − 〈u2〉p = 1, plotted as a function of pressure and at 20°C for 10 w/w % lysozyme solution.
3.3. Dynamics: quasi-elastic neutron scattering
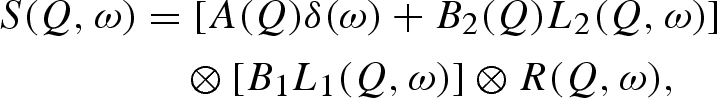
In order to measure the perturbation of non-denaturing pressure on lysozyme solution dynamics over the picoseconds time scale, we performed QENS experiments. The incoherent dynamic structure factors, obtained from quasi-elastic curves, have been analysed using a fit equation not related to any microscopic model
 |
3.3 |
 |
3.4 |
where  is the energy transfer between the neutron and the sample (
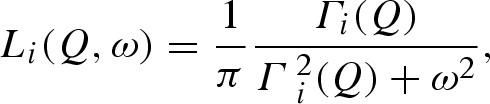
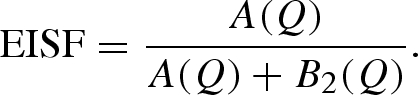
 is the reduced Planck constant), δ(ω) is Dirac's delta function and ⊗ means convolution in ω space. The two quasi-elastic Lorentzian functions, L1(Q, ω) and L2(Q, ω), which are found by fitting their heights B1 (independent on Q) and B2(Q) and their half widths at half maximum (HWHM), Γ1(Q) and Γ2(Q), describe the Brownian diffusion of the protein and its internal diffusive and reorientational motions, respectively. A(Q) is the fitted height of the elastic contribution, whereas R(Q, ω) is the measured instrument resolution function. The elastic incoherent structure factor (EISF), related to the geometry of the movements at the molecular level, can be calculated from the fit parameters through
 |
3.5 |
The EISF extracted in that way, together with the quasi-elastic linewidths Γi(Q), may be compared with microscopic models. We verified that the signal from lysozyme in solution at ambient pressure within the high-pressure cell is comparable to data already available in the literature for lysozyme in a standard aluminium cell. This is confirmation of a reliable data correction procedure.
Figure 7 shows the dynamic incoherent structure factor spectrum, averaged over all the available wave-vector transfers, for the different considered pressures, from ambient to 370, 1000, 1500 and 2000 bar. While the MSD shows a pressure dependence already at feeble pressure value, the dynamic structure factor does not vary up to 1000 bar. Above this value, pressure induces a sharpening of the S(Q, ω), an effect that has been probed to be completely reversible once the pressure is released.
Figure 7.

Incoherent dynamic scattering functions, averaged over all the investigated Q values and normalized to the peak height, plotted as a function of pressure and at 20°C for 10 w/w % lysozyme solution. Corresponding pressures (in bar units) are: solid line, 1; dashed line, 370; small dash line, 100; dotted line, 1500; dashed-dotted line, 2000.
The HWHM Γ1(Q) of the Lorentzian L1(Q, ω) shows a dependence on Q, which follows, with a reasonable approximation, a hydrodynamic regime behaviour, Γ1(Q) = D1Q2, yielding a value of the protein centre of mass diffusion coefficient D1 that ranges between 9 × 10⁻⁷ and 6.4 × 10⁻⁷ cm2 s−1 from ambient up to 2000 bar (figure 8). The negligible decrease of D1 is in agreement with the little change in the solvent viscosity as pressure increases (Likhachev 2003), except for an excess of variation for pressure above 1000 bar. The 15–30% variation of D1 value observed above 1000 bar is inconsistent with the pure water viscosity trend and would imply a real change in the lysozyme diffusion properties. Indeed, such observation may suggest that changes in the protein–protein interactions result in more tight crowding conditions, which restrict large-scale protein roto-translational motion. However, pressure-induced protein aggregations, still determined by changes in protein–protein interaction potentials but in full disagreement with SAXS results, could also explain such a behaviour. Indeed, considering that the two sets of experiments had very distinct acquisition times, we could not exclude the formation of some small aggregates. Lysozyme is known to undergo reversible self-association at pH > 5 and in highly concentrated solution (Chiancone et al. 1965; Gottschalk & Halle 2003). In any case, we observed that the measurement performed after the pressure release reproduces the same diffusion coefficient (in general, the same S(Q, ω) of the first measurement), suggesting a complete reversibility of the phenomenon.
Figure 8.

Centre of mass diffusion coefficients, as a function of pressure, inferred from the HWHM, Γ1 (Q), of the Lorentzian functions L1 (Q, ω).
Figure 9 shows the HWHM Γ2(Q) of the Lorentzian function L2(Q, ω) that describes the protein intrinsic dynamics, plotted versus Q2 and as a function of pressure. At 2000 bar, the S(Q, ω) sharpens so much that the data can be fitted with the only Brownian diffusion component. This suggests that the protein intrinsic dynamics is dramatically slowed down at high pressure in such a way that it cannot be revealed with the experimental energy resolution.
Figure 9.

HWHM for the Lorentzian functions L2 (Q, ω), plotted versus Q2 and as a function of pressure. Relative pressures (in bar units) are: open square, 1; open circle, 370; open triangle, 1000; reverse triangle, 1500.
A substantial change in the Γ2(Q) dependence on Q is observed from pressure above 1000 bar. We probed a transition from a dependence on Q, of the Γ2(Q) at low-pressure values, to almost independence from Q at 1500 bar. While the first feature describes the ability of the protein hydrogens to perform diffusion motion, the second effect might be interpreted as due to very localized motions. This evolution seems progressively to take place from 1000 bar, where we can observe that Γ2(Q), at high Q values, is very close to the value at 1500 bar.
We like to assign this change on Q dependence to a modification of the side-chain dynamics at the surface of the protein, as a consequence of new structural packing and dynamical properties of the first hydration layer, which can be related to a higher density of water clusters around the surface (Neilson et al. 1979; Bellissent-Funel et al. 1995; Mentre & Hui Bon Hoa 2001; Doster & Gebhardt 2003; Bellissent-Funel 2008). A new structural packing of the hydrogen bond network can also reflect an increase in fulfilled protein hydration sites upon pressurization, as observed by the molecular dynamics simulation of Oleinikova et al. (2006) on crystalline SNase protein molecule.
The observed confinement effect can be approximately accounted for by the model of the free diffusion of a particle inside a sphere or by the model of hindered rotations. The latter model was successfully applied by Russo et al. (2007), who observed that the side chain and the backbone dynamics of a protein model peptide in solution are dominated by methyl group librations/rotations when only one hydration layer is considered: the structure and the highly suppressed dynamics of the first hydration layer strongly affect the biomolecule dynamics, constraining the explored space and, more important, suppressing the translational diffusive motion. Comparing the present study with that by Russo and co-workers, a very interesting similarity is that, by increasing pressures, the hydration water changes its packing (Bellissent-Funel et al. 1995; Oleinikova et al. 2006) and dynamics, which is reflected by a change in the surface protein dynamics. In both studies the inferred Lorentzian HWHM, Γ2(Q), is Q independent and happens to have exactly the same mean value of 0.2 meV (in the case of hindered rotation, approximated with the three-site jump reorientation model, a width of 0.2 meV corresponds to a residential time between flips of 5 ps (Zanotti et al. 1997)).
In the case of the free diffusion in a sphere model, we observe that, by increasing pressures, the radius of the sphere, which describes the explored space, decreases. The model predicts that a plateau of the quasi-elastic width persists at small Q until Q0 = π/a with Γ2(Q) = 4.33 D2/a2, a being the radius of the sphere and D2 the local diffusion coefficient (Bellissent-Funel et al. 1995). From figure 9, we can distinguish a plateau up to Q2 ≃ 1 Å2 between ambient and 1000 bar. A wider plateau can be discriminated for 1500 bar (Q2 = 2.5 Å2). The local diffusion coefficient, D2, has been found to be 3 × 10⁻⁵ cm2 s−1 for pressure up to 1000 bar and 2.7 × 10⁻⁵ cm2 s−1 at 1500 bar. However, we stress that the local diffusion coefficients derived here are strictly model dependent.
A more accurate analysis of the geometry of active motions can be inferred through the EISF. Figure 10 shows the calculated EISF together with the fit to the diffusion model (the fit to the hindered motion model shows the same quality). An important variation of the EISF is probed for pressures above 1000 bar. In particular, we observe a higher elastic constant contribution (i.e. increase in the fraction  of immobile protons (Zanotti et al. 1997; Russo et al. 2002)) at 1500 bar with respect to the 1000 bar data. This behaviour is consistent with the fact that by increasing pressure a sort of confining effect is taking place. Motions are probably slowed down and are no longer resolved by this resolution, i.e. at 2000 bar we were not able to monitor the internal dynamics. Fitting the data with the diffusion into the free diffusion in a sphere model, we have quantified that the fraction of protons that are seen as immobile varies from
  at p = 1 to
  at 1500 bar (up to
  at 2000 bar). The corresponding radius of the diffusion sphere changes from 3 to 2 Å. The outcoming dynamic picture reveals that, because of a volume reduction, a possible increase in the hydration level with pressure does not have the same effect observed in other fully hydrated biomolecules, where an increase in the mobility has been observed (Russo et al. 2009).
Figure 10.

ESIFs at 370 and 1500 bar. Data are represented by symbols. Lines represent fit to the data following the diffusion into a sphere model. Open square, 370; open circle, 1500.
In the hypothesis that diffusive motions are suppressed by pressure and only fast rotational motions can be probed at 1500 bar, the fit to the data is still of good quality. However, even if a and  parameters show significant values, a comparison between high- and low-pressure data is not possible because of the model-dependent values.
4. Conclusion
The main result of this work is the determination of a simultaneous structural and dynamical painting of the changes occurring to lysozyme in solution, before unfolding, triggered by pressure. It has to be emphasized that the high signal–noise ratio of experimental data is due to the large-facility benefits.
The clearest outcome is that both protein structural and interaction parameters are not affected by pressure in a linear way. In particular, the hydration shell density, provided by SAXS, increases at increasing pressures in correspondence with a transition of the differential MSD, resulting from NS, suggesting a correlation between hydration properties and protein mobility. This transition cannot be directly related to the one determined at low temperature by Chen et al. (2006), without further experimental investigations.
SAXS structural analysis reveals that pressure induces changes in protein hydration properties, and not in the protein low-resolution structure. Hydration modifications probably affect both lateral chain mobility and amino acid charge on the protein surface, thus modifying the particle–particle interactions. These modifications, which we trace in both the attractive and the repulsive potentials, are relevant if considered in the frame of the wide debate concerning the effect of pressure on the aggregation/dissociation processes.
NS experiments reveal that pressure modifies protein overall and local dynamics even if lysozyme maintains its native folding. The intrinsic dynamics is slowed down at high pressure, suggesting a confinement effect probably due to a different packing of hydration water molecules, as proved by both MSDs, resulting from EINS and the fraction of protons  determined to be immobile by QENS. In fact, increasing pressures determine the decrease of MSD and the increase of
  .
.
These NS results can be read considering that pressure modifies the protein energy landscape surface and increases its roughness (Silva et al. 2001), hence limiting protein local motion. That being so, it is possible to retain that the increased roughness of the energy landscape determines a sort of protein confinement that we trace in the decrease of the interaction parameters provided by SAXS. Pressure indeed can affect all solvent-mediated forces and thus correlate with the roughness of the energy landscape. In fact, both the strength of the attractive potential J and the protein charge Z, which determines the repulsive interaction, are reduced by pressure. However, a relation between protein intrinsic dynamics, protein–protein interactions and the surface or protein energy landscape is carefully assumed here and deserves future experimental and theoretical investigations.
Acknowledgements
The authors thank ILL and Elettra for beam time allocations. L.R.S.B. thanks CAPES for financial support. D.R thanks Top Industry (FR) for collaborative interaction in the manufacturing of the high-pressure cell used in the NS experiments and Didier Richard from the ILL facility for his help on the LAMP program. F.S. thanks A. Carbini for his help in finding sulphur-rich protein structures.
Appendix A
Small- and medium-angle scattering techniques (SAS) applied to biological molecules in solution provide information on their average structure at a resolution scale near 5–10 Å. Both X-rays (SAXS) or cold neutrons (SANS) can be used as incidence beams: the former interact with electrons, the latter with nuclei, providing, in general, complementary information. When an atomic model of the investigated macromolecule is available, the degree of similarity between the crystal and the solution structure can be obtained by comparing calculated scattering patterns with experimental SAS curves. Atomic details become more relevant on going to values of the scattering momentum Q larger than 0.2–0.4 Å−1. Different methodologies have been developed for calculating the solution scattering curve from atomic coordinates (Svergun et al.
1995, 1998b; Merzel & Smith 2002) and particular care is needed to take into account the contribution of both the displaced solvent and the solvation shell around the macromolecule. The widely used CRYSOL software accounts for the solvation shell by calculating the so-called envelope function  , surrounding it by a shell of solvent with a constant thickness of 3 Å and a proper scattering length density, which can be different from the one of the bulk solvent. As stated by the authors, the main drawback of this approach is that, in the definition of
  , internal solvent cavities or narrow external solvent grooves are not included. Recently, a new computational method, based on the description of the shell solvent using dummy atoms, has been presented to the scientific community (Malfois & Svergun 2002). In this work, we have referred to that point of view to develop a new method for a fast calculation of the scattering curve, able to be included in data-fitting procedures.
The scattering amplitude of an isolated macromolecule constituted by N atoms is, in general, given by
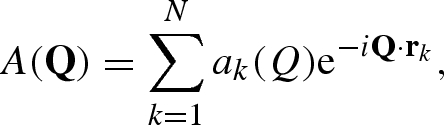 |
A 1 |
where Q is the momentum transfer vector, whose modulus Q is related to the scattering angle 2θ and the beam wavelength θ by Q = 4π sin θ/θ, and rk is the position of the k-atom.
For X-rays, the atomic scattering length ak(Q) is
 |
A 2 |
where re = 0.28 × 10⁻¹² cm is the classical radius of the electron,  is the Thomson scattering factor, calculated by the Fourier transform of the atomic electron density (which is assumed to be spherically symmetric),
  and
and  are, respectively, the real and imaginary anomalous scattering correction terms, both depending on the X-ray wavelength θ (Cromer & Waber 1965; Cromer & Mann 1967; Cromer & Liberman 1981). Biomolecules contain a very large number of light atoms for which the anomalous scattering contribution can be neglected and only a few heavy atoms (e.g. phosphorus, sulphur, iron, copper) with significant anomalous scattering corrections.
For cold neutrons, the coherent scattering length of an ensemble of spins of a single isotope does not depend on Q (Stuhrmann 2004, 2008)
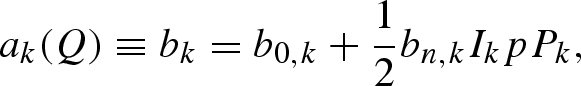 |
A 3 |
where b0,k is the average of the two scattering lengths, corresponding to the two combinations of the isotope spin Ik and the neutron spin s = 1/2, and bn,k accounts for the difference of the two contributions. p and Pk are, respectively, the polarization state of neutrons and isotopes, both with respect to the same polarization axis. The second term of equation (A 3) is relevant when the polarization p of the incident neutron beam is close to 1. Selective nuclear polarization Pk can be achieved using methods of NMR spectroscopy. The two hydrogen isotopes, proton (H) and deuteron (D), are particularly used for standard and polarization contrast variation techniques. For completely polarized neutron beams (p = ±1), the scattering lengths of proton and deuteron in units of 10−12 cm are
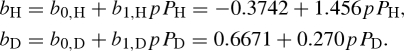 |
A 4 |
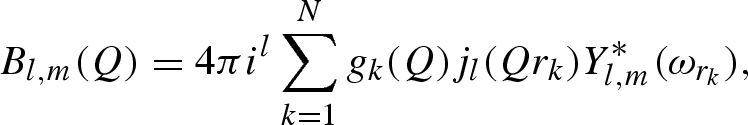
Using Rayleigh's expansion, equation (A 1) can be developed in series of spherical harmonics, Yl,m, up to the maximum rank, L (Svergun et al. 1995; Spinozzi et al. 1998),
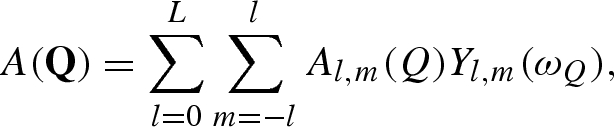 |
A 5 |
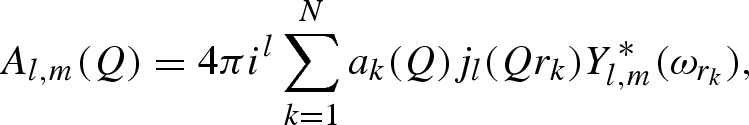 |
A 6 |
where jl(x) is the lth Bessel function of fractional order (Abramowitz & Stegun 1964) and ωQ, ωrk the polar angles of vectors Q and rk, respectively. For X-rays, by combining equation (A 2) with equation (A 6), two distinct terms, one elastic (independent on θ) and one ‘anomalous’, depending on θ, can be defined
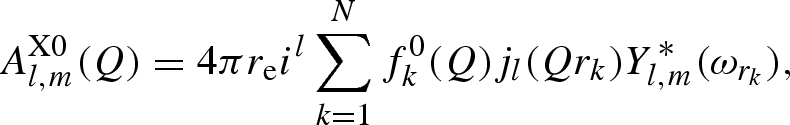 |
A 7 |
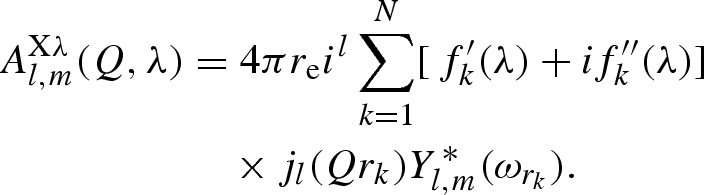 |
A 8 |
Considering neutrons, we have to take into account that some of the macromolecular hydrogens can exchange with exchangeable protons or deuterons of the solvent molecules. Hence, it is convenient to define the ‘deuteration grade’ of the system as the ratio  ,
,  and
and  being the number densities of all the exchangeable deuterons and protons, independently of the molecule they originate from. Combining with equation (A 4) and considering only the cases of polarized protons or deuterons, for NS experiments, the amplitude of the isolated macromolecules is
 |
A 9 |
where the three distinct terms are defined as
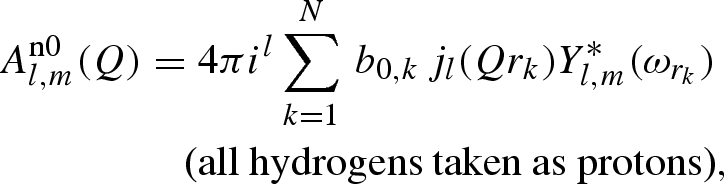 |
A 10 |
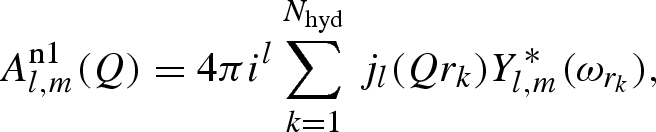 |
A 11 |
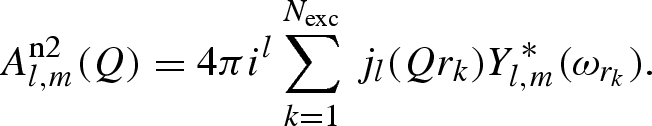 |
A 12 |
In these equations, Nhyd and Nexc are the whole number of hydrogens and the number of exchangeable hydrogens in the macromolecule, respectively.
It has been shown that, for both X and neutron beams, the scattering amplitude of the solvent displaced by the macromolecule can be obtained by replacing the k atom by a ‘dummy’ atom with a spherical Gaussian distribution of scatterers (Fraser et al. 1978; Svergun et al. 1995). The displaced solvent-scattering amplitude is expressed by a function analogous to equation (A 5)
 |
A 13 |
 |
A 14 |
where gk(Q) is the form factor of the spherical Gaussian dummy atom,
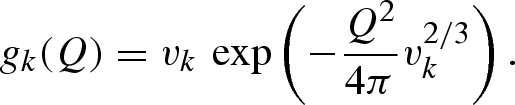 |
A 15 |
vk is the ‘core’ volume of the k atom, defined in terms of van der Waals radius rvk. In equation (A 13) ρ0 is the scattering length density of the bulk solvent and G(Q) is a factor that depends on the ratio between the average core volume of a macromolecule's atom and the volume of solvent ‘displaced’ on average by that atom (Grishaev et al. 2005)
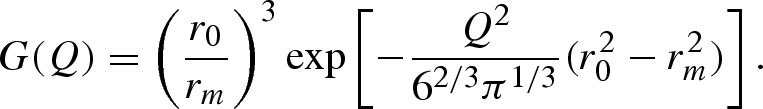 |
A 16 |
 is the calculated average core radius of atoms, whereas the free parameter r0 is the average radius of the solvent dummy sphere displaced per macromolecule's atom (Svergun et al. 1995).
Following the original idea of Malfois & Svergun (2002), we also describe solvent molecules in contact with the macromolecule by dummy Gaussian spheres. Moreover, we here propose to determine the number and the geometrical coordinates of such spheres by burying the macromolecule in a tcp assembly of dummy spheres. This structure is similar to the one of the diamond or to the one constituted by positions of oxygen atoms in the cubic ice phase (Ic). The tcp lattice is obtained by a combination of the face-centred cubic Bravais lattice with a basis of two dummy spheres, one at (0,0,0) and the other at (1/4, 1/4, 1/4), where the coordinates are given as fractions along the cube sides a. The nearest-neighbour distance  is fixed to a value close to the first peak of the solvent–solvent correlation function g(r). The typical value for water is d = 2.8 Å (Chialvo et al. 2000). A set of tcp positions, here indicated as pj, are generated within a sphere with radius slightly larger than the maximum macromolecule radius Rmax calculated from its geometrical centre. A robust identification of the solvent dummy spheres in contact with the macromolecule is achieved if the whole macromolecule is both translated and re-oriented for obtaining the best superposition among macromolecule atoms and tcp positions. In particular, the rms of the distances between the position rk of the atoms in the backbone (carbons Cα for proteins) and the nearest tcp points is minimized by optimizing three Cartesian translations Rx, Ry and Rz and three Euler angles α, β and γ.
Then all the N macromolecule atomic coordinates rk are mapped within the set of tcp positions in order to find those tcp ‘free’ positions  that do not belong to any macromolecule's atoms. Therefore, for the jth free lattice point
  , the nearest macromolecule atom, whose position is indicated with rj, and the corresponding distance
  are found. If the minimum distance is greater than the sum between the van der Waals radius of the atom, rvj, and the ‘effective’ radius of the solvent molecule, here written as κd (i.e. if
  ), then the lattice point
  is considered as belonging to the first solvation shell of the macromolecules and indicated as
  . Test cases have shown that a wise value of κ is 0.3. The remaining free lattice points, which are the nearest neighbours to the first solvation shell points, will be assigned to the second solvation shell and indicated as
  and so on up to a defined number Ns of solvation shells that we wish to take into account. The ‘excess’ scattering amplitude of the sth solvation shell (with
  ) with respect to the bulk solvent is then calculated by
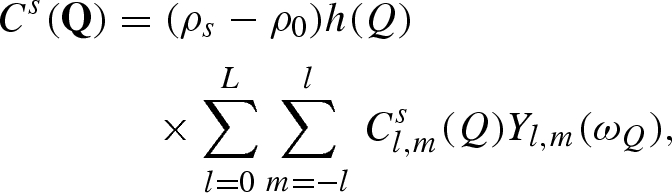 |
A 17 |
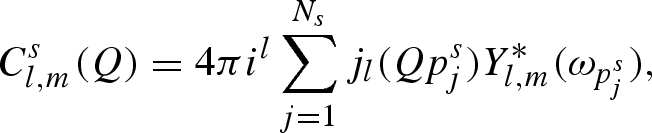 |
A 18 |
where ρs is the scattering length density of the s solvation shell,  and ωpjs are modulus and polar angles of the vector
  , respectively, and h(Q) is the form factor of the spherical Gaussian representing the dummy solvent molecules belonging to any solvation shell
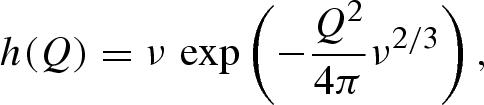 |
A 19 |
ν being the molecular volume of the solvent.
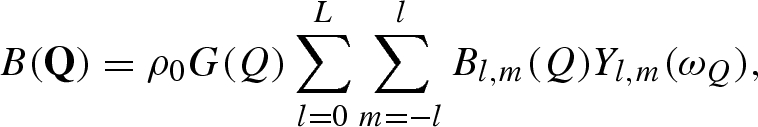
The scattering amplitude of the macromolecule in solution is
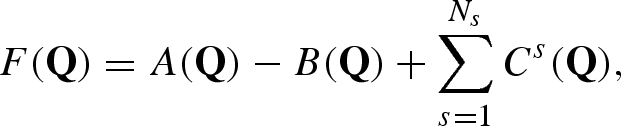 |
A 20 |
and, by using the orthogonal properties of spherical harmonics, the averages over the polar angles ωQ (i.e. the orientational averages) of both the amplitude and the squared amplitude (this latter average commonly called ‘form factor’) are found to be
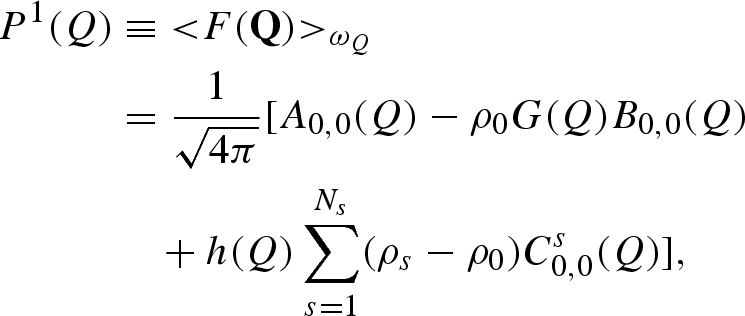 |
A 21 |
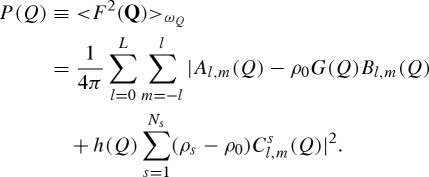 |
A 22 |
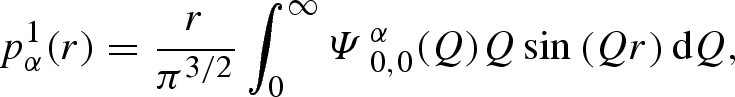
The two orientational averages can be more conveniently written as isotropic Fourier transforms of two corresponding radial functions (Spinozzi et al. 2002)
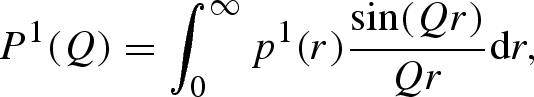 |
A 23 |
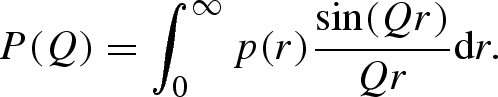 |
A 24 |
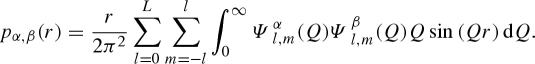
These functions, in turn, can be written as linear combinations of single and pair partial radial functions (PRFs),
 |
A 25 |
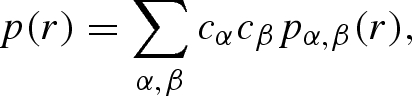 |
A 26 |
which become
 |
A 27 |
 |
A 28 |
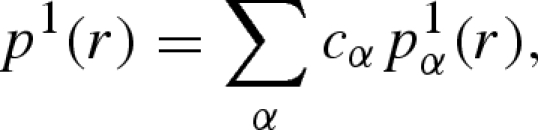
The labelled functions  represent the distinct spherical component of partial amplitudes, as reported in table 1, together with the definition of coefficients cα. The ‘macroscopic differential scattering cross section’ (shortly the ‘scattering intensity’), which is the SAS datum experimentally available, is finally calculated by the classical expression
 |
A 29 |
where n is the macromolecule number density, SM(Q) is the so-called ‘effective’ (or ‘measured’) structure factor
 |
A 30 |
and S(Q) is the particle–particle structure factor. The flat background B takes into account all incoherent scattering effects, which are particularly relevant in SANS experiments of protonated samples (Stuhrmann 2004).
Table 1.
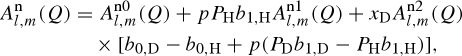
Definition and indexation (α) of spherical components of partial scattering amplitudes, Ψl,mα, for a macromolecule in solution and for its Ns solvation shells. The corresponding coefficients cα refer to different types of SAS experiments: standard SAXS; anomalous SAXS (ASAXS) with Nθ distinct X-ray wavelengths; standard and fully neutron polarized SANS with sample deuteration grade xD, neutron polarization p = ±1 and proton (deuteron) polarization PH (PD).
|
cα |
||||
|---|---|---|---|---|
| α | Ψl,mα | SAXS | ASAXS | SANS |
| 1 |  |
1 | 1 | 0 |
| 2 |  |
0 | 1 | 0 |
| 1 + i |  |
0 | 1 | 0 |
 |
 |
0 | 1 | 0 |
 |
 |
0 | 0 | 1 |
 |
 |
0 | 0 |  |
 |
 |
0 | 0 |  |
 |
 |
 |
||
 |
 |
 |
||
 |
 |
 |
||
 |
 |
 |
||
A.1. Program implementation
The whole set of PRF, calculated from equations (A 27) and (A 28), contains all information necessary to build up the average scattering amplitudes P1(Q) and P(Q) of a macromolecule in solution for any type of SAS experiment, either with X-rays (standard or anomalous) or with neutrons (polarized or unpolarized and with samples at different deuteration grades). Given a crystallographic structure, it is thus convenient to calculate the PRF set  once and for all and to store it in a file. Stored information is particularly useful in SAS data fitting for several reasons. Firstly, by means of isotropic Fourier transforms (equations (A 23) and (A 24)), P1(Q) and P(Q) can be determined at any value of Q. Secondly, as shown in table 1, types of experiment, as well as properties of solvation shells (for example ρs), lead only to a proper choice of the coefficients cα, without any variations of PRF. Hence, such coefficients can be easily optimized by fitting procedures. Thirdly, many experiment types and sample conditions leading to many corresponding SAXS/SANS curves can be simultaneously analysed by means of a unique macromolecule structure, which is ‘deposited’ in the
  file. Such a file can be thus considered as a ‘translation’ in an SAS language of a file of atomic coordinates, such as a PDB (Berman et al. 2003) code. For example, let us make the hypothesis that a unique macromolecular structure is preserved by varying concentration or intermolecular interactions. Then we expect that a set of SAXS/SANS curves, recorded at different environmental conditions (e.g. pressure), can be analysed by unique average scattering amplitudes and by optimizing the parameters describing the structure factor S(Q) (see equation (A 29)). Finally, as we have already reported in our recent work (Spinozzi et al. 2007; Ortore et al. 2008), an average ‘isotropic’ compression or decompression upon the molecule structure modifies its average scattering amplitudes to P1(Qγ1/3) and P(Qγ1/3), γ being the ratio between the modified macromolecule volume and its value calculated by atomic coordinates.
The whole algorithm is implemented in the interactive Fortran program SASMOL (Spinozzi et al. 2009). Thomson and anomalous scattering factors are calculated using program routines developed by Brennan & Cowan (1992). Numerical integrations (equations (A 27) and (A 28)) are performed using the trapezium rule, up to a maximum value Q = 10 Å−1 and with integration step δQ = 0.01 Å−1.
A.2. Test example
As a unique test example, we have chosen a sulphur-rich protein. Sulphur is, in fact, exploited as a naturally occurring anomalous scatterer in many protein X-ray crystallography techniques (Behrens et al. 1998; Olczak et al. 2003; Jackson et al. 2006). The chosen protein is the methionine-rich 2S albumin from sunflower seed, deposited in the PDB with the code 1s6d (Pantoja-Uceda et al. 2004). It contains 24 sulphur atoms from 16 methionine and eight cysteine residues. The molecular weight is 14 103 Da, the excluded volume is 15 852 Å3. SASMOL has been applied to the first of the 20 protein molecules deposited in the 1s6d PDB file to calculate SAS curves of aqueous protein solutions. We have chosen as the maximum rank of spherical harmonics L = 30 and as the typical tcp distance of bulk water d = 2.8 Å. The number of hydration shells, Ns, has been fixed to one. The method has found 375 water molecules in contact with the protein. A sketch of their positions is represented in figure 11. Looking at the left column, it seems that some black spheres, which represent first solvation molecules, have been found in internal cavities or external grooves of the protein structure. By taking as water molecular volume ν = 30 Å3, the first hydration shell volume is 11 250 Å3. The whole set of single and pair PRFs has been calculated using two X-ray wavelengths (Nθ = 2): θ1 = 5.016 Å, corresponding to the absorption edge of sulphur, and θ2 = 4.995 Å, slightly before the edge. Graphs of all the calculated PRFs as a function of r are reported in figure 12.
Figure 11.

Representation of methionine-rich 2S albumin atomic structure and of its solvation dummy spheres found by SASMOL. (a) View of tetrahedral close-packed spheres assigned to the protein (white), the first solvation shell (black) and the second solvation shell (grey). (b) Spacefill representation of the protein's atoms. In the left column, all tcp spheres and atoms are shown, whereas in the right column only the ones with the coordinates z < 0 are reported.
Figure 12.

Set of all (a) pair and (b) single (bottom) PRFs calculated with SASMOL for the methionine-rich 2S albumin from sunflower seed (first molecule of the PDB code 1s6d). Two X-ray wavelengths θ1 = 5.016 and θ2 = 4.995 Å (Nθ = 2) have been considered for ASAXS experiments. Only the first solvation shell has been taken into account (Ns = 1). SAXS and SANS atomic scattering lengths are expressed in 10−12 cm units. Indexes α, β (a) and α (b) shown in the legend have been assigned according to table 1. p7,7 (r) and p71 (r) functions, referring to the solvent contributions, have been multiplied by ρ02 and ρ0, respectively, ρ0 = 0.094 being the X-ray scattering length of water in units of 10−12 cm Å−3. Labels for curves with absolute values lower than 0.3 (a) and 0.1 (b) have been omitted for clarity.
Using the set, simulated form factors P(Q) for different types of SAS experiments have then been calculated. The average radius of the displaced solvent dummy sphere, r0, has been fixed to 1.625 Å. For the SAXS and ASAXS cases, the solvent-scattering length density, ρ0, has been fixed to the standard value 0.094 × 10⁻¹² cm Å−3. For SANS simulations, light (xD = 0) and heavy water (xD = 1) solvents have been considered. Two polarization states, parallel and antiparallel, for protons (when xD = 0) and for deuterons (xD = 1), have been simulated. The solvent scattering length density, in units of 10−12 cm Å−3, has been derived by the expression ρ0 = (−0.00562 + 0.0966pPH)(1 − xD) + (0.06404 + 0.015pPD)xD (Stuhrmann 2004). All simulated form factors are shown in figure 13.
Figure 13.

Form factors of the methionine-rich 2S albumin from sunflower seed calculated with SASMOL for SAS experiments with X-rays (standard and anomalous) and with neutrons (polarized and unpolarized and with samples at different deuteration grades xD). See legend of figure 12 for details. Open square, SANS xD = 0; filled square, SANS xD = 0, pPx = 1/2; open circle, SANS xD = 0, pPx = −1/2; filled circle, xD = 1; open triangle, SANS xD = 1, pPD = 1/2; filled triangle, SANS xD = 1, pPD = −1/2; reverse open triangle, SANS; reverse filled triangle, ASAXS θ1; open diamond, ASAXS θ2.
We can see a small but not negligible effect of anomalous scattering, which is due to the quite large number of sulphur atoms in the chosen protein. As expected, there are large differences between SANS curves in light and heavy water. It is interesting to note how marked is the effect of proton or deuteron polarization states.
Footnotes
One contribution of 13 to a Theme Supplement ‘Biological physics at large facilities’.
References
- Abramowitz M., Stegun I. A. 1964. Handbook of mathematical functions with formulas, graphs, and mathematical tables. New York, NY: Dover. [Google Scholar]
- Bee M. 1992. Quasielastic neutron scattering. Philadelphia, PA: Adam Hilger. [Google Scholar]
- Behrens W., Otto H., Stuhrmann H. B., Heyn M. P. 1998. Sulfur distribution in bacteriorhodopsin from multiple wavelength anomalous diffraction near the sulfur k-edge with synchrotron X-ray radiation. Biophys. J. 75, 255–263. ( 10.1016/S006-3495(98)77512-5) [DOI] [PMC free article] [PubMed] [Google Scholar]
- Bellissent-Funel M. C. 2008. Effects of pressure and confinement on liquid water. J. Phys. Condens. Matter 20, 244 120 ( 10.1088/0953-8984/20/24/244120) [DOI] [Google Scholar]
- Bellissent-Funel M. C., Chen S. H., Zanotti J. M. 1995. Single-particle dynamics of water molecules in confined space. Phys. Rev. E 51, 4558–4569. ( 10.1103/physRevE.51.4558) [DOI] [PubMed] [Google Scholar]
- Berman H. M., Henrick K., Nakamura H. 2003. Announcing the worldwide protein data bank. Nat. Struct. Biol. 10, 980–980. ( 10.1038/nsb1203-980) [DOI] [PubMed] [Google Scholar]
- Brennan S., Cowan P. L. 1992. A suite of programs for calculating X-ray absorption, reflection and diffraction performance for a variety of materials at arbitrary wavelengths. Rev. Sci. Instrum. 63, 850–853. ( 10.1063/1.1142625) [DOI] [Google Scholar]
- Bridgman P. W. 1914. The coagulation of albumen by pressure. J. Biol. Chem. 19, 511–512. [Google Scholar]
- Calandrini V., Hamon V., Hinsen K., Calligari P., Bellissent-Funel M.-C., Kneller G. R. 2008. Relaxation dynamics of lysozyme in solution under pressure: combining molecular dynamics simulations and quasielastic neutron scattering. Chem. Phys., 345, 289–297. ( 10.1016/j.chemphys.2007.07.018) [DOI] [Google Scholar]
- Chen S. H., Liu L., Fratini E., Baglioni P., Faraone A., Mamontov E. 2006. Observation of fragile-to-strong dynamic crossover in protein hydration water. Proc. Natl Acad. Sci. USA 103, 9012–9016. ( 10.1073/pnas.0602474103) [DOI] [PMC free article] [PubMed] [Google Scholar]
- Chialvo A. A., Yezdimer E., Driesner T., Cummings P. T., Simonson J. M. 2000. The structure of water from 25c to 457c: comparison between neutron scattering and molecular simulation. Chem. Phys. 258, 109–120. ( 10.1016/S0301-0104(00)00131-2) [DOI] [Google Scholar]
- Chiancone E., Bruzzesi M. R., Antonini E. 1965. Association–dissociation properties of lysozyme. Biochemistry 4, 1796–1800. ( 10.1021/bi00885a016) [DOI] [Google Scholar]
- Cooper A. 1976. Thermodynamic fluctuations in protein molecules. Proc. Natl Acad. Sci. USA 73, 2740–2741. ( 10.1073/pnas.78.8.2740) [DOI] [PMC free article] [PubMed] [Google Scholar]
- Cromer D. T., Liberman D. A. 1981. Anomalous dispersion calculations near to and on the long-wavelength side of an absorption edge. Acta Cryst. A37, 267–268. ( 10.1107/S0567739481000600) [DOI] [Google Scholar]
- Cromer D. T., Mann J. B. 1967. Compton scattering factors for spherically symmetric free atoms. J. Chem. Phys. 47, 1892–1893. ( 10.1063/1.1712213) [DOI] [Google Scholar]
- Cromer D.T., Waber J. T. 1965. Scattering factors computed from relativisitic dirac-slater wave functions. Acta Cryst. 18, 104–109. ( 10.1107/S0365110X6500018X) [DOI] [Google Scholar]
- Diamond R. 1974. Real-space refinement of the structure of hen egg-white lysozyme. J. Mol. Biol. 82, 371–391. ( 10.1016/0022-2836(74)90598-1) [DOI] [PubMed] [Google Scholar]
- Doster W., Gebhardt R. 2003. High pressure unfolding of myoglobin studied by dynamic neutron scattering. Chem. Phys. 292, 383–387. ( 10.1016/S0301-0104(03)00064-8) [DOI] [Google Scholar]
- Floriano B. W., Nascimento M. A. C. 2004. Dielectric constant and density of water as a function of pressure at constant temperature. Braz. J. Phys. 34, 38–41. ( 10.1590/S0103-97332004000100006) [DOI] [Google Scholar]
- Fourme R., Kahn R., Mezouar M., Girard E., Hoerentrup C., Prange T., Ascone I. 2001. Experimental aspects of biological X-ray absorption spectroscopy. J. Synchrotron. Rad. 8, 1149–1156. ( 10.1107/S0909049501011037) [DOI] [PubMed] [Google Scholar]
- Fraser R. D. B., MacRae T. P., Suzuki E. 1978. An improved method for calculating the contribution of solvent to the X-ray diffraction pattern of biological molecules. J. Appl. Crystallogr. 11, 693–694. ( 10.1107/S0021889878014296) [DOI] [Google Scholar]
- Frauenfelder H., Alberding N. A., Ansari A., Braunstein D., Cowen B. R., Hong M. K., Iben I. E. T., Johnson J. B., Luck S. 1990. Proteins and pressure. J. Phys. Chem. 94, 1024–1037. ( 10.1021/j100366a002) [DOI] [Google Scholar]
- Fuentes E. J., Wand A. J. 1998. Local stability and dynamics of apocytochrome b562 examined by the dependence of hydrogen exchange on hydrostatic pressure. Biochemistry 37, 9877–9883. ( 10.1021/bi9808940) [DOI] [PubMed] [Google Scholar]
- Glatter O. 2002. Fourier transformation and deconvolution. In Neutron, x-rays and light scattering methods applied to soft condensed matter (eds Lindner P., Zemb T.), pp. 103–124. Amsterdam, The Netherlands: North-Holland. [Google Scholar]
- Gottschalk M., Halle B. 2003. Self-association of lysozyme as seen by magnetic relaxation dispersion. J. Phys. Chem. B 107, 7914–7922. ( 10.1021/jp034527k) [DOI] [Google Scholar]
- Grishaev A., Wu J., Trewhella J., Bax A. 2005. Refinement of multidomain protein structures by combination of solution small-angle X-ray scattering and NMR data. J. Am. Chem. Soc. 127, 16 621–16 628. ( 10.1021/ja054342m) [DOI] [PubMed] [Google Scholar]
- Gross M., Jaenicke R. 1994. Proteins under pressure. Eur. J. Biochem. 221, 617–630. ( 10.1111/j.1432-1033.1994.tb1877.x) [DOI] [PubMed] [Google Scholar]
- Gross M., Auerbach G., Jaenicke R. M. 1993. The catalytic activities of monomeric enzymes show complex pressure dependence. FEBS Lett. 321, 256–260. (doi:1016/0014-5793(93)80120-J) [DOI] [PubMed] [Google Scholar]
- Gruner S. M. 2004. High-pressure crystallography. Amsterdam, The Netherlands: Kluwer. [Google Scholar]
- Hammersley A. P. 2004. Fit2d. See http://www.esrf.eu/computing/scientific/FIT2D/.
- Hayward A. T. J. 1967. Compressibility equations for liquids: a comparative study. Brit. J. Appl. Phys. 18, 965–977. ( 10.1088/0508-3443/18/7/312) [DOI] [Google Scholar]
- Heremans K. 1997. High-pressure research in the bioscience and biotechnology. Leuven, Belgium: Leuven University Press. [Google Scholar]
- Heremans K., Smeller L. 1998. Protein structure, dynamics at high pressure. Biochim. Biophys. Acta 1386, 353–370. [DOI] [PubMed] [Google Scholar]
- Jackson C. J., Carr P. D., Kim H. K., Liu J. W., Herrald P., Mitić N., Schenk G., Smith C. A., Ollis D. L. 2006. Anomalous scattering analysis of agrobacterium radiobacter phosphotriesterase: the prominent role of iron in the heterobinuclear active site. Biochem. J. 397, 501–508. ( 10.1042/BJ20060276) [DOI] [PMC free article] [PubMed] [Google Scholar]
- Katrusiak A., Dauter Z. 1996. Compressibility of lysozyme protein crystals by X-ray diffraction. Acta Cryst. D52, 607–608. ( 10.1107/S0907444996000431) [DOI] [PubMed] [Google Scholar]
- Kauzmann W. 1987. Thermodynamics of unfolding. Nature 325, 763–764. ( 10.1038/325763a0) [DOI] [Google Scholar]
- Kratky O., Pilz I., Glatter O. 1979. Small-angle X-ray scattering. Methods Enzymol. 61, 148–249. ( 10.1016/0076-6879(79)61013-3) [DOI] [PubMed] [Google Scholar]
- Kundrot C. E., Richards F. M. 1987. Crystal structure of hen egg-white lysozyme at a hydrostatic pressure of 1000 atmospheres. J. Mol. Biol. 193, 157–170. ( 10.1016/0022-2836(87)90634-6) [DOI] [PubMed] [Google Scholar]
- Kunugi S., Tanaka N. 2002. Cold denaturation of proteins under high pressure. Biochim. Biophys. Acta 1595, 329–344. [DOI] [PubMed] [Google Scholar]
- Likhachev E. R. 2003. Effects of high hydrostatic pressure on living cells: a consequence of the properties of macromolecules and macromolecule-associated water. Tech. Phys. 48, 514–515. ( 10.1134/1.1568496) [DOI] [PubMed] [Google Scholar]
- Macdonald J. R. 1969. Review of some experimental and analytical equations of state. Rev. Mod. Phys. 41, 316–349. ( 10.1103/RevModphys.41.316) [DOI] [Google Scholar]
- Malfois M., Svergun D. I. 2002. Crydam, from atomic co-ordinates of macromolecules to scattering intensity. See http://nobugs.dl.ac.uk/presentations/Malfois/CRYDAM.pdf.
- Meinhold L., Smith J. C. 2005. Pressure-dependent transition in protein dynamics at about 4 kbar revealed by molecular dynamics simulation. Phys. Rev. E 72, 061 908 ( 10.1103/physRevE.72.061908) [DOI] [PubMed] [Google Scholar]
- Meinhold L., Smith J., Jeremy C., Kitao A., Zewail A. H. 2007. Picosecond fluctuating protein energy landscape mapped by pressure–temperature molecular dynamics simulation. Proc. Natl Acad. Sci. USA 104, 17 261–17 265. ( 10.1073/pnas.0708199104) [DOI] [PMC free article] [PubMed] [Google Scholar]
- Mentre P., Hui Bon Hoa G. 2001. Dependence of water viscosity on temperature and pressure. Int. Rev. Cyt. 201, 1–84. ( 10.1016/S0074-7696(01)01001-4) [DOI] [PubMed] [Google Scholar]
- Merzel F., Smith J. C. 2002. Sasim: A method for calculating small angle scattering from explicit-atom models. Acta Cryst. D 58, 242–249. ( 10.1107/S0907444901019576) [DOI] [PubMed] [Google Scholar]
- Narayanan J., Liu X. Y. 2003. Protein interactions in undersaturated and supersaturated solutions: a study using light and X-ray scattering. Biophys. J. 84, 523–532. ( 10.1016/S0006-3495(03)74871-1) [DOI] [PMC free article] [PubMed] [Google Scholar]
- Neilson G. W., Paget D. I., Howells W. S. 1979. A neutron diffraction study of the structure of heavy water at pressure using a new high-pressure cell. J. Phys. D Appl. Phys. 12, 901–907. ( 10.1088/0022-3727/12/6/013) [DOI] [Google Scholar]
- Olczak A., Cianci M., Hao Q., Rizkallah P. J., Rafteryd J., Helliwell J. R. 2003. S-swat (softer single-wavelength anomalous technique): potential in high-throughput protein crystallography. Acta Cryst. A59 327–334. ( 10.1107/S0108767303009693) [DOI] [PubMed] [Google Scholar]
- Oleinikova A., Smolin N., Brovchenko I. 2006. Origin of the dynamic transition upon pressurization of crystalline proteins. J. Phys. Chem. B 110, 19 619–19 624. ( 10.1021/jp0629590) [DOI] [PubMed] [Google Scholar]
- Ollivier J., Plazanet M., Schober H., Cook J. C. 2004. First results with the upgraded in5 disk chopper cold time-of-flight spectrometer. Phys. B 350, 173–177. ( 10.1011/jphysb.2004.04.022) [DOI] [Google Scholar]
- Ortore M. G., Spinozzi F., Carsughi C., Mariani P., Bonetti M., Onori G. 2005. High pressure small-angle neutron scattering study of the aggregation state of β-lactoglobulin in water and water/ethylene glycol solutions. Chem. Phys. Lett. 418, 338–342. ( 10.1021/jp7115440) [DOI] [Google Scholar]
- Ortore M. G., Sinibaldi R., Spinozzi F., Carsughi F., Clemens D., Bonincontro A., Mariani P. 2008. New insights into urea action on proteins: a sans study of the lysozyme case. J. Phys. Chem. B 112, 12 881–12 887. [DOI] [PubMed] [Google Scholar]
- Pantoja-Uceda D., Shewry P. R., Bruix M., Tatham A. S., Santoro J., Rico M. 2004. Solution structure of a methionine-rich 2s albumin from sunflower seeds: relationship to its allergenic and emulsifying properties. Biochemistry 43, 6976–6986. ( 10.1021/bi0496900) [DOI] [PubMed] [Google Scholar]
- Pressl K., Kriechbaum M., Steinhart M., Laggner P. 1997. High pressure cell for small- and wide-angle X-ray scattering. Rev. Sci. Instrum. 68, 4588–4592. ( 10.1063/1.1148436) [DOI] [Google Scholar]
- Puxkandl R., Zizak I., Paris O., Keckes J., Tesch W., Bernstorff S., Purslow P., Fratzl P. 2002. Viscoelastic properties of collagen: synchrotron radiation investigations and structural model. Phil. Trans. R. Soc. Lond. B 357, 191–197. ( 10.1098/rstb.2001.1033) [DOI] [PMC free article] [PubMed] [Google Scholar]
- Refaee M., Tezuka T., Akasaka K., Williamson M. P. 2003. Pressure-dependent changes in the solution structure of hen egg-white lysozyme. J. Mol. Biol. 327, 857–865. ( 10.1016/S0022-2836(03)00209-2) [DOI] [PubMed] [Google Scholar]
- Richard D., Ferrand M., Kearley G. J. 2003. Lamp. See http://www.ill.eu/computing/cs-software/
- Russo D., Perez J., Zanotti J. M., Durand D. 2002. Dynamic transition associated with the thermal denaturation of a small beta protein. Biophys. J. 83, 2792–2800. ( 10.1016/S0006-3495(02)75288-0) [DOI] [PMC free article] [PubMed] [Google Scholar]
- Russo D., Hura G. L., Copley J. R. D. 2007. Effects of hydration water on protein methyl group dynamics in solution. Phys. Rev. E 75, 040 902. ( 10.1103/physRevE.75.040902) [DOI] [PubMed] [Google Scholar]
- Russo D., Teixeira J., Ollivier J. 2009. The impact of hydration water on the dynamics of side chains of hydrophobic peptides from dry powder to solutions. J. Chem. Phys. 130, 235 101 ( 10.1063/1.3154383) [DOI] [PubMed] [Google Scholar]
- Silva J. L., Foguel D., Royer C. A. 2001. Pressure provides new insights into protein folding, dynamics and structure. Trends Biochem. Sci. 260, 612–618. ( 10.1016/S0968-0004(01)01949-1) [DOI] [PubMed] [Google Scholar]
- Sinibaldi R., Ortore M. G., Spinozzi F., Carsughi F., Frielinghaus H., Cinelli S., Onori G., Mariani P. 2007. Preferential hydration of lysozyme in water/glycerol mixtures: a small angle neutron scattering study. J. Chem. Phys. 126, 235 101 ( 10.1063/1.2735620) [DOI] [PubMed] [Google Scholar]
- Smeller L. 2002. Pressure–temperature phase diagrams of biomolecules. Biochim. Biophys. Acta 1595, 11–29. [DOI] [PubMed] [Google Scholar]
- Spinozzi F., Carsughi F., Mariani P. 1998. Particle shape reconstruction by small-angle scattering. Integration of group theory and maximum entropy to multipole expansion method. J. Chem. Phys. 109, 10 148–10 158. ( 10.1063/1.477708) [DOI] [Google Scholar]
- Spinozzi F., Gazzillo D., Giacometti A., Mariani P., Carsughi F. 2002. Interaction of proteins in solution from small angle scattering: a perturbative approach. Biophys. J. 82, 2165–2175. ( 10.1016/S0006-3495(02)75563-x) [DOI] [PMC free article] [PubMed] [Google Scholar]
- Spinozzi F., Carsughi F., Mariani P., Saturni L., Bernstorff S., Cinelli S., Onori G. 2007. Met-myoglobin association in dilute solution during pressure-induced denaturation: an analysis at pH 4.5 by high-pressure small-angle X-ray scattering. J. Phys. Chem. B 111, 3822–3830. ( 10.1021/jp063427m) [DOI] [PubMed] [Google Scholar]
- Spinozzi F., Ortore M.G., Sinibaldi R., Mariani P., Esposito A., Cinelli S., Onori G. 2008. Microcalorimetric study of thermal unfolding of lysozyme in water/glycerol mixtures: an analysis by solvent exchange model. J. Chem. Phys. 129, 35 101–35 109. ( 10.1063/1.2945303) [DOI] [PubMed] [Google Scholar]
- Spinozzi F., Carbini A., Ortore M. G., Mariani P. 2009. Sasmol. See http://alisf1.univpm.it/biophysics/software.htm.
- Striolo A., Favaro A., Elvassore N., Bertucco A., Di Noto V. 2003. Evidence of conformational changes for protein films exposed to high-pressure Co2 by ft-ir spectroscopy. J. Sup. Fluids 27, 283–295. ( 10.1016/S0896-8446(02)00244-9) [DOI] [Google Scholar]
- Stuhrmann H. B. 2004. Unique aspects of neutron scattering for the study of biological systems. Rep. Prog. Phys. 67, 1073–1115. ( 10.1088/0034-4885/67/7/R02) [DOI] [Google Scholar]
- Stuhrmann H. B. 2008. Small-angle scattering and its interplay with crystallography, contrast variation in saxs and sans. Acta Cryst. A64 181–191. ( 10.1107/S0108767307046569) [DOI] [PubMed] [Google Scholar]
- Svergun D., Barberato C., Koch M. H. J. 1995. Crysol—a program to evaluate X-ray solution scattering of biological macromolecules from atomic coordinates. J. Appl. Cryst. 28, 768–773. ( 10.1107/S0021889895007047) [DOI] [Google Scholar]
- Svergun D., Richard S., Koch M. H. J., Sayers Z., Kuprin S., Zaccai G. 1998a. Protein hydration in solution: experimental observation by X-ray, neutron scattering. Proc. Natl Acad. Sci. USA 95, 2267–2272. ( 10.1073/pnas.95.5.2267) [DOI] [PMC free article] [PubMed] [Google Scholar]
- Svergun D., Richard S., Koch M. H. J., Sayers Z., Kuprin S., Zaccai G. 1998b. Protein hydration in solution: experimental observation by X-ray, neutron scattering. Proc. Natl Acad. Sci. USA 95, 2267–2272. ( 10.1073/pnas.95.5.2267) [DOI] [PMC free article] [PubMed] [Google Scholar]
- Taulier N., Chalikian T. V. 2003. Volumetric effects of ionization of amino and carboxyl termini of α, ω-aminocarboxylic acids. Biophys. Chem. 104, 21–36. ( 10.1016/S0301-4622(02)00325-3) [DOI] [PubMed] [Google Scholar]
- Weber G. 1992. Effects of temperature and pressure on molecular associations and on single peptide chain proteins. Protein interactions, pp 199–215. London, UK: Chapman and Hall. [Google Scholar]
- Weber G., Drickamer H. G. 1983. The effect of high pressure upon proteins and other biomolecules. Q. Rev. Biophys. 16, 89–112. ( 10.1017/S0033583500004935) [DOI] [PubMed] [Google Scholar]
- Zanotti J. M., Bellissent-Funel C. M., Parello J. 1997. Dynamics of a globular protein as studied by neutron scattering and solid-state nmr. Phys. B 234, 228–230. ( 10.1016/S0921-4526(96)00921-0) [DOI] [Google Scholar]
- Zipp A., Kauzmann W. 1973. Pressure denaturation of metmyoglobin. Biochemistry 12, 4217–4228. ( 10.1021/bi00745a028) [DOI] [PubMed] [Google Scholar]