Abstract
Three-dimensional microwave tomography represents a potentially very important advance over 2D techniques because it eliminates associated approximations which may lead to more accurate images. However, with the significant increase in problem size, computational efficiency is critical to making 3D microwave imaging viable in practice. In this paper, we present two 3D image reconstruction methods utilizing 3D scalar and vector field modeling strategies, respectively. Finite element (FE) and finite-difference time-domain (FDTD) algorithms are used to model the electromagnetic field interactions in human tissue in 3D. Image reconstruction techniques previously developed for the 2D problem, such as the dual-mesh scheme, iterative block solver, and adjoint Jacobian method are extended directly to 3D reconstructions. Speed improvements achieved by setting an initial field distribution and utilizing an alternating-direction implicit (ADI) FDTD are explored for 3D vector field modeling. The proposed algorithms are tested with simulated data and correctly recovered the position, size and electrical properties of the target. The adjoint formulation and the FDTD method utilizing initial field estimates are found to be significantly more effective in reducing the computation time. Finally, these results also demonstrate that cross-plane measurements are critical for reconstructing 3D profiles of the target.
Index Terms: Adjoint method, alternating-direction implicit finite-difference time-domain (ADI-FDTD), finite-difference time-domain (FDTD), microwave tomography
I. Introduction
The electrical properties of normal and cancerous tissues are significantly different across microwave frequencies [1]–[3]. To exploit this apparent contrast, substantial effort has been invested in the development of microwave imaging [4]–[8]. Compared to traditional X-rays, microwave energy is advantageous in several important respects, for example, it does not involve ionization, its associated imaging hardware is relatively low in cost and its absorption and scattering is altered by physiological processes of interest in tissue. These features make microwave methods an intriguing medical imaging option for situations where frequent scanning is required, such as in breast cancer screening or therapeutic monitoring. Within the microwave imaging arena, frequency-domain based tomography approaches [4]–[7] have been investigated along with time-domain techniques based on synthetic aperture radar [8]–[10] for breast cancer detection.
In physical realizations of microwave imaging systems, the fields radiate into 3D space. Nonetheless, initial image reconstruction techniques reported in the literature were largely developed for 2D cases in order to achieve higher computational resolution at reasonable compute speeds and to reduce the amount of measurement data required [9], [11]–[14]. Approximations are necessary in order to utilize 2D methods, such as the tissues of interest being cylindrical in structure, and in most instances, the fields being confined to the transverse-magnetic (TM) mode. Because of these assumptions, the recovered 2D images often exhibit artifacts or distortions directly related to the approximations [15]. With the advent of increased computational power (including parallel computing using graphical processing units [16]–[18]) along with various algorithmic improvements (such as the adjoint approach [19]), 3D image reconstruction with clinically relevant spatial resolution and commensurate computational field and tissue property sampling is now within reach [20], [21].
In parallel to advances in image reconstruction, 3D microwave data acquisition systems have been developed by several research groups. A preliminary study of whole body imaging of a canine conducted by Semenov et al. [22] demonstrated, to a limited degree, the feasibility of 3D microwave tomography. However, both the data acquisition and image reconstruction times were unsatisfactory for realistic utility. More recently, a 3D scanning microwave imaging system reported by Yu et al. [23] has demonstrated respectable spatial localization for a simple target; however, the recovered microwave property contrast was relatively low.
These algorithm and hardware advances set the stage for practical 3D microwave tomography. In this paper, we concentrate our efforts on applying computational innovations to accelerate the field solution as the forward modeling problem appears to be the bottleneck for accurate image reconstructions in 3D. We also explore the image quality improvements attained by adding cross-plane measurement data to co-planar transceiving antenna array configurations. Two 3D image reconstruction methods are evaluated based on 3D scalar and vector field models, respectively. Our previously published 2D [11], [19] and quasi-3D hybrid methods [24] along with the new 3D approaches outlined in this paper represent a spectrum of algorithms with increasing levels of complexity which have enabled us to explore trade-offs between model accuracy and computational efficiency. Several strategies developed for 2D reconstructions have been improved and incorporated into the new 3D algorithms including an iterative block solver [25] and an adjoint method for constructing the Jacobian matrix [24]. For the 3D vector field method, an optimized FDTD algorithm with a uniaxial perfectly matched layer (UPML) technique [26] has been developed to obtain more accurate forward models within an acceptable computational time. These algorithms were tested with simulated data and evaluated in terms of their computational efficiency and accuracy relative to previously developed methods. Four antenna array configurations that return combinations of in- and cross-plane field data were considered and the cross-plane measurements were found to be critical for recovering the 3D profiles of embedded heterogeneities.
The paper includes a computational methods section (Section II) which describes the formulations of the two 3D reconstruction algorithms—(1) the FE-based 3D scalar forward/3D inverse reconstruction (scalar-3D) and (2) the FDTD-based 3D vector forward/ 3D inverse reconstruction (vector-3D). Key elements, such as the 3D dual-mesh, the nodal adjoint method and optimization of the 3D vector field solver, are discussed in detail and algorithmic options are evaluated from a computational complexity perspective. The results section (Section III) contains reconstructions from synthetic data which evaluate the performance of the 3D algorithms with respect to our existing 2D methods. In particular, a parametric study of 4 imaging array configurations is presented and the computational costs experienced in practice across the suite of imaging algorithms is reported. We conclude the paper with a summary discussion in Section IV.
II. Computational Methods
The 3D reconstruction algorithms described in this paper exploit non-linear optimization based on a regularized Gauss-Newton method [27] and dual-mesh scheme [28]. We first present the dual-mesh configurations for the 3D scalar-field and vector-field reconstructions. A nodal adjoint method is subsequently derived in general form as a fast approximation to the original adjoint approach [24], which can be used not only in the two 3D algorithms presented in this paper, but also in the 2D and semi-3D methods described previously [11], [19], [24]. This development is followed by a brief discussion of the computational efficiency of the 3D FDTD algorithm. In the last subsection, enhanced finite-difference time-domain (FDTD) methods utilizing an alternating-direction implicit (ADI) update scheme and additional accelerations afforded by incorporating initial field distributions are discussed, and their overall efficiency improvements are compared.
A. 3D Dual-Mesh
The dual-mesh scheme is a simple and flexible approach to control the problem sizes of the forward and inverse computations comprising the image reconstruction by utilizing independent discretizations of the field and parameter representations [28]. In terms of the imaging system configuration at Dartmouth [6], the dual-meshes associated with the scalar-3D and the vector-3D methods are illustrated in Fig. 1(a) and (b). The forward (field) mesh for the scalar-3D method consists of a cylindrical domain (tetrahedrons) concentrically aligned with a circular monopole antenna array that extends radially beyond the antennas. The field mesh for the 3D vector reconstruction is a cubic-shaped 3D Yee-lattice [29] surrounded by several layers of UPML cells. The reconstruction (parameter) grids for both methods are identical in this instance, consisting of a 3D cylindrical domain centered within both the antenna array and the respective field meshes. The field and parameter meshes can be constructed with different and variable nodal densities. For a given target, the bilateral mappings between the field and parameter meshes can be precomputed and stored resulting in minimal increases in computational costs.
Fig. 1.
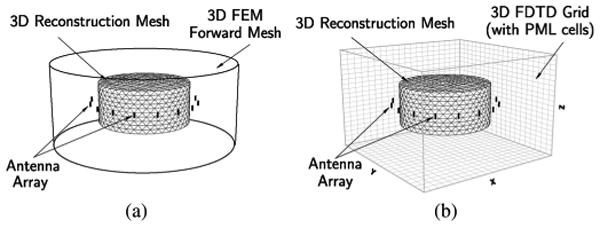
Forward and reconstruction mesh orientations for (a) the scalar-3D and (b) the vector-3D methods.
B. Nodal Adjoint Method
The adjoint method for Gauss-Newton parameter estimation is critical to achieving computational time reduction relative to the traditional sensitivity equation approach [30]. The Jacobian matrix for the dual-mesh configuration using the adjoint formulation [24] can be written in terms of a summation over field mesh elements
| (1) |
where (s, r) represents the measurement index between the sth source and rth detector; Ωτ denotes the region within which the basis function of the τth parameter node is non-zero, Σe∈Ωτ indicates summation over the field mesh elements which are located within Ωτ. is a square matrix with each coefficient defined by
| (2) |
where ϕ and φ are the basis functions over the field and parameter mesh elements, respectively, ie = 1, 2, ⋯, M and le = 1, 2, ⋯, M are the local node indices and M is the total node number for a single field mesh element (for linear elements, M = 3 in 2D and 4 in 3D). Ωe is the spatial domain occupied by the eth mesh element and r⃗ is a 3D position vector. and are the fields at the vertices, , of the selected mesh element due to source antennas at s and r, respectively. Equation (1) is referred to as the element-based form of the adjoint formula.
For cases where the boundaries of the field mesh elements do not precisely match those of the parameter mesh elements, the evaluation of (2) becomes more difficult because it involves integrations over partial elements of the field mesh. A nodal adjoint method is introduced to simplify the integration for a given dual-mesh pair under the assumption that the average size of the field mesh elements is significantly smaller than that of the parameter mesh elements (discussed at the end of the subsection).
Within domain Ωe where e ∈ Ωτ, the parameter basis function φτ can be expanded as a linear combination of the field basis functions
| (3) |
Inserting (3) into (1), yields
| (4) |
where is an M × M matrix defined as
| (5) |
and 〈•〉 denotes volume integration over Ωe. Note that the nonzero off-diagonal elements in result in cross-multiplication terms of the fields at different nodes when expanding (4). To simplify the evaluation of (4), the weighting matrix, , is approximated by summing each column (or row) and adding the off-diagonal elements to the diagonal while simultaneously zeroing the off-diagonal terms such that
| (6) |
It is not difficult to prove that
| (7) |
where , Ve is the volume of the eth field element (in 2D, Ve is the area of the element) and I is an M × M identity matrix. The weighting matrix Wτ can be further approximated by W̃τ = (M + 1)diag({φτ(p⃗κ)}κ). By substituting W̃τ back into (7) and then (4), the reorganized equation can be written as
| (8) |
where Σn∈Ωτ indicates summation over the field mesh nodes which fall inside Ωτ and Σe∈Ωn signifies summation over the field mesh elements that share the nth node. The term (Σe∈Ωn Ve/M) is a scalar expression associated with the nth node which can be symbolized as Vn, and referred to as the effective volume of node n. The nodal adjoint formula (8) allows the Jacobian matrix to be easily computed: Es(p⃗n) and Er(p⃗n) are the nodal electrical field values obtained directly from the field problem; Vn and φτ(p⃗n) require only simple algebraic operations and can be calculated on-the-fly. This is important for forward techniques which dynamically generate their meshes, such as FDTD and some adaptive methods [31]. Note that the reconfiguration of the weighting matrix is only valid when the field mesh elements are substantially smaller than the parameter mesh elements such that the field values at their nodal vertices are approximately equal.
To validate this derivation, we compute the Jacobian matrices using the nodal adjoint formula over a series of dual-meshes with different parameter/field element area ratios. The maximum relative error between the nodal adjoint and the true adjoint Jacobian is plotted as a function of the ratio of the averaged parameter and field element sizes (Fig. 2). From this plot, it is reasonable to conclude that when the forward element is small compared to the parameter element, the nodal adjoint Jacobian is a good approximation to an accurate Jacobian matrix (less than 2% difference for a 10:1 ratio in parameter to field element size).
Fig. 2.
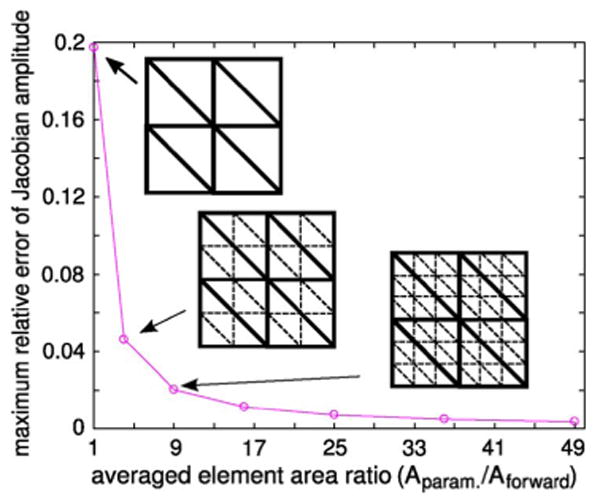
Plot of the maximum relative error of the nodal adjoint Jacobian as a function of parameter/field element area ratio. Sample parameter (solid lines) and field (dashed lines) mesh pairs are shown as insets.
Given the derivation above, the nodal adjoint formulation for the vector-3D method is straightforward. In the 3D FDTD grid, the effective volume Vn for all interior field nodes is identical, and is equal to the volume of a single voxel, i.e., Vn = ΔxΔyΔz. The nodal adjoint formula in this case is correspondingly written as
| (9) |
C. Computational Complexity Comparison
In this subsection, the computational complexity of the 3D FDTD and 3D FE methods are compared by summing the total floating-point operations (FLOPs) for obtaining one field solution. The purpose of this comparison is to estimate how the computational complexity scales with increasing mesh densities and how the FE and FDTD methods perform in their generic forms. A uniform grid with Nx = Ny = Nz = N is used to assess both approaches (each cube in the FE mesh is split into 6 tetrahedral elements). The total node number for both meshes is N3. After assembling the FE matrix for the weak form of the simplified scalar model, the size of the matrix is N3 × N3. The minimum half-bandwidth for the finite element approach is N2 when numbering the nodes sequentially in each layer. If a boundary element matrix is incorporated to account for the far-field boundary conditions as in the hybrid method (FE/BE) [11], the minimum half-bandwidth increases to 6N2 which is essentially the total number of the boundary nodes. Solving this matrix equation with a Cholesky factorization algorithm [32], the total FLOP count for the FE/BE hybrid approach is 36N7 + 42N5 + 27N3 while that for the FE method with absorbing boundary conditions is N7 + 7N5 + 2N3 (here, we ignored the computations for assembling the FE/BE matrices).
With the strategy described in [19], the total FLOP count for obtaining a 3D FDTD steady-state solution can be decomposed into a two-term expression
| (10) |
where Fsteady is the number of time steps needed to reach steady state (Fsteady is estimated as the time-steps required for the radiated wave to travel round-trip through the domain since the background medium is highly lossy), and Fiter is the number of operations within a single time step. Fiter can be easily computed by counting the algebraic operations in the update equations for all E and H components which is approximately 84(N + 2NPML)3 using a UPML medium [33]. Assuming the mesh is isotropic, i.e. Δx = Δy = Δz = Δ, the Courant-Friedrichs-Lewy (CFL) number [34] is given by
| (11) |
If the wave speed in the background medium is cbk and the maximum wave speed among all inhomogeneities is cmax, the number of time steps required to reach steady state can be estimated as
| (12) |
Consequently, the total FLOP count for the 3D FDTD method (with UPML for lossy medium) is given by
| (13) |
A plot of the total FLOP counts for the two methods over a range of N is shown in Fig. 3 where , CFLN ≈ 1 and NPML = 5 are used in the calculations. From the graph, the 3D FDTD appears to be more efficient than the generic 3D FE method with increasing mesh sizes. Note that the implementation of iterative solvers can significantly reduce the computational expense associated with the FE or FE/BE field equations. In Section III, we tabulate the forward field computation time for a 3D FE method with an iterative solver and the 3D FDTD method.
Fig. 3.
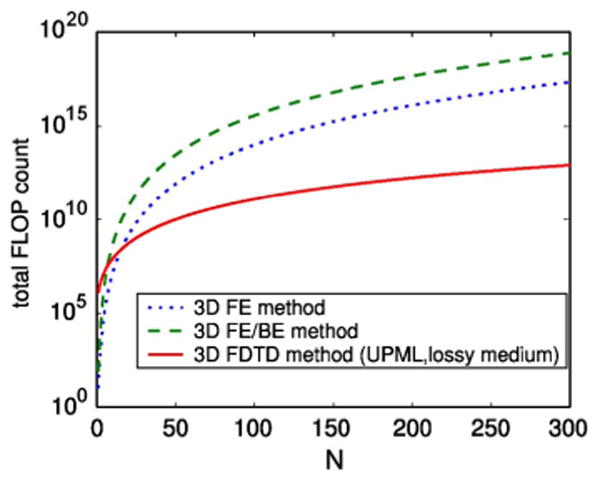
Comparison of the total floating-point operation counts between the 3D FE/BE and 3D FDTD methods for different mesh sizes.
D. Computational Acceleration for the 3D FDTD Vector Field
From the FLOP count analysis in Section II-C, the total FLOP number for the FDTD method is proportional to the number of time steps required to reach steady-state. We have found that the steady-state time step number Fsteady is related to the initial field distribution: if the FDTD time-stepping starts from a null field distribution (i.e. all components are zero), it takes considerably longer to reach steady state than from a field distribution that resembles the final solution.
A simple 2D forward problem is computed to illustrate this finding. A 2.5 cm × 2.5 cm square dielectric object is located at the center of the antenna array, where the object properties are εr = 10 and σ = 0.5 S/m and those of the background are 25 and 1.0 S/m, respectively. Utilizing polar coordinates, and the transmitter operating at f = 900 MHz and located at (r = 7.6 cm, θ = 0°), the amplitudes of the receivers at θ = 90° and θ = 180° are recorded and plotted versus the number of time steps in Fig. 4 in comparison to the responses computed from the initial values of a similar field distribution, i.e. previously computed fields due to the presence of a similarly sized object that has εr = 12, σ = 0.7 S/m. In both cases, the time step Δt is set to 1.64 × 10⁻¹¹ s to ensure stability. From the plot, it is evident that the second approach leads to significantly fewer time steps to achieve steady-state. The sharp oscillations in the solid lines are referred to as “spurious modes” induced by the jump in dielectric properties.
Fig. 4.
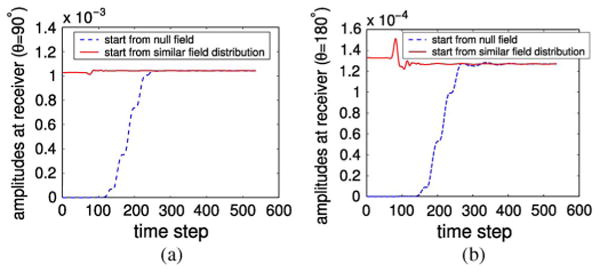
Amplitudes at different time-steps for receivers located at (a) θ = 90° and (b) θ = 180°.
To exploit this result, we have derived an iterative FDTD approach which utilizes the field distributions from the previous parameter estimate iteration to reduce the field modeling time. Implementation of this scheme is straightforward. Extra memory is required to store all field components and the accumulated elapsed time at the end of each iteration for each source. At the subsequent iteration, the fields are initialized by the stored values from the previous iteration of the corresponding source and continues the FDTD time-stepping. We demonstrate in Section III-A that it is possible to reduce the steady-state time step number by 1/2 to 2/3 by supplying initial field estimates which do not compromise either convergence or image quality.
One must be careful when selecting the time step, Δt, which must be a fixed number in this situation to avoid spurious waves. As a result, we can not determine the optimal Δt based on the CFL condition per iteration, rather, a minimum permittivity, εmin, should be estimated, and then a uniform Δt determined for all iterations from (11). Overall, the acceleration provided by using an initial field distribution makes the iterative FDTD approach significantly faster.
E. ADI FDTD With Lossy UPML
As discussed above, a constant time-step in the iterative FDTD scheme may result in some computational redundancy during the first few iterations. To avoid this, we implemented an unconditionally stable FDTD scheme, the alternating direction implicit (ADI) FDTD method, for forward field modeling of lossy media.
In the update equations of the ADI FDTD method, the target time step fields appear on both sides of the update equation; thus, this method yields an implicit difference update scheme. Based on this principle, the ADI form of the UPML update equation for a lossy medium is not difficult to derive. We have used a symbolic software package, Mathematica, to perform the derivation and the full formulation can be found in Appendix A in [35].
With this ADI technique, the time step size Δt is not constrained by the CFL stability condition (11). Instead, the dispersion error becomes the limiting factor. A detailed study of the impact of the dispersion error from various Δt's in the ADI FDTD is given by Zhao [36]. The unconditional stability of the ADI FDTD allows for simultaneous use with the iterative FDTD field initialization approach introduced in the previous subsection.
To estimate the computational efficiency, the total FLOP count is calculated for this method. Assuming the 3D grid size is Nx = Ny = Nz = N, the floating-point operations per iteration for the ADI approach can be written as
| (14) |
where the number “2” results from the two sub-steps of the ADI FDTD, “177” is the FLOP count required to assemble the right-hand-side for the implicit update equation at each sub-step (optimized by Mathematica), “5” is the number of back substitutions needed to solve the system of tri-diagonal equations and “66” is related to the contributions from the remaining update equations. The total number of time steps required to reach steady-state for the ADI FDTD method can be written as
| (15) |
where Fsteady and CFLN are the steady time step and CFL number defined in (12) and (11), respectively. Combining (14) and (15), the total FLOP count for the ADI FDTD with lossy UPML ABC is
| (16) |
Based on (16) and (13), the CFL number for the ADI FDTD approach should be at least 6 times that used in the traditional FDTD in order to achieve faster computations.
III. Results and Discussion
In this section, we present image reconstructions from simulated data to assess the performance of the proposed methods under ideal conditions. The antenna array configurations were not chosen to produce optimal images in each case, but rather to examine the influences of different array perturbations. The computational efficiency of the algorithm enhancements, for example, when incorporating initial field estimates and the ADI FDTD, are studied with these simulations. Finally, five dual-mesh based algorithms are compared including the 2D, semi-3D and 3D methods, with benchmark reconstructions to profile their computational complexity with respect to increasing accuracy in the forward field modeling.
In order to perform fair comparisons across these approaches, we applied a set of common parameters for all experiments unless otherwise noted. For instance, the background medium was a 0.9% saline solution having εr = 77 and σ = 1.7 S/m at 900 MHz. The cylindrical reconstruction meshes for the two 3D methods were identical, comprised of 1660 nodes and 7808 tetrahedral elements. In this case, the origin of the Cartesian coordinate system was located at the center of the reconstruction mesh with the z-axis aligned along the cylinder. A circular antenna array located on a radius r = 7.62 cm and comprised of 16 equally spaced antennas was placed in the central x − y plane. Each antenna in the array was modelled as an infinitely small z-oriented dipole. For cases where multiple layers of antennas were used, schematic diagrams are provided to illustrate the positions of the array elements. For each iteration of the Gauss-Newton reconstruction, a Tikhonov regularization was imposed with the regularization parameter computed by the empirical method discussed in [37]. All reconstructions commenced from an initial property parameter estimate equal to the homogeneous background medium.
A. Measurement Configuration Study
The imaging target was a sphere (εr = 20, σ = 0.5 S/m) with center location (x = 0.0 cm, y = −2.5 cm, z = 0.0 cm) and radius r = 2 cm. For the scalar-3D reconstructions, the field mesh was a cylinder consisting of 56,636 nodes and 312,453 tetrahedral elements. It had a radius r = 12 cm and extended vertically from z = −5 cm to z = 5 cm. For the vector-3D reconstructions, the interior grid was comprised of 70 × 70 × 35 nodes (in the x, y and z directions, respectively) and was surrounded by 5 layers of a UPML (the final node size of the data array was 80 × 80 × 45). The FDTD cells were cubes with a uniform node spacing of Δx = Δy = Δz = 2.47 mm. The simulated measurement data was generated using an FDTD 3D vector solution over a much finer field mesh (40 nodes per wavelength with respect to the background medium compared with 15 nodes per wavelength in the reconstruction problem) and the Ez components were extracted at the receiver sites.
Four antenna array configurations (Fig. 5) were investigated. For scheme A, all antennas resided in the x − y plane. Data was collected at the nine antenna sites opposing each transmitter for the total of 16 antennas (16 transmitters by 9 receivers). In schemes B and C, the antennas resided in two planes 1.5 cm above and below the central x − y plane and signals were transmitted from all 32 antennas. In scheme C, the signals were received by the 18 opposing antennas (nine in each plane), while for scheme B, the signals were only received by the opposing nine antennas in the same plane as the transmitters. The amount of measurement data for schemes B and C was 288 (32 transmitters by 9 receivers) and 576 (32 transmitters by 18 receivers), respectively. For scheme D, the antennas resided in 3 planes, one in the central x − y plane and two 1.5 cm above and below it, respectively. Signals were transmitted only by antennas in the central plane and received at the 27 opposing antennas for a total of 432 pieces of measurement data (16 transmitters by 27 receivers). The reconstructed 3D dielectric profiles for both scalar (scheme A only) and vector methods are shown in Fig. 6. Because the x − y cross-sectional images are less effected by the antenna array configurations evaluated here, we only include sample x − y cross-sectional images in Fig. 6 and omit them for the rest of the results.
Fig. 5.
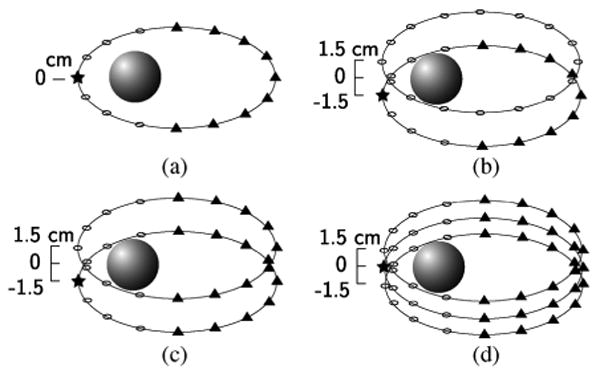
Source configurations for 3D simulated reconstructions: (a) scheme A, (b) scheme B, (c) scheme C, and (d) scheme D. In each diagram, the star represents a transmitter and the triangles represent the corresponding receivers for that specific transmitter (Open circles represent non-receiving antennas for that transmitter).
Fig. 6.
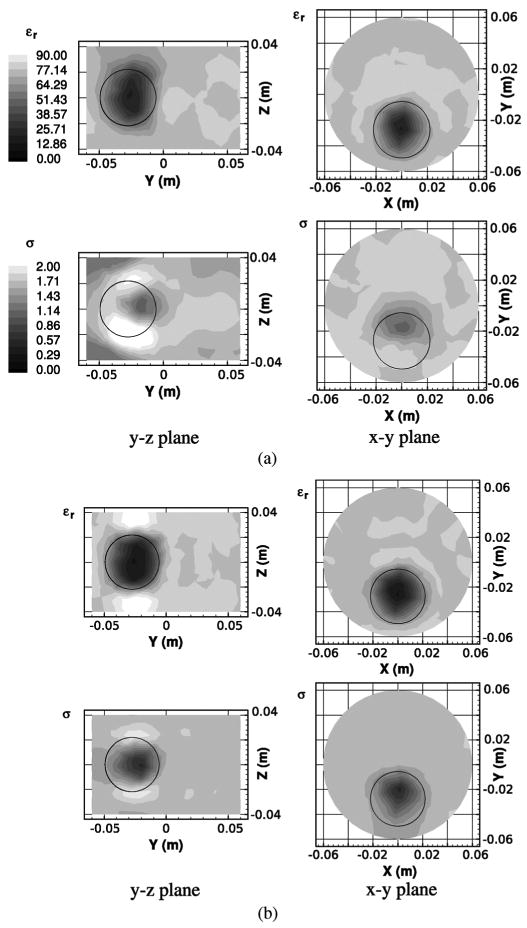
Cross-sectional relative permittivity (top row) and conductivity (bottom row) images of the reconstructed dielectric profiles using the scheme A antenna configuration (scalar-3D algorithm) for the (a) scalar-3D and (b) vector-3D algorithms. Circles show the exact location of the embedded heterogeneity in each cross-section.
Several important observations can be made here as follows.
The permittivity images have fewer artifacts than their conductivity counterparts, similarly to that observed in [24].
The images reconstructed utilizing the scheme A antenna configuration from both the scalar (scalar-3D) and vector-3D methods have pronounced artifacts above and below the recovered object, particularly in the conductivity images. However, the vector-3D algorithm artifacts are noticeably reduced and the estimated object position appears to be more accurate in both the horizontal and vertical planes.
The permittivity contours for the single-layer receiving array (scheme B) are relatively accurate in the plane where the array is located. However, artifacts occur above and below the object making the permittivity appear elongated in the z-direction whereas the conductivity images contain elevated zones above and below the actual target location.
The images acquired from the two-layer [scheme C—Fig. 7(b)] and three-layer [scheme D—Fig. 7(c)] receiving antenna configurations recover the target very well in terms of its shape, location and dielectric properties. These results demonstrate that more measurements, especially out-of-plane and cross-plane data, improve the quality of the 3D reconstructions.
Although the number of measurements is doubled in scheme B compared with scheme A, the artifacts along the z-axis remain visible until the cross-plane measurements are included in Fig. 7(b) and (c).
Fig. 7.
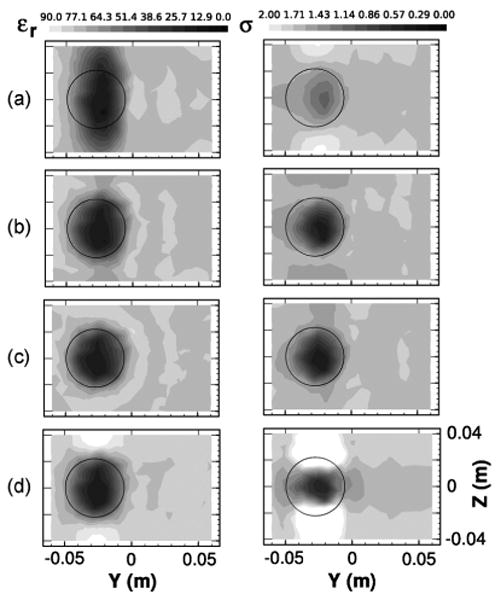
Vertical cross-sectional relative permittivity (left column) and conductivity (right column) images of the reconstructed dielectric profiles using the vector-3D algorithm and (a) scheme B, (b) scheme C, (c) scheme D and (d) scheme B with 2 cm separation.
In Fig. 7(d), we compressed scheme B antenna array spacing from 3 cm to 2 cm. The vertical plane images from the two cases are quite distinct. The target reconstructed from the data acquired with the 3 cm array spacing appears elongated in the permittivity images, whereas it is recovered with very nearly the correct size, location and property values when the 2 cm array is used but with pronounced elevated property zones above and below. The corresponding conductivity images exhibit elevated property artifacts above and below the target in both cases.
We also studied the impact of plane number on 3D image recovery for scheme A when the array was spaced in 1 cm increments by reconstructing the same target with the vector-3D algorithm utilizing three and five planes of data. Overall, a progression of image quality improvement occurs with an increase in the number of planes of data. It is interesting to note that the images from three planes of data which utilize cross-plane recordings [scheme D, Fig. 7(c)] are still better than five sets of in-plane measurements, especially with respect to the artifacts above and below the target.
B. Comparison Between Semi-3D and Scalar-3D Reconstructions
Additional numerical simulations were performed to compare semi 3D and scalar 3D reconstructions. In these experiments, a cylindrical reconstruction mesh was constructed by vertically (z-axis) extending a 2D horizontal circular mesh. Only the 2D profile is updated at each iteration in the semi-3D reconstruction, while the scalar-3D reconstruction calculates updates for all parameter nodes.
For the single array, we found the semi-3D reconstruction produced better results than the scalar-3D approach. The relative residual, the residual normalized by that of the first iteration, was reduced to 13% after 10 iterations compared with 23% for the latter case. This finding can be understood by the low axial sensitivity of the given source configuration and the degradation of the field solution accuracy in the scalar 3D model. However, for the two-plane arrays, opposite results were observed, i.e., the scalar-3D reconstruction reduced the relative residual to 16% which was 3 times lower than the residual (44%) for the semi-3D reconstruction. This indicates that the scalar-3D reconstruction is advantageous when the measurements support the recovery of 3D profiles. In this case, the improvements associated with better geometric modeling outperformed the approximations introduced by the 3D scalar field model.
C. Computation Time Improvements From Initial Field Estimation
Utilizing simulated data from scheme A, the computational time reduction achieved with the initial field estimation approach was investigated. We first set the minimum dielectric property value to 1/5th that of the background and used CLFN = 0.86 to compute the time step for all iterations. The values of all field vectors and the accumulated time-steps were recorded starting from the second iteration. Additionally, we reduced the steady-state time step number estimate from (12) by factors of 2 and 3. For these simulations, the reconstructed images (not shown) demonstrate no obvious degradation. The relative errors in these reduced computation time reconstructions are plotted in Fig. 8 as a function of iteration number compared with those from the unenhanced version which confirms the benefits of the technique.
Fig. 8.
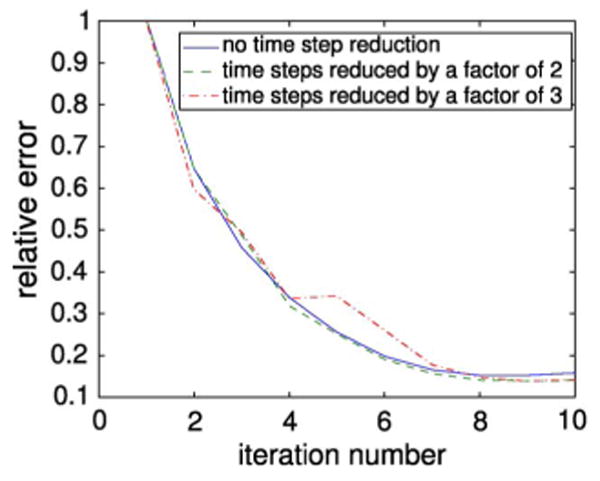
Relative error plot of the reconstructions with and without the initial field estimates.
D. Computational Cost for All Dual-Mesh Based Algorithms
Using the previous reconstructions as a benchmark, we tested five dual-mesh methods, i.e. the scalar-2D method [11], FDTD-2D method [19], semi-3D method [24], scalar-3D and vector-3D methods, and summarized the problem size and computational times in Table I. All computations were performed on an Alpha ES40 workstation with 4× 600 MHz CPUs. From the table, we observe predictable trends when the problem size increases and when the reconstruction transitions from 2D to 3D. Independently of the increasing levels of computational complexity, implementation of the iterative block solver and initial field estimates seems capable of maintaining the 3D model computation time to be within acceptable limits even for the full vector approach. The adjoint techniques also deserve special mention because of the significant computational time reductions which make all of these approaches viable.
TABLE I.
Comparisons Between Dual-Mesh Based Reconstructions
| Reconstruction scheme | scalar-2D† | scalar-2D | FDTD-2D | semi-3D | scalar-3D | vector-3D | vector-3D‡ |
|---|---|---|---|---|---|---|---|
| Forward solution method | FE/BE | FE/BE | 2D FDTD | 3D FE | 3D FE | 3D FDTD | 3D FDTD |
| Forward mesh (nodes) | 3,903 | 3,903 | 12,100 17,955* |
56,636 | 56,636 | 108,000 196,000* |
108,000 196,000* |
| Recon. mesh (nodes) | 556 | 556 | 473 | 126 | 1660 | 1660 | 1660 |
| Seconds per forward solution | 1.8 | 1.8 | 1(0.3**) | 5.5(13***) | 5.5(13) | 9(1-3**) | 5 |
| Seconds per inversion | 3660 | 16 | 2 | 0.5 | 4 | 4 | 4 |
sensitivity equation method used to construct the Jacobian matrix;
used the initial field acceleration technique (factor = 2);
total node number including those in the PML layers;
4 CPU's operating in parallel;
without multiple-RHS matrix solver.
Note: the forward field computation for vector-3D utilizes single precision floating-point operations, which is two times faster than using double-precision.
Not surprisingly, the 2D algorithms demonstrate substantial speed advantages over their 3D counterparts. For the 3D reconstructions, the scalar technique based on the FE method together with the iterative block solver provides an efficient approach for modeling 3D field distributions with the understanding that the underlying scalar model imposes various approximations (and concomitantly important limitations). The 3D FDTD algorithm used in the vector-3D method is promising because of 1) the accuracy in field modelling, 2) the advantages being able to exploit parallel computing and 3) the flexibility in accommodating various optimizations as discussed in Sections II-E and II-D. From columns 5–7 of Table I, it is evident that the 3D FDTD method can compute the full vector field solution within 9 seconds, which is less than twice that required for the scalar technique, even when utilizing a mesh that is three times larger for the field problem and computing the additional vector field components.
IV. Conclusion
We have developed two 3D image reconstruction approaches including a 3D scalar field/3D reconstruction technique based on the FE method and a 3D vector field/3D reconstruction algorithm based on the FDTD method. The adjoint scheme devised in [24] was extended to a nodal-based approximation which significantly simplified the Jacobian matrix calculation and also led to an associated reduction in computation time. Additional enhancements in the 3D FDTD algorithm with respect to the image reconstruction problem were investigated including the use of initial field estimates and the ADI FDTD method. Despite that both proposed methods are capable of modeling the scattering field of arbitrary 3D structures, utilizing the initial field estimates can achieve significant acceleration only when the background medium is lossy. Reconstructions were performed to validate the proposed algorithms utilizing synthetic data. In most cases, the target objects were successfully recovered in both location and dielectric property values with the permittivity images exhibiting fewer artifacts than their conductivity companions.
We compared this series of algorithms within the dual-mesh and iterative reconstruction framework. The 2D algorithms were superior in speed due to their considerably smaller problem size, while the 3D algorithms were generally superior in terms of image quality. Within the 2D methods, the 2D FDTD technique is promising and may facilitate quasi-real-time imaging applications because of its fast computation time. The 3D reconstructions are also promising and showed progressive improvements in terms of artifact reduction as the amount of measurement data was increased. The most significant improvement in image quality appeared to result from the use of cross-plane data in this regard. The investigations into these 3D image reconstruction algorithms are still preliminary and substantial work remains in order to make them viable in practice. At the same time, with the rapid increase in computing power, particularly with the availability of graphics processing unit-based (GPU) parallel computing, the use of vector field techniques such as the FDTD method becomes increasingly important for producing accurate field representations and consequently improved reconstructed image quality.
Acknowledgments
The authors would like to thank G. Zhu (McGill University, Canada) for the discussions on the nodal adjoint formulation.
This work was supported in part by the National Institutes of Health (NIH) through the National Cancer Institute under Grant P01-CA80139.
Biographies

Qianqian Fang (S'03–M'05) was born in Anyang, Henan, China, in 1976. He received the B.Eng. degree in electrical engineering from the University of Electronic Science and Technology of China (UESTC), Chengdu, and the Ph.D. degree in biomedical engineering from Thayer School of Engineering, Dartmouth College, Hanover, NH, in 2005.
From 1997 to 2000, he was a Research Assistant with the Microwave and Computational Electromagnetics Labs, UESTC, working with millimeter microwave switch and finite difference-time domain (FDTD) simulations for EM pulse well-logging. From 2000 to 2005, he was a Research Assistant in the Microwave Imaging Group at Dartmouth College, developing tomographic microwave imaging for breast cancer detection, particularly focusing on fast three-dimensional forward and reconstruction algorithms. From 2005 to 2009, he was a Postdoctoral Fellow at the Martinos Center for Biomedical Imaging, Massachusetts General Hospital (MGH), performing studies in near-infrared tomographic breast imaging and brain functional imaging. He is currently an Instructor at MGH and Harvard Medical School. His current research interests include multi-modality imaging, translational near-infrared breast cancer imaging, compression-induced tissue dynamics and massively parallel computing using graphics processing units (GPU) for medical imaging applications.

Paul M. Meaney (M'92) received A.B. degrees in computer science and electrical engineering from Brown University, Providence, RI, in 1982, the M.S. degree in electrical engineering from the University of Massachusetts, Boston, in 1985, and the Ph.D. degree in biomedical engineering from Dartmouth College, Hanover, NH, in 1995.
He was a Postdoctoral Fellow at Dartmouth College, from 1995 to 1996, and an NSF-NATO Postdoctoral Fellow at the Royal Marsden Hospital in Sutton, U.K., from 1996 to 1997. He is currently a Research Professor at Dartmouth College. His interests include developing microwave imaging for biomedical applications especially breast imaging and hyperthermia monitoring, along with elastography and various applications of thermal modeling.

Keith D. Paulsen (S'85–M'86) received the B.S. degree in biomedical engineering from Duke University, Durham, NC, in 1981 and the M.S. and Ph.D. degrees in biomedical engineering from Dartmouth College, Hanover, NH, in 1984 and 1986, respectively.
From 1986 to 1988, he was an Assistant Professor in the Electromagnetics Group within the Department of Electrical and Computer Engineering, University of Arizona, Tucson. He is currently a Professor at the Thayer School of Engineering, Dartmouth College and the Director of the Radiobiology and Bioengineering Research Program for the Norris Cotton Cancer Center within the Dartmouth-Hitchcock Medical Center, Lebanon, NH. His research interests include computational methods with particular emphasis on biomedical problems in cancer therapy and imaging, and model-guided surgery.
Footnotes
Color versions of one or more of the figures in this paper are available online at http://ieeexplore.ieee.org.
Contributor Information
Qianqian Fang, Martinos Center for Biomedical Imaging, Massachusetts General Hospital (MGH), Charlestown, MA 02129 USA and also with Harvard Medical School, Boston, MA 02115 USA (qianqian.fang.th05@alum.dartmouth.org).
Paul M. Meaney, Thayer School of Engineering, Dartmouth College, Hanover, NH 03755 USA (paul.m.meaney@dartmouth.edu).
Keith D. Paulsen, Thayer School of Engineering, Dartmouth College, Hanover, NH 03755 USA and also with the Radiobiology and Bioengineering Research Program, Norris Cotton Cancer Center, Dartmouth-Hitchcock Medical Center, Lebanon, NH 03756 USA (pkeith.d.paulsen@dartmouth.edu).
References
- 1.Foster KR, Schepp JL. Dielectric properties of tumor and normal tissues at radio through microwave frequencies. J Microw Power. 1981;16:107–119. doi: 10.1080/16070658.1981.11689230. [DOI] [PubMed] [Google Scholar]
- 2.Pethig R. Dielectric properties of biological materials: Biophysical and medical applications. IEEE Trans Elec Insulation. 1984 Oct;19:453–474. [Google Scholar]
- 3.Joines WT, Zhang Y, Li C, Jirtle RL. The measured electrical properties of normal and malignant human tissues from 50 to 900 MHz. Med Phys. 1994;21:547–550. doi: 10.1118/1.597312. [DOI] [PubMed] [Google Scholar]
- 4.Larsen LE, Jacobi JH. Microwave scattering parameter imagery of an isolated canine kidney. Med Phys. 1979;6:394–403. doi: 10.1118/1.594595. [DOI] [PubMed] [Google Scholar]
- 5.Semenov SY, Bulyshev AE, Souvorov RHSAE, Sizov YE, Borisov VY, Posukh IMKVG, Nazarov AG, Tatsis GP. Microwave tomography: Theoretical and experimental investigation of the iteration reconstruction algorithm. IEEE Trans Microw Theory Tech. 1998;46:133–141. [Google Scholar]
- 6.Meaney PM, Fanning MW, Li D, Poplack SP, Paulsen KD. A clinical prototype for active microwave imaging of the breast. IEEE Trans Microw Theory Tech. 2000;48:1841–1853. [Google Scholar]
- 7.Liu QH, Zhang ZQ, Wang TT, Bryan JA, Ybarra GA, Nolte LW, Joines WT. Active microwave imaging. I. 2-D forward and inverse scattering methods. IEEE Trans Microw Theory Tech. 2002;50:123–133. [Google Scholar]
- 8.Fear EC, Li X, Hagness SC, Stuchly MA. Confocal microwave imaging for breast cancer detection: Localization of tumors in three dimensions. IEEE Trans Biomed Eng. 2002;49:812–822. doi: 10.1109/TBME.2002.800759. [DOI] [PubMed] [Google Scholar]
- 9.Hagness SC, Taflove A, Bridges JE. Two-dimensional FDTD analysis of a pulsed microwave confocal system for breast cancer detection: Fixed-focus and antenna-array sensors. IEEE Trans Biomed Eng. 1998 Dec;45:1470–1479. doi: 10.1109/10.730440. [DOI] [PubMed] [Google Scholar]
- 10.Fear EC, Sill J, Stuchly MA. Experimental feasibility study of confocal microwave imaging for breast tumor detection. IEEE Trans Microw Theory Tech. 2003;51:887–892. [Google Scholar]
- 11.Meaney PM, Paulsen KD, Ryan TP. Two-dimensional hybrid element image reconstruction for TM illumination. IEEE Trans Antennas Propag. 1995;43:239–247. [Google Scholar]
- 12.Chew WC, Wang YM. Reconstruction of two-dimensional permittivity distribution using the distorted Born iterative method. IEEE Trans Med Imaging. 1990 Jun;9(2):218–225. doi: 10.1109/42.56334. [DOI] [PubMed] [Google Scholar]
- 13.Caorsi S, Gragnani GL, Pastorino M. Two-dimensional microwave imaging by a numerical inverse scattering solution. IEEE Trans Microw Theory Tech. 1990 Aug;38(8):981–989. [Google Scholar]
- 14.Semenov SY, Svenson RH, Boulyshev AE, Souvorov AE, Borisov VY, Sizov Y, Starostin AN, Dezern KR, Tatsis GP, Baranov VY. Microwave tomography: Two-dimensional system for biological imaging. IEEE Trans Biomed Eng. 1996 Sep;43(9):869–877. doi: 10.1109/10.532121. [DOI] [PubMed] [Google Scholar]
- 15.Meaney PM, Paulsen KD, Geimer S, Haider S, Fanning MW. Quantification of 3D field effects during 2D microwave imaging. IEEE Trans Biomed Eng. 2002;49:708–720. doi: 10.1109/TBME.2002.1010855. [DOI] [PubMed] [Google Scholar]
- 16.Baron GS, Sarris CD, Fiume E. Fast and accurate time-domain simulations with commodity graphics hardware, in. Proc Antennas and Propag Society Int Symp. 2005;4A:193–196. [Google Scholar]
- 17.Adams S, Payne J, Boppana R. Finite Difference Time Domain (FDTD) simulations using graphics processors, in. Proc DoD High Performance Computing Modernization Program Users Group Conf. 2007:334–338. [Google Scholar]
- 18.Nguyen H, editor. GPU Gems 3. Boston, MA: Addison-Wesley; 2007. [Google Scholar]
- 19.Fang Q, Meaney PM, Paulsen KD. Microwave image reconstruction of tissue property dispersion characteristics utilizing multiple frequency information. IEEE Trans Microw Theory Tech. 2004 Aug;52:1866–1875. [Google Scholar]
- 20.Zhang ZQ, Liu QH. 3-D nonlinear image reconstruction for microwave biomedical imaging. IEEE Trans Biomed Eng. 2004;51:544–548. doi: 10.1109/TBME.2003.821052. [DOI] [PubMed] [Google Scholar]
- 21.Winters DW, Veen DBV, Hagness SC. Three-dimensional microwave breast imaging: Dispersive dielectric property estimation using patient-specific basis functions. IEEE Trans Med Imaging. 2009 Jul;28(7):969–981. doi: 10.1109/TMI.2008.2008959. [DOI] [PMC free article] [PubMed] [Google Scholar]
- 22.Semenov SY, Svenson RH, Bulyshev AE, Souvorov AE, Nazarov AG, Sizov YE, Posukh VG, Pavlovsky A. Three-dimensional microwave tomography: Initial experimental imaging of animals. IEEE Trans Biomed Eng. 2002;49:55–63. doi: 10.1109/10.972840. [DOI] [PubMed] [Google Scholar]
- 23.Yu C, Yuan M, Stang J, Bresslour E, George RT, Ybarra GA, Joines WT, Liu QH. Active microwave imaging II: 3D system prototype and image reconstruction from experimental data. IEEE Trans Microw Theory Tech. 2008;56:991–1000. [Google Scholar]
- 24.Fang Q, Meaney PM, Geimer SD, Streltsov AV, Paulsen KD. Microwave image reconstruction from 3D fields coupled to 2D parameter estimation. IEEE Trans Med Imaging. 2004 Apr;23:475–484. doi: 10.1109/tmi.2004.824152. [DOI] [PubMed] [Google Scholar]
- 25.Boyse WE, Seidl AA. A block QMR method for computing multiple simultaneous solutions to complex symmetric systems. SIAM J Sci Comput. 1996;17:263–274. [Google Scholar]
- 26.Gedney SD. An anisotropic perfectly matched layer-absorbing medium for the truncation of FDTD lattices. IEEE Trans Antennas Propag. 1996 Dec;44(12):1630–1639. [Google Scholar]
- 27.Joachimowicz N, Pichot C, Hugonin JP. Inverse scattering: An iterative numerical method for electromagnetic imaging. IEEE Trans Antennas Propag. 1991;39:1742–1752. [Google Scholar]
- 28.Paulsen KD, Meaney PM, Moskowitz MJ, Sullivan JM., Jr A dual mesh scheme for finite element based reconstruction algorithms. IEEE Trans Med Imaging. 1995;14:504–514. doi: 10.1109/42.414616. [DOI] [PubMed] [Google Scholar]
- 29.Yee KS. Numerical solution of initial boundary value problems involving Maxwell's equations in isotropic media. IEEE Trans Antennas Propag. 1966 Mar;14(3):302–307. [Google Scholar]
- 30.Liauh CT, Hills RG, Roemer RB. Comparison of the adjoint and influence coefficient methods for solving the inverse hyoperthermia problem. J Biomech Eng. 1993;115:63–71. doi: 10.1115/1.2895472. [DOI] [PubMed] [Google Scholar]
- 31.Burger S, Klose R, Schadle A, Schmidt F, Zschiedrich L. Adaptive FEM Solver for the Computation of Electromagnetic Eigenmodes in 3D Photonic Crystal Structures. Berlin Heidelberg: Springer; 2006. [Google Scholar]
- 32.Golub GH, van Loan CH. Matrix Computations. Baltimore, MD: The Johns Hopkins Univ Press; 1991. [Google Scholar]
- 33.Taflove A, editor. Advances in Computational Electrodynamics: The Finite-Difference Time-Domain Method. Norwood, MA: Artech House; 1998. [Google Scholar]
- 34.Taflove A, editor. Computational Electrodynamics: The Finite-Difference Time-Domain Method. Boston, MA: Artech House; 1995. [Google Scholar]
- 35.Fang Q. PhD dissertation, Dartmouth College. Hanover, NH: Dec, 2004. Computational Methods for Microw. Medical Imaging. [Google Scholar]
- 36.Zhao AP. Analysis of the numerical dispersion of the 2D alternating-direction implicit FDTD method. IEEE Trans Microw Theory Tech. 2002 Apr;50(4):1156–1164. [Google Scholar]
- 37.Franchois A, Pichot C. Microwave imaging-complex permittivity reconstruction with a Levenberg-Marquardt method. IEEE Trans Antennas Propag. 1997 Feb;45(2):203–215. [Google Scholar]


