Abstract

The structure of the 1,N2-ethenodeoxyguanosine lesion (1,N2-εdG) has been characterized in 5′-d(CGCATXGAATCC)-3′·5′-d(GGATTCATGCG)-3′ (X = 1,N2-εdG), in which there is no dC opposite the lesion. This duplex (named the 1-BD duplex) models the product of translesion bypass of 1,N2-εdG by Sulfolobus solfataricus P2 DNA polymerase IV (Dpo4) [Zang, H., Goodenough, A. K., Choi, J. Y., Irimia, A., Loukachevitch, L. V., Kozekov, I. D., Angel, K. C., Rizzo, C. J., Egli, M., and Guengerich, F. P. (2005) J. Biol. Chem. 280, 29750−29764], leading to a one-base deletion. The Tm of this duplex is 6 °C higher than that of the duplex in which dC is present opposite the 1,N2-εdG lesion and 8 °C higher than that of the unmodified 1-BD duplex. Analysis of NOEs between the 1,N2-εdG imidazole and deoxyribose H1′ protons and between the 1,N2-εdG etheno H6 and H7 protons and DNA protons establishes that 1,N2-εdG adopts the anti conformation about the glycosyl bond and that the etheno moiety is accommodated within the helix. The resonances of the 1,N2-εdG H6 and H7 etheno protons shift upfield relative to the monomer 1,N2-εdG, attributed to ring current shielding, consistent with their intrahelical location. NMR data reveal that Watson−Crick base pairing is maintained at both the 5′ and 3′ neighbor base pairs. The structure of the 1-BD duplex has been refined using molecular dynamics calculations restrained by NMR-derived distance and dihedral angle restraints. The increased stability of the 1,N2-εdG lesion in the absence of the complementary dC correlates with the one-base deletion extension product observed during the bypass of the 1,N2-εdG lesion by the Dpo4 polymerase, suggesting that stabilization of this bulged intermediate may be significant with regard to the biological processing of the lesion.
Ethenobases (1) are five-membered annelation products arising from the reactions of electrophiles derived from vinyl halides and other vinyl monomers, including chloroacetaldehyde, with dC, dA, and dG nucleotides in DNA (2−9). They also arise from endogenous exposure to lipid peroxidation products (10), particularly 4,5-epoxy-2(E)-decanal (11,12) and 4-hydroperoxynonenal (13); related etheno adducts from 4-oxo-2(E)-nonenal (14,15), 4-oxohexenal (16), and 9,12-dioxo-10(E)-dodecanoic acid (17) have also been characterized (15,17). The 1,N2-ethenodeoxyguanosine (1,N2-εdG)1 adduct (18) (Scheme 1) is one of two εdG lesions, the other being the N2,3-εdG adduct. One of our laboratories has elucidated the mechanism for formation of 1,N2-εdG (19,20). It has been detected in DNA treated with vinyl chloride metabolites (21) and β-carotene oxidation products (22), isolated using immunohistochemistry techniques (23), and identified by mass spectrometry in liver DNA of rodents (24−27).
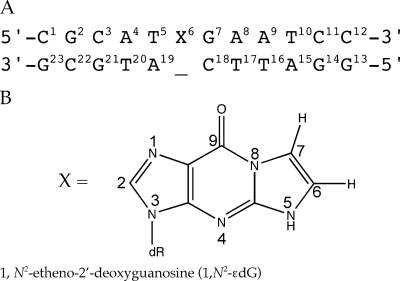
Scheme 1. (A) 1-BD-Modified Oligodeoxynucleotide Numbering Scheme and (B) Structure and Numbering Scheme for the 1,N2-εdG Adduct.
The imidazole proton of the 1,N2-εdG nucleotide is designated as H2, corresponding to the H8 proton in guanine.
The 1,Ν2-εdG lesion blocks the Watson−Crick hydrogen bonding face of dG and is mutagenic in Escherichia coli(28) and in mammalian (29) cells. The insertion of 1,N2-εdG into a 3′-G(1,N2-εdG)TACT-5′ template and its replication by the Sulfolobus solfataricus P2 DNA polymerase IV (Dpo4) were reported by Zang et al. (30), who showed that dATP was preferentially incorporated. Crystallographic analyses (30) of either binary or ternary complexes with the Dpo4 polymerase led to the conclusion that this occurs via formation of a “type II” bypass structure at the active site of the polymerase, in which the incoming dATP pairs with the 5′ neighboring T of the template strand, as opposed to the damaged 1,N2-εdG nucleotide (31). Further extension presumably led to the observed −1 frameshift event and the 5′-CATGA-3′ product (30).
To improve our understanding of the structural basis of −1 frameshift events, we inserted 1,N2-εdG into the 12-mer·11-mer duplex [5′-d(CGCATXGAATCC)-3′·5′-d(GGATTC_ATGCG)-3′ (X = 1,N2-εdG)] containing a 3′-G(1,N2-εdG)TAC-5′ template sequence (underlined) . This will be termed the 1-BD duplex (Scheme 1). It models the situation following “type II” insertion of dATP in which the Dpo4 polymerase skips the damaged base in the 3′-G(1,N2-εdG)TACT-5′ template and instead utilizes the 5′ neighbor thymine (underlined) to incorporate dATP (31), followed by further extension and resulting in a bulged 1,N2-εdG lesion in the template, leading to the 5′-CATGA-3′ −1 deletion product (30). The deletion of dC opposite 1,N2-εdG increases the duplex Tm as compared to that of the complementary modified duplex, and the bulged duplex is more stable than the corresponding duplex involving the deletion of dC complementary to an unmodified dG. Structurally, 1,N2-εdG adopts the anti conformation about the glycosyl bond and is accommodated within the DNA helix. We propose that thermal stabilization of this bulged intermediate may be significant with regard to the processing of the 1,N2-εdG lesion into a −1 deletion mutation.
Materials and Methods
Oligodeoxynucleotide Synthesis and Characterization
The oligodeoxynucleotides 5′-d(CGCATGGAATCC)-3′ and 5′-d(GGATTCATGCG)-3′, purified by anion-exchange chromatography, were obtained from the Midland Certified Reagent Co. (Midland, TX). The 1,N2-εdG phosphoramidite (32) was incorporated into 5′-d(CGCATXGAATCC)-3′ (X = 1,N2-εdG) with an Expedite 8909 DNA synthesizer (PerSeptive Biosystems), using tert-butylphenoxyacetyl-protected cyanoethyl phosphoramidites and the manufacturer’s standard protocols, on a 1 μmol scale. Oligodeoxynucleotide identity was established by MALDI-TOF mass spectrometry: MALDI-TOF MS of 5′-d(CGCATXGAATCC)-3′: calcd for [M − H]−m/z 3652.6, found m/z 3653.0. The identity was also established by chromatographic comparison of enzymatic hydrolytic products to authentic nucleoside standards by HPLC.
HPLC
Analyses were performed using a YMC ODS-AQ column (Waters, Milford, MA) [250 mm × 4.6 mm (inside diameter) and 1.5 mL/min for enzymatic digestion gradient 1 and 250 mm × 10 mm (inside diameter) and 5 mL/min for purification gradient 2]; solvents were 0.1 M aqueous ammonium formate and acetonitrile. Eluants were detected by UV absorbance at 260 nm. For HPLC gradient 1: initially 1% acetonitrile, a 15 min linear gradient to 10% acetonitrile, a 5 min linear gradient to 20% acetonitrile, isocratic for 5 min at 20% acetonitrile, a 3 min linear gradient to 80% acetonitrile, isocratic for 2 min at 80% B, and a 3 min linear gradient to initial conditions. For HPLC gradient 2: initially 1% acetonitrile, a 5 min linear gradient to 8% acetonitrile, a 15 min linear gradient to 11% acetonitrile, a 2 min linear gradient to 80% acetonitrile, isocratic for 1 min at 80% acetonitrile, and a 2 min linear gradient to initial conditions.
Capillary Gel Electrophoresis
Analyses utilized a Beckman P/ACE MDQ system (Beckman Instruments, Fullerton, CA; 32 Karat software, version 7.0) monitored at 260 nm using a 31.2 cm × 100 μm eCAP capillary with samples applied at 10 kV and run at 9 kV. The capillary was packed with the manufacturer’s 100-R gel [for single-stranded DNA (ssDNA)] using a Tris-borate buffer system containing 7 M urea.
Enzymatic Digestion
Enzymatic hydrolysis was conducted in one step. The oligodeoxynucleotide (0.5 A260 unit) was dissolved in 30 μL of buffer [10 mM Tris-HCl and 10 mM MgCl2 (pH 7.0)] and incubated with DNase I (8 units, Promega), snake venom phosphodiesterase I (0.02 unit, Sigma), and alkaline phosphatase (1.7 units, E. coli; Sigma) at 37 °C for 24 h. The mixture was analyzed by reversed phase HPLC gradient 1. Adducted nucleosides were identified by comparison with authentic samples on the basis of retention times, co-injection, and UV spectra.
Mass Spectrometry
MALDI-TOF mass spectra (negative ion) of modified oligodeoxynucleotides were obtained on a Voyager Elite DE instrument (Perseptive Biosystems) using a 3-hydroxypicolinic acid matrix containing ammonium hydrogen citrate (7 mg/mL) to suppress multiple sodium and potassium adducts.
UV Melting Studies
Samples contained 0.30 A260 unit of duplex oligodeoxynucleotide in 1 mL of buffer containing 10 mM Na2HPO4/NaH2PO4, 0.1 M NaCl, and 5 μM Na2EDTA (pH 7.0) in a 1.0 cm cuvette. The UV absorbance was monitored at 260 nm. A 2.5 °C/min temperature gradient was used. The temperature was cycled between 20 and 85 °C. The first derivative of the melting curve was used to establish the Tm values.
NMR Spectroscopy
Oligodeoxynucleotide concentrations were determined using calculated extinction coefficients at 260 nm (33). The modified and complementary strands were annealed in a 1:1 molar ratio. The duplex was eluted from DNA grade Biogel hydroxyapatite (Bio-Rad Laboratories, Richmond, CA). The duplex was desalted by elution from Sephadex G-25. The sample was lyophilized and prepared in 500 μL of buffer containing 10 mM NaH2PO4, 100 mM NaCl, and 5 μM Na2EDTA (pH 7.0). The duplex concentration was 0.3 mM. Samples for the observation of nonexchangeable protons were prepared in 99.99% D2O. Samples for the observation of exchangeable protons were prepared in a 9:1 H2O/D2O mixture.
NMR spectra were recorded at a 1H frequency of 600 MHz. The temperature was 25 °C for observation of nonexchangeable protons and 7 °C for observation of exchangeable protons. Chemical shifts of the proton resonances were referenced to the water resonance at 4.77 ppm at 25 °C and 4.95 ppm at 7 °C. For assignment of exchangeable protons, NOESY experiments were conducted using the Watergate pulse sequence (34). The mixing time was 250 ms. For the assignments of nonexchangeable protons and derivation of distance restraints, NOESY spectra were recorded using States-TPPI phase cycling with mixing times of 150, 200, and 250 ms. A relaxation delay of 2.0 s was used. Experiments were recorded with 512 real data points in the t2 dimension and 2K real data points in the t1 dimension. The data in the t2 dimension were zero-filled to give a matrix of 2K × 2K real points. Chemical shifts were referenced to water. The NMR data were processed on engineering workstations (Dell, Round Rock, TX) using FELIX2000 (Accelrys, San Diego, CA). Proton-decoupled 31P spectra were recorded at 25 °C. The 31P−1H COSY heterocorrelation spectrum was measured with presaturation of protons and selective excitation. The data matrix consisted of 96 data points in the t1 dimension and 1024 data points in the t2 dimension. The spectra were zero-filled during processing to create a matrix of 128 × 512 real points.
NMR Restraints
Cross-peak intensities were determined by volume integrations of the NOESY spectra. These were combined as necessary with intensities generated from complete relaxation matrix analysis of a B-DNA structure to generate a hybrid intensity matrix (35,36). The distances were obtained from the NOE volumes using MARDIGRAS version 5.2 (37). The RANDMARDI algorithm (38) conducted 50 iterations for each set of data, randomizing peak volumes within limits specified by the input noise level. The molecular motion was assumed to be isotropic. The volume error was one-half the volume of the weakest cross-peak. Calculations were performed using a B-DNA starting structure, NOE intensities derived from experiments at three mixing times, and three isotropic correlation times (2, 3, and 4 ns), yielding nine sets of distances. Analysis of these data yielded the experimental distance restraints and their standard deviations used in subsequent restrained molecular dynamics calculations. For partially overlapped cross-peaks, the upper bounds on the distances were increased. Distance restraints were classified according to the error assessed in their measurements. Five classes were defined on the basis of completely resolved, slightly overlapped, partially overlapped, intermediately overlapped, and heavily overlapped cross-peaks, which were at least 0.5 ppm from the water resonance or from the diagonal line of the spectrum. Additional empirical restraints preserving Watson−Crick hydrogen bonding and preventing excessive propeller twisting of base pairs were included since the NMR data indicated that the duplex conserved Watson−Crick base pairing except at the unpaired 1,N2-εdG lesion.
Structural Refinement
The calculations were conducted with AMBER (39). Classical B-DNA and A-DNA (40) were used as reference structures to create starting structures. The 1,N2-εdG adduct was constructed using INSIGHT II. The restrained electrostatic potential (RESP) charges for 1,N2-εdG were calculated using GAUSSIAN (41) (Figure S1 of the Supporting Information). The input data for the calculations were obtained from ANTECHAMBER (42). The complementary strand of the 1-BD duplex was created by deletion of dC opposite 1,N2-εdG and creation of a bond between O3′ of the 3′-flanking dC and P of the 5′-flanking dA. The coordinates, connectivity, and parameters were obtained with xLEaP. Initially constructed A- and B-DNA starting structures were energy-minimized by the conjugate gradient method without experimental restraints for 250 iterations using SANDER (43). This process yielded the structures used for subsequent relaxation matrix analysis and restrained molecular dynamics calculations. For rMD calculations, the restraint energy function included terms describing distance restraints as square-well potentials. The generalized Born solvent model was used with a salt concentration of 0.1 M, and the SHAKE algorithm was used (44,45). The nonbonded pair list was updated if any atom moved more than 0.5 Å, and the cutoff radius for nonbonded interactions was 18 Å. The effective energy function included terms describing distance restraints, in the form of square-well potentials. A total of 20000 steps were used. Calculations were initiated by coupling to a virtual heating bath, with a target temperature of 600 K. The force constants were 20 kcal mol−1 Å−2 for empirical hydrogen bonding and 32 kcal mol−1 Å−2 for class 1, class 2, class 3, class 4, and class 5 NOE restraints. The force constants of the restraints were scaled from 3.2 to 32 kcal mol−1 Å−2 during the first 5000 steps and were maintained at 32 kcal mol−1 Å−2 during the rest of calculations. The target temperature was reached and maintained for 5000 steps. The molecules were cooled to 100 K over 13000 steps with a time constant of 2.0 ps. During the final 2000 steps, the temperature was reduced to 0 K. An average structure was subjected to 500 cycles of conjugate gradient energy minimization, yielding the final structure. The NOE intensities obtained from the structures emergent from rMD simulations were compared with the experimental intensities using Complete Relaxation Matrix Calculations (CORMA version 5.3) (36). Input volumes (intensities) were normalized for the intensities of protons with fixed internuclear distances (cytosine H5−H6 protons). An isotropic correlation time (τc) of 3 ns was used. The rotation of thymine CH3 groups was modeled using a three-jump site model. The sixth root residual (R1x) factor was calculated for the averaged structure.
Results
Thermal Melting Studies of the 1-BD Duplex
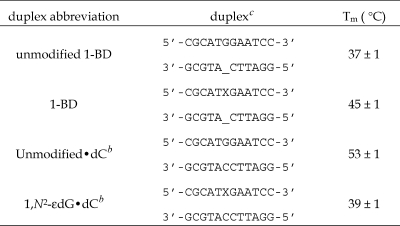
Table 1 shows the thermal denaturation for the 1-BD duplex and a series of related duplexes. The melting temperature (Tm) of the 1-BD duplex was 45 °C, and the corresponding Tm for the unmodified 1-BD duplex under the same conditions was 37 °C. Thus, the presence of the 1,N2-εdG lesion increased the Tm by ∼8 °C. Deletion of dC from the complementary strand increased the Tm compared to that of the fully complementary modified duplex (Table 1). The Tm of the duplex containing the 1,N2-εdG adduct paired opposite dC of a fully complementary strand was 39 °C under the same conditions. Thus, the Tm of the 1,N2-εdG-containing duplex was 6 °C higher when paired opposite a one-base deletion than a fully complementary strand.
Table 1. Melting Temperatures of the 1-BD Duplexa and Other Related Oligodeoxynucleotide Duplexesa.
The duplex contained ∼0.3 OD unit in 10 mM phosphate buffer, 100 mM NaCl, and 5 μM Na2EDTA (pH 7).
Melting temperatures as previously reported (50).
X = 1,N2-εdG.
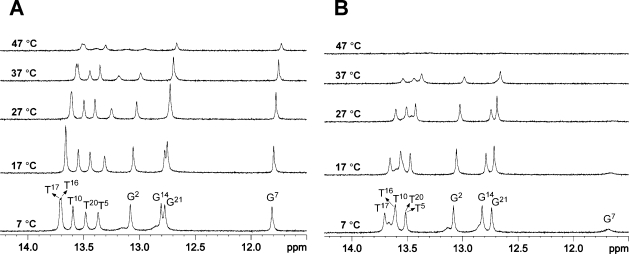
The increased stability of the 1-BD duplex compared to that of the corresponding unmodified 1-BD duplex was confirmed in NMR experiments. Figure 1A shows the imino proton region of a series of 1H NMR spectra, recorded as a function of temperature. At 7 °C, four sharp resonances for guanine imino protons (11.5−13.2 ppm) and five sharp resonances for thymine imino protons (13.2−13.9 ppm) were observed. When the temperature was increased to 47 °C, the G2, T5, and T10 imino proton resonances at 13.1, 13.5, and 12.7 ppm, respectively, were the first to disappear from the spectrum. However, the T16, T17, T20, G21/G14, and G7 imino proton resonances remained visible (Figure 1A). In contrast, only three sharp resonances were observed for guanines from the unmodified 1-BD duplex at 7 °C (Figure 1B). The peak assigned as G7, next to the modification site in the 3′ direction, was broadened in the unmodified 1-BD duplex (Figure 1B).
Figure 1.
Temperature-dependent 1H NMR spectra (imino proton region) for the 1-BD (A) and unmodified 1-BD (B) duplex.
(i) Nonexchangeable DNA Protons
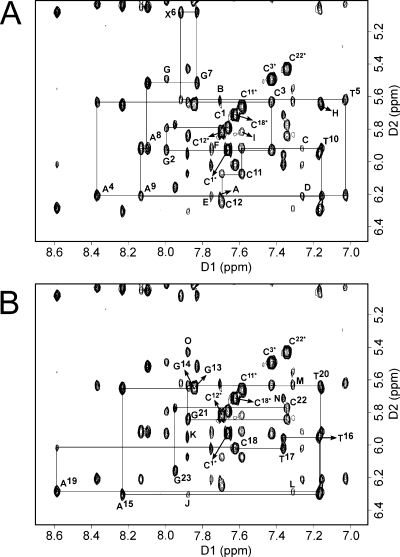
The assignments were made using standard protocols (46,47). The NOESY spectra for the 1-BD duplex exhibited resolved cross-peaks (Figure 2A,B). The anticipated pattern of sequential NOE connectivity between base aromatic and deoxyribose anomeric protons was identified for both the modified and complementary strands from C1 to C12 and from G13 to G23, respectively (Figure 2A,B). There were no interruptions to the sequential NOEs at or adjacent to the adduct site. However, the T5 H1′ → X6 H2 NOE (the imidazole proton of 1,N2-εdG; note the modified numbering scheme for this nucleotide) was weak compared to the corresponding NOEs (Figure 2A,B). Likewise, the connectivity between C18 H1′ and A19 H8 in the complementary strand was weak. The T17 H1′ → C18 H6 and C18 H6 → C18 H1′ NOE peaks overlapped. For T5, X6, G7, C18, and A19, the NOEs between the base protons and the sugar H1′ protons were similar in intensity to NOEs between other base and sugar H1′ protons. All of the intranucleotide NOE peaks between adenine H2 and H1′ protons of the attached deoxyribose moieties were observed. Expected sequential NOE peaks between the adenine H2 proton and the H1′ proton of the 3′ neighbor were also observed (Figure 2A,B). Likewise, the sequential NOE peaks between a base proton (H8 or H6) and the H5 proton of cytosine from the 3′ neighbor were observed (Figure 2A,B). The pattern of NOEs between the base aromatic protons and the deoxyribose H2′ and H2′′ protons was similar to that observed for the NOEs between the aromatic protons and the deoxyribose H1′ protons, in both the modified and complementary stands. Sequential NOEs from C18 H2′ to A19 H8 and from C18 H2′′ to A19 H8 were weak compared to other corresponding NOEs. The assignments of the nonexchangeable protons of the 1-BD and unmodified 1-BD duplexes are listed in Tables S1 and S2, respectively, of the Supporting Information.
Figure 2.
Expanded plot of a phase sensitive NOESY spectrum (250 ms) in D2O buffer for the 1-BD oligodeoxynucleotide duplex showing the sequential NOEs from the aromatic to H1′ protons. The spectrum was recorded at 25 °C. (A) Connectivities are traced for the 1,N2-εdG-modified strand: Additional cross-peaks, (A) A4 H2 → A4 H1′, (B) A4 H2 → T5 H1′, (C) A8 H2 → A8 H1′, (D) A8 H2 → A9 H1′, (E) A9 H2 → A9 H1′, (F) A9 H2 → T10 H1′, (G) G2 H8 → C3 H5, (H) T10 H6 → C11 H5, and (I) C11 H6 → C12 H5. (B) Connectivities are traced for the complementary strand: Additional cross-peaks, (J) A15 H2 → A15 H1′, (K) A15 H2 → T16 H1′, (L) A19 H2 → A19 H1′, (M) A19 H2 → T20 H1′, (N) T17 H6 → C18 H5, and (O) G21 H8 → C22 H5.
(ii) Exchangeable DNA Protons
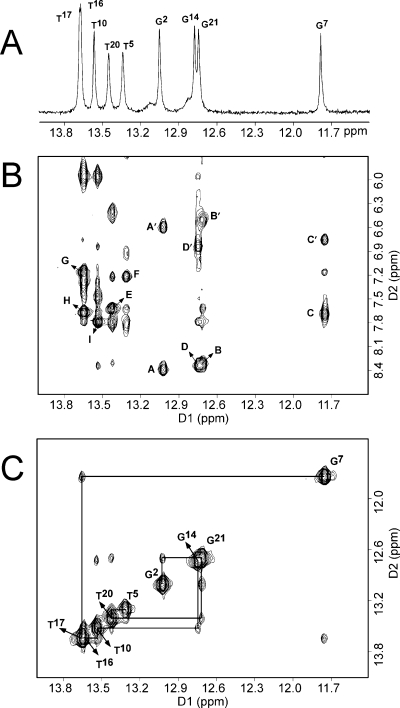
Seven well-resolved and two partially resolved peaks between 11.5 and 13.9 ppm accounted for all of the imino protons of the 1-BD duplex, except for the two terminal imino protons that were not observable, presumably because of exchange with solvent (Figure 3). Five sharp resonances between 13.2 and 13.9 ppm were assigned to thymine protons (Figure 3A), as evidenced by NOEs to the corresponding adenine H2 protons (Figure 3B). Four other sharp resonances between 11.5 and 13.2 ppm were assigned to guanine imino protons (Figure 3A), as evidenced by NOEs to the corresponding cytosine amino protons (Figure 3B). The resonance at 11.8 ppm was assigned to G7 N1H, next to the modified lesion, on the basis of the NOEs to the complementary C18 amino protons (Figure 3B) and sequential NOE connectivity from G7 N1H to T17 N3H protons (Figure 3C). From Figure 3C, the expected pattern of NOE cross-peaks was observed for the G2·C22, C3·G21, A4·T20, and T5·A19 base pairs, located in the 5′ direction from the 1,N2-εdG adduct. Likewise, NOE connectivity was observed between the G7·C18, A8·T17, A9·T16, T10·A15, and C11·G14 base pairs, located in the 3′ direction from the 1,N2-εdG adduct. The sequential NOE connectivity between imino protons of neighboring base pairs was interrupted between the T5·A19 and G7·C18 base pairs. The amino proton of the 1,N2-εdG nucleotide (Scheme 1) was not observed, suggesting rapid exchange with solvent. The resonance assignments for the imino and amino protons of the unmodified 1-BD and modified 1-BD duplexes are listed in Table S3 of the Supporting Information.
Figure 3.
(A) Downfield region of the 1H NMR spectrum for the 1-BD duplex showing the imino proton resonances. (B) Expanded plot of a NOESY spectrum with a mixing time of 250 ms for the 1-BD duplex showing the sequential NOEs between the imino protons and the amino and base protons: (A and A′) G2 N1H → C22 N4H, h/n; (B and B′) G21 N1H → C3 N4H, h/n; (C and C′) G7 N1H → C18 N4H, h/n; (D and D′) G14 N1H → C11 N4H, h/n; (E) T20 N3H → A4 H2; (F) T5 N3H → A19 H2; (G) T17 N3H → A8 H2; (H) T16 N3H → A9 H2; and (I) T10 N3H → A15 H2. The symbols h and n denote hydrogen-bonded and non-hydrogen-bonded amino protons of cytosine, respectively. (C). Expanded plot of a NOESY spectrum showing sequential NOE connectivity for the imino protons of the G2·C23 → G14·C11 base pairs for the 1-BD duplex. The labels designate the imino proton of the indicated nucleotide. The spectra were recorded at 7 °C.
(iii) 1,N2-εdG Etheno Protons
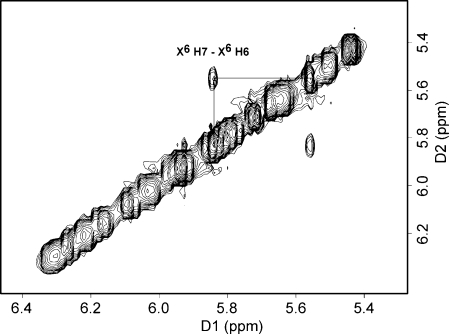
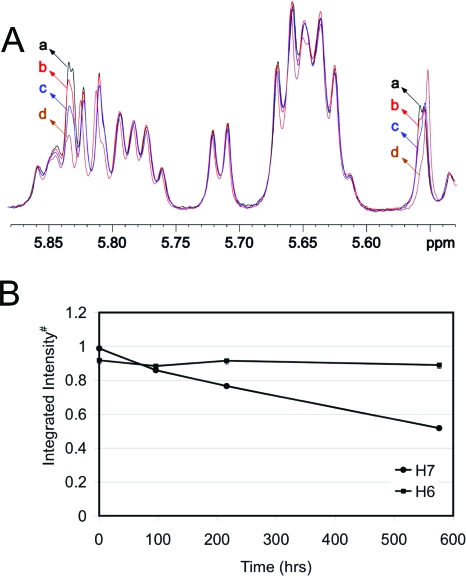
The COSY spectrum showed a cross-peak between 5.84 and 5.55 ppm (Figure 4). This signal was assigned as arising between the 1,N2-εdG H6 and H7 etheno protons. Hydrogen−deuterium exchange at 50 °C established the assignments of those two protons (19) (Figure 5). The intensity of the peak at 5.84 ppm decreased over time (Figure 5A, curves b−d), whereas that of the peak at 5.55 ppm did not (Figure 5B). The peak at 5.55 ppm became a singlet due to H−D exchange of the proton resonating at 5.84 ppm, which is assigned as the H7 etheno proton. Accordingly, the H6 proton was assigned to 5.55 ppm.
Figure 4.
Expanded region of the 1H COSY spectrum showing a cross-peak between etheno H7 and H6 protons. The spectrum was recorded at 25 °C.
Figure 5.
(A) Time-dependent 1H NMR spectra showing H−D exchange of the H7 etheno proton at 50 °C. The NMR spectra were recorded at 25 °C: (a) immediately after the sample was dissolved in buffer, (b) after 96 h, (c) after 216 h, and (d) after 576 h. (B) Change in the integrated intensity of H7 (5.84 ppm) and H6 (5.55 ppm) proton resonances with time. #The cytosine (C23) H5 proton resonance was taken as a reference.
(iv) NOEs between Etheno Protons and DNA Protons
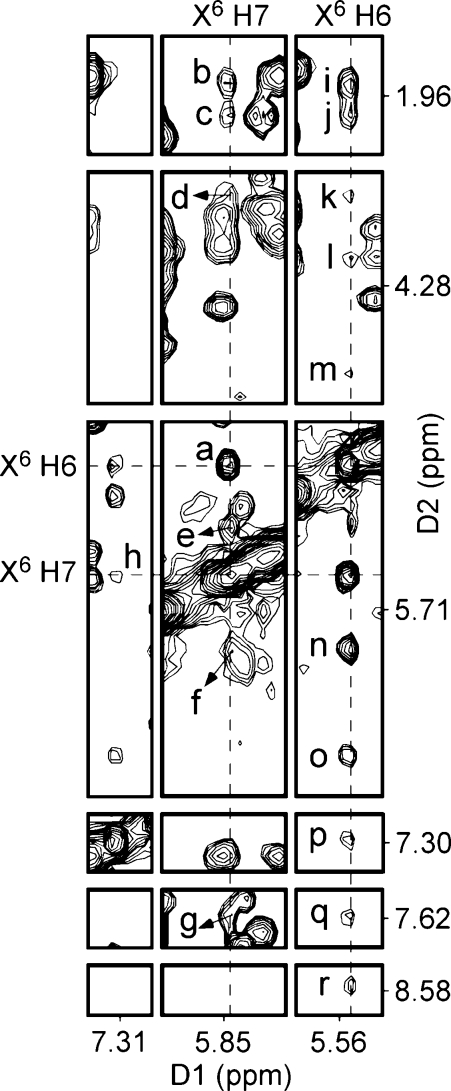
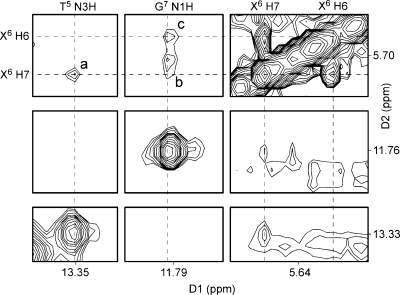
Figure 6 contains a tile plot of the NOESY spectrum recorded with a mixing time of 250 ms and shows the NOE between the two etheno protons and NOEs between the etheno protons and the nonexchangeable DNA protons. The H6 and H7 protons showed only cross-strand NOE cross-peaks. The H6 proton showed more NOE cross-peaks than did the H7 proton. A total of 17 cross-peaks were assigned between the etheno protons and nonexchangeable protons (Figure 6). Ten cross-peaks represent NOEs between X6 H6 and nonexchangeable protons, and seven cross-peaks represent NOEs between X6 H7 and nonexchangeable protons. The X6 H7 proton had medium-intensity cross-peaks to C18 H2′, C18 H2′′, C18 H5, and C18 H6, and the X6 H6 proton had medium-intensity cross-peaks to C18 H2′, C18 H2′′, and C18 H1′. Weak cross-peaks were observed between the X6 H6 proton and the A19 H5′, A19 H5′′, A19 H4′, A19 H1′, A19 H2, C18 H6, and A19 H8 protons. The X6 H7 proton had weak cross-peaks to A19 H5′/H5′′, C18 H1′, and A19 H2. In addition, three weak NOEs were observed between X6 H7 and H6 and exchangeable protons of DNA (Figure 7), which were assigned to X6 H7 → T5 N3H, X6 H7 → G7 N1H, and X6 H6 → G7 N1H NOEs.
Figure 6.
1H NOESY spectrum (tile plot) showing the assignment of exocyclic etheno protons H7 and H6 and NOEs between the etheno and DNA protons. The NOESY spectrum was recorded at 25 °C with a mixing time of 250 ms: (a) X6 H7 → X6 H6, (b) X6 H7 → C18 H2′, (c) X6 H7 → C18 H2′′, (d) X6 H7 → A19 H5′/H5′′, (e) X6 H7 → C18 H5, (f) X6 H7 → C18 H1′, (g) X6 H7 → C18 H6, (h) X6 H7 → A19 H2, (i) X6 H6 → C18 H2′, (j) X6 H6 → C18 H2′′, (k) X6 H6 → A19 H5′/H5′′, (l) X6 H6 → A19 H5′/H5′′, (m) X6 H6 → A19 H4′, (n) X6 H6 → C18 H1′, (o) X6 H6 → A19 H1′, (p) X6 H6 → A19 H2, (q) X6 H6 → C18 H6, and (r) X6 H6 → A19 H8.
Figure 7.
1H NOESY spectrum (tile plot) showing the NOEs between etheno protons and imino protons from neighboring base pairs. The NOESY spectrum was recorded at 7 °C with a mixing time of 250 ms.
Phosphorus Spectra
The proton-decoupled 31P spectrum of the 1-BD duplex is shown in Figure S2 of the Supporting Information. The spectrum shows a single phosphorus resonance shifted downfield as compared to those of the unmodified 1-BD duplex. The downfield-shifted 31P resonance was assigned to G7, from the proton-decoupled heteronuclear correlation spectrum.
Chemical Shift Effects
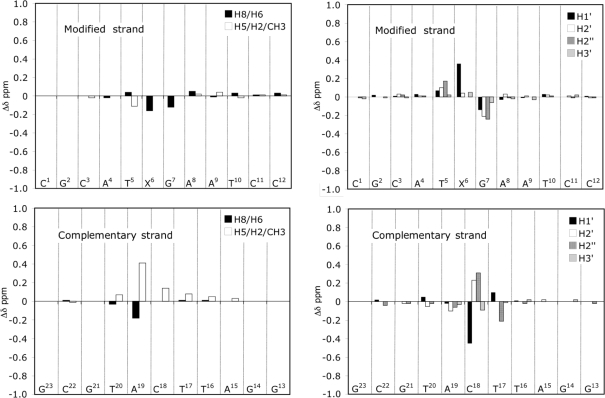
Figure 8 shows a comparison of the chemical shifts of selected nonexchangeable protons between the 1-BD duplex and the unmodified 1-BD duplex. Chemical shift changes of >0.2 ppm were observed for the X6 H1′, A19 H2, C18 H1′, C18 H2′, and C18 H2′′ protons. Compared to those of the unmodified 1-BD duplex, the X6 H2, G7 H8, and A19 H8 proton resonances shifted downfield 0.16, 0.12, and 0.18 ppm, respectively. The T5 CH3 signal shifted downfield 0.11 ppm, and the C18 H5 signal was shifted upfield 0.14 ppm. Relative to those of the unmodified 1-BD duplex, the A19 H2 signal shifted upfield by 0.41 ppm. In addition, several deoxyribose protons exhibited chemical shift changes from the nucleotides of both the modified and complementary strands; most of these were located adjacent to the 1,N2-εdG-modified site. For example, the X6 H1′ and T5 H2′′ protons shifted upfield 0.36 and 0.17 ppm, respectively. G7 H1′, G7 H2′, and G7 H2′′ shifted downfield 0.14, 0.21, and 0.24 ppm, respectively, relative to those of the unmodified 1-BD duplex. A large chemical shift change was observed for C18 H1′, which shifted 0.45 ppm downfield. The C18 H2′ and H2′′ signals shifted upfield 0.23 and 0.31 ppm, respectively. Interestingly, chemical shift changes were observed for T17 H2′′, which was located at the second base from the adduction site in the 3′ direction. In the case of exchangeable protons, the T5 N3H proton was shifted upfield 0.16 ppm, whereas the G7 N1H proton was shifted downfield 0.11 ppm.
Figure 8.
Chemical shift differences observed for the 1-BD duplex when compared to those of the corresponding unmodified 1-BD duplex.
Experimental and Empirical Restraints
The structural refinement involved 567 restraints, which included distance, dihedral angle, sugar pucker, and Watson−Crick hydrogen bonding restraints. A total of 307 NOE-based distance restraints were used, consisting of 167 intranucleotide and 140 internucleotide distances. There were an average of 13 distance restraints per nucleotide. In addition, 45 empirical Watson−Crick hydrogen bonding restraints were used for all the base pairs except for the 1,N2-εdG lesion. The rationale for their inclusion was based on the NOESY experiments in which the observation of imino and amino proton resonances was consistent with a right-handed Watson−Crick paired duplex (Figure 3). Empirical sugar pucker restraints were not used for T5, X6, and G7 because the pattern of chemical shift perturbations (Figure 8) suggested a structural disturbance at the X6 nucleotide. No backbone torsion angle restraints were used at X6, C18, and A19. Elsewhere, backbone angles α, β, γ, δ, ε, and ξ were restrained to −60 ± 30°, 180 ± 30°, 60 ± 30°, 120 ± 30°, 180 ± 30°, and −90 ± 30°, respectively, to allow both A- and B-form DNA structures. A total of 24 distance restraints, including seven intranucleotide, nine internucleotide, and eight internucleotide cross-strand distance restraints, were employed at nucleotide X6, which allowed the position of X6 in the duplex to be determined with confidence.
Structure Refinement
The randomly seeded rMD calculations were performed starting with initial structures that were created with either A- or B-form geometries and energy minimized before rMD calculations. Ten structures were calculated from each starting structure. Figure S3 (Supporting Information) shows an ensemble of structures of the 1-BD duplex obtained from randomly seeded rMD calculations from starting A-form and B-form DNA. The precision of the rMD calculations was determined by pairwise root-mean-square deviation (rmsd) calculations (Table 2). Maximum pairwise rmsd values of 0.62 and 0.80 Å were obtained for the structures calculated from starting A-form and B-form DNA, respectively, suggesting convergence. The accuracies of these structures were verified using CORMA (36). This calculation was based on the comparison of the experimental NOE intensities with the NOE intensities calculated from CORMA. A plot of the distribution of the sixth root factor, R1x, measured from the CORMA calculations, is shown in Figure S4 of the Supporting Information. The overall intra- and inter-residue sixth root residual R1x values for 1,N2-εdG duplex structures were 7.67 × 10⁻² and 9.18 × 10⁻², respectively. An average rMD structure was obtained using SUPPOSE, followed by 250 iterations of potential energy minimization using the conjugate gradient algorithm.
Table 2. Analysis of the rMD-Generated Structuresa of the 1,N2-εdG Adduct Opposite 1-BD in the 5′-TXG-3′ Sequence.
| NMR restraints | |
| total no. of distance restraints | 307 |
| no. of inter-residue distance restraints | 140 |
| no. of intraresidue distance restraints | 167 |
| empirical restraints | |
| no. of hydrogen bonding restraints | 45 |
| no. of sugar pucker restraints | 80 |
| no. of backbone torsion angle restraints | 135 |
| initial structures | atomic rmsd (Å) |
|---|---|
| IniA vs IniB | 5.84 |
| rms shifts | |
| IniA vs ⟨rMDA⟩b | 3.44 |
| IniB vs ⟨rMDB⟩b | 4.46 |
| rms distributions | |
| ⟨rMDA⟩ vs ⟨rMDA⟩ | 0.33 |
| ⟨rMDB⟩ vs ⟨rMDB⟩ | 0.54 |
| ⟨rMDA⟩ vs ⟨rMDB⟩ | 1.31 |
| ⟨rMDA⟩ vs rMDc | 0.17 |
| ⟨rMDB⟩ vs rMDc | 0.27 |
Root-mean-square deviations, excluding the end base pairs and including only heavy atoms from the rest of the residues, between various initial structures and averaged structures emergent from rMD.
⟨rMDA⟩ and ⟨rMDB⟩ represent the set of five structures that emerge from rMD calculations starting with IniA and IniB, respectively.
rMD represents the average minimized structure from all 10 rMD calculations.
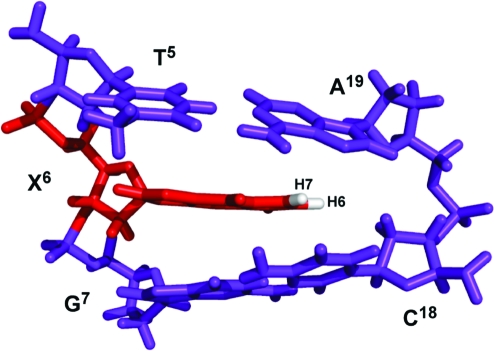
A view normal to the helix axis and looking into the major groove of the central base pair segment (5′-T5X6G7-3′·5′-C18A19-3′) is shown in Figure 9. The 1,N2-εdG adduct adopted the anti conformation about the glycosyl bond. The 1,N2-εdG adduct was accommodated within the DNA helix. The 1,N2-εdG H6 etheno proton was close to the complementary strand compared to the 1,N2-εdG H7 etheno proton, consistent with the greater number of NOEs observed for the H6 proton versus the H7 etheno proton. Further, the etheno protons were close to the complementary strand C18 and A19 aromatic ring systems (Figure 10).
Figure 9.
View of the central 5′-TXG-3′ segment of the 1-BD duplex as seen from the major groove.
Figure 10.
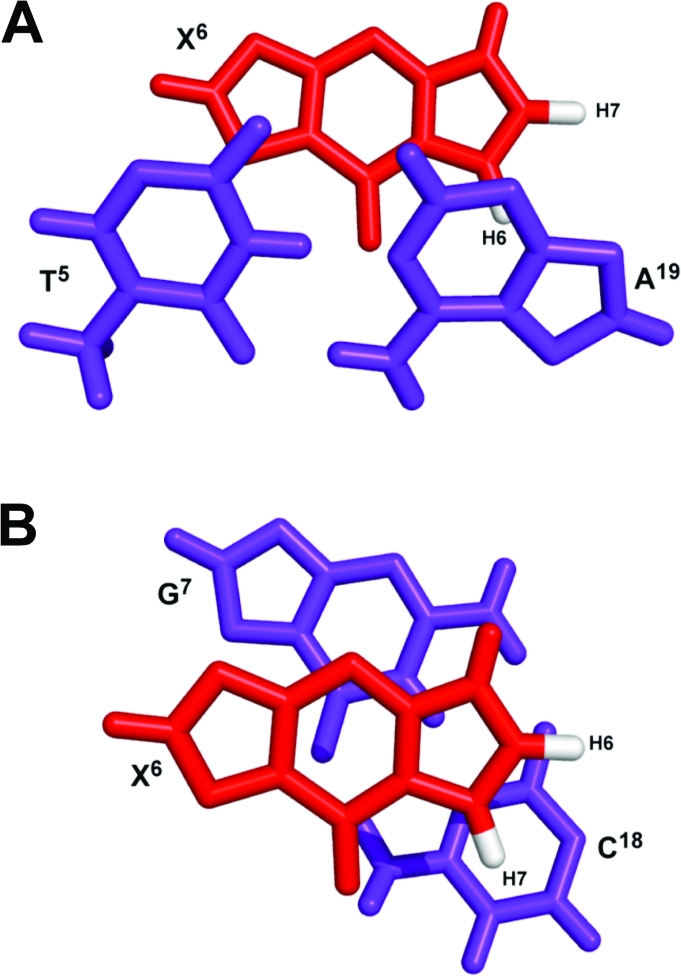
View from the top of the helix showing stacking interactions on the central segment of the duplex. (A) Interaction between the T5·A19 and X6 base pairs. (B) Interaction between the X6 and G7·C18 base pairs.
Discussion
The error-prone replication bypass of the 1,N2-εdG lesion by the S. solfataricus P2 DNA polymerase IV (Dpo4) has been characterized (30). With the template sequence 3′-G(1,N2-εdG)TACT-5′, preferential incorporation of dATP was observed. With a mixture of all four dNTPs, a mixture of full-length products 5′-CAATGA-3′ and 5′-CATTGA-3′ and deletion products 5′-CATGA-3′ and 5′-CTGA-3′ was observed (30). The formation of the −1 deletion product 5′-CATGA-3′ (30) is of particular interest with regard to this study. This is postulated to arise via the so-called “type II” Dpo4 insertion mechanism (31), in which the polymerase skips the damaged base in the 3′-G(1,N2-εdG)TACT-5′ template and instead utilizes the 5′ neighbor thymine (underlined) to incorporate dATP. If further extension occurs without relaxation of the resulting bulged 1,N2-εdG lesion in the template, the result is a −1 deletion event, leading to the 5′-CATGA-3′ product (30).
Crystallographic analyses of a series of binary template-primer·Dpo4 and ternary template-primer·Dpo4·(d)dATP complexes containing the 1,N2-εdG lesion in the same 3′-G(1,N2-εdG)TACT-5′ template sequence have been reported and provide insight into the mechanism of lesion bypass (30). In one case, 1,N2-εdG situated at position 5 of an 18-mer template stand paired with a 13-mer (−1) primer strand; crystallization with Dpo4 showed that the incoming (d)dATP paired with the 5′ neighbor T of the template, as predicted by the “type II” mechanism (31) for the polymerase. Significantly, the 1,N2-εdG lesion adopts the anti conformation about the glycosyl bond and is inserted into the duplex. The incorporation of the 1,N2-propanodeoxyguanosine (PdG) adduct into the same 3′-G(PdG)TACT-5′ template sequence and the subsequent formation of ternary complexes with Dpo4 polymerase with dATP have also been reported (48). PdG differs from 1,N2-εdG in that it is a six-member as opposed to a five-member 1,N2-dG annelation product. In this case, the incoming dATP also pairs with the 5′ neighbor T, as predicted by the “type II” mechanism (31). PdG also adopts the anti conformation about the glycosyl bond in the Dpo4 ternary complex and is accommodated in an intrahelical orientation (48). Recently, a similar structure for the malondialdehyde-derived M1dG adduct has also been reported (49). The 1-BD duplex examined herein models the situation following the “type II” insertion of dATP in which the Dpo4 polymerase skips the damaged base in the 3′-G(1,N2-εdG)TACT-5′ template and instead utilizes the 5′ neighbor thymine (underlined) to incorporate dATP (31), followed by further extension resulting in a bulged 1,N2-εdG lesion in the template, and a −1 deletion event, leading to the 5′-CATGA-3′ product (30).
Structure of the 1-BD Duplex
1,N2-εdG adopts the anti conformation about the glycosyl bond in the 1-BD duplex and is inserted into the duplex, similar to the series of binary template-primer·Dpo4 and ternary template-primer·Dpo4·(d)dATP complexes containing the 1,N2-εdG lesion in the same 3′-G(1,N2-εdG)TACT-5′ template sequence (30). The intensity of the NOE cross-peak between 1,N2-εdG H2 and 1,N2-εdG H1′ protons is similar to the intensities of the corresponding NOEs between either purine H8 or pyrimidine H6 protons and their attached deoxyribose H1′ protons at the undamaged nucleotides in the duplex. The anti conformation at 1,N2-εdG is also consistent with the appearance of the sequential NOE between T5 H1′ and X6 H2 protons. Similarly, the appearance of weak NOEs between the X6 H6 and H7 protons and the G7 N1H imino proton is consistent with the anti conformation of the glycosyl bond. The pattern of NOEs between the 1,N2-εdG H6 and H7 protons and the DNA protons is consistent with its accommodation in an intrahelical orientation. For example, cross-strand NOEs are observed for the 1,N2-εdG H6 and H7 protons with both major groove C18 H6 and A19 H8 protons and the minor groove A19 H2 proton. The observation that the 1,N2-εdG H6 proton shows more cross-strand NOEs than does the H7 proton is consistent with the conclusion that the former proton is closer to the complementary strand than the latter proton is. The 5.84 and 5.55 ppm chemical shifts of the 1,N2-εdG H6 and H7 protons, respectively (Table S1 of the Supporting Information), also confirm their intrahelical orientation. Their resonances are shifted upfield by ∼2 ppm relative to their resonance frequencies in the monomer state. The structural refinement indicates that the 1,N2-εdG etheno moiety is located between the C18 and A19 nucleobases, which accounts for the upfield chemical shifts. The etheno protons are also shifted upfield compared to the situation in which 1,N2-εdG is placed opposite dC in the fully complementary duplex. In the fully complementary duplex, 1,N2-εdG exists in equilibrium between the syn and anti conformers about the glycosyl bond (50,51). In the anti conformation, 1,N2-εdG shifts toward the minor groove, thus weakening stacking interactions experienced by the etheno moiety (50), whereas in the syn conformation, 1,N2-εdG shifts into the major groove and the etheno moiety is not stacked into the helix (51) (Table 3).
Table 3. Chemical Shift Comparison of Exocyclic Etheno Protons of the 1,N2-εdG Adduct in Different Oligodeoxynucleotide Duplexes.
1,N2-εdG Stabilizes the 1-BD Duplex
The deletion of dC from the complementary strand opposite 1,N2-εdG increases the duplex Tm compared to that of the complementary modified duplex (Table 1). The latter duplex exhibited a Tm of 39 °C, whereas that of the 1,N2-εdG-modified 1-BD duplex increases to 45 °C. At neutral pH, the complementary modified duplex exists as an equilibrium mixture of syn and anti conformers of the 1,N2-εdG lesion about the glycosyl bond (50,51). Zaliznyak et al. (52) reported a similar conformational equilibrium for 1,N2-εdG in a 3′-C(1,N2-εdG)C-5′ sequence when placed opposite dC. In contrast, the Tm for the unmodified 1-BD duplex is 37 °C, which is 8 °C lower than that of the modified 1-BD duplex (Table 1). These data are significant because one outcome of lesion bypass by the Dpo4 polymerase is the 5′-CATGA-3′ one-base deletion product (30). The formation of the one-base deletion product implies that the polymerase skips the damaged base in the 3′-G(1,N2-εdG)TACT-5′ template and instead utilizes the 5′ neighbor thymine (underlined) to incorporate dATP (31), which may be attributed to the stability of the resulting one-base deletion product. Similarly, when the (+)-cis-anti-[BP]dG adduct was placed opposite a one-base deletion in DNA (53), enhanced thermodynamic stability of the damaged duplex was also noted. In that instance, the enhanced thermodynamic stability of the duplex was also correlated with crystallographic studies using the Dpo4 polymerase, leading to the conclusion that the polymerase may exploit thermodynamic stabilization of the lesion for generation of −1 frameshift mutations (54). Overall, enhanced stabilities of −1 base deletion duplexes containing aromatic lesions may be a more general phenomenon and perhaps not limited to 1,N2-εdG adducts.
The increased stability of the 1-BD duplex compared to that of the corresponding unmodified 1-BD duplex is consistent with these NMR data. The observation of resonances from the thymine T5 N3H, T10 N3H, T16 N3H, T17 N3H, and T21 N3H imino protons and sequential NOE connectivity for imino protons from G2 N1H to T5 N3H, located in the 5′ direction from 1,N2-εdG (X6)—and from G7 N1H to G14 N3H, located in the 3′ direction from 1,N2-εdG (X6)—indicates formation of a stable duplex on both sides of the unpaired 1,N2-εdG lesion (Figure 1). In contrast, for the unmodified 1-BD duplex, only three sharp guanine imino resonances are observed (Figure 1B). Moreover, the peak assigned as G7, next to the modification site in the 3′ direction, broadens in the unmodified 1-BD duplex (Figure 1B). When the temperature is increased to 47 °C, the T16, T17, T20, G21, and G7 imino proton resonances for the 1-BD duplex persist (Figure 1A), unlike the case for the unmodified 1-BD duplex (Figure 1B) for which all of the peaks disappear. Our results provide a thermodynamic rationale for why the −1 frameshift event is facilitated when the 1,N2-εdG lesion in the 3′-G(1,N2-εdG)TACT-5′ template is bypassed by the Dpo4 polymerase.
Structural Comparisons with Two-Base Deletion Products Opposite Six-Member 1,N2-dG Annelation Adducts
M1dG and PdG are six-member exocyclic adducts formed between the N1 and N2 atoms of dG. The M1dG·2BD (55) and PdG·2BD (56) duplexes were structurally characterized with respect to the observation of deletions in iterated CG repeat sequences (57), e.g., which occur in the Salmonella typhimurium hisD3052 gene (58,59). The structure of the 1-BD duplex determined here shows similarities to the structures of the M1dG·2BD (55) and PdG·2BD (56) duplexes. In all the duplexes, the damaged nucleotides exist in the anti conformation about the glycosyl bond. Further, the exocyclic rings of the M1dG, PdG, and 1,N2-εdG lesions are inserted into the DNA duplex. In all three duplexes, the resonance frequencies for exocyclic protons shift upfield as compared to their chemical shifts in the single strands or monomers, consistent with the shielding of these exocyclic rings from neighboring base pairs and accommodation of 1,N2-εdG, M1dG, and PdG in intrahelical orientations.
Structural Comparison with Other Duplexes Containing Unpaired Nucleotides
Previous reports have concluded that DNA accommodates unpaired nucleobases in both intra- and extrahelical environments (60), the orientations being dependent both upon the identity of the unpaired nucleobase and upon the DNA sequence flanking the site (61). For example, unpaired purines generally adopt an intrahelical conformation (62,63), although an extrahelical orientation has been reported for an unpaired dA (64). For unpaired pyrimidines, both intrahelical (65,66) and extrahelical conformations are observed (61,67−69).
Bypass of the 1,N2-εdG Lesion by Other Polymerases
When bypassed by E. coli polymerases I exo- and II exo-, T7 polymerase exo-, HIV-1 reverse transcriptase, and rat polymerase β, the 1,N2-εdG lesion also produces misincorporation errors (70). The replicative human polymerase pol δ was blocked by 1,N2-εdG (71). Human polymerase η conducted error-prone replication past 1,N2-εdG, preferentially incorporating dGTP, irrespective of the identity of the base 5′ to 1,N2-εdG in the template (71). Human polymerases ι and κ exhibited similar rates of incorporation of dTTP and dCTP (71).
Conclusions
Characterization of the 1-BD duplex containing 1,N2-εdG opposite a one-base deletion in the 5′-TXG-3′ sequence reveals that the stability is increased as compared to that of the complementary duplex containing 1,N2-εdG opposite dC and the unmodified 1-BD duplex. 1,N2-εdG adopts the anti conformation about the glycosyl bond and is in an intrahelical orientation. Watson−Crick base pairing is conserved for both the 5′ and 3′ neighboring base pairs. The increased stability of the 1,N2-εdG lesion in the absence of the complementary dC correlates with the observed extension of the one-base deletion product during the bypass of the 1,N2-εdG lesion by the Dpo4 polymerase (30), suggesting that the thermal stabilization of this bulged intermediate may be significant with regard to the biological processing of the lesion.
Supporting Information Available
Chemical shifts of nonexchangeable protons for the 1-BD duplex (Table S1), chemical shifts of nonexchangeable protons for the unmodified 1-BD duplex (Table S2), chemical shifts of exchangeable protons for the 1-BD and unmodified duplex (Table S3), partial charges assigned to the 1,N2-εdG adduct using the RESP protocol (Figure S1), proton-decoupled 31P NMR spectrum of the 1-BD duplex (Figure S2), superposition of structures emergent from rMD calculations for the 1-BD duplex (Figure S3), and intra- and internucleotide sixth root R1x factors as a function of nucleotide position in the 1-BD duplex (Figure S4). This material is available free of charge via the Internet at http://pubs.acs.org.
This work was supported by National Institutes of Health (NIH) Grants P01 ES005355 (C.J.R., I.D.K., and M.P.S.) and R01 ES010375 (F.P.G.). Funding for the NMR spectrometers was supplied by Vanderbilt University, the Vanderbilt Center in Molecular Toxicology (P30 ES000267), and by NIH Grant RR005805. The Vanderbilt Ingram Cancer Center is supported by NIH Grant P30 CA068485.
Funding Statement
National Institutes of Health, United States
Footnotes
Abbreviations: 1,N2-εdG, 3-(2′-deoxy-β-d-erythro-pentofuranosyl)-3,4-dihydro-9H-imidazo[1,2-a]purin-9-one or 1,N2-etheno-2′-deoxyguanosine; M1dG, 3-(2′-deoxy-β-d-erythro-pentofuranosyl)pyrimido[1,2-α]purin-10(3H)-one; PdG, 1,N2-propano-2′-deoxyguanosine; 1-BD, one-base deletion; NOE, nuclear Overhauser enhancement; NOESY, two-dimensional NOE spectroscopy; COSY, correlation spectroscopy; DQF-COSY, double-quantum-filtered correlation spectroscopy; TPPI, time-proportional phase increment. A right superscript refers to the numerical position in the sequence starting from the 5′ terminus of chain A and proceeding to the 3′ terminus of chain A and then from the 5′ terminus of chain B to the 3′ terminus of chain B.
Supplementary Material
References
- Barbin A. (2000) Etheno-adduct-forming chemicals: From mutagenicity testing to tumor mutation spectra. Mutat. Res. 462, 55–69. [DOI] [PubMed] [Google Scholar]
- Barbin A.; Bresil H.; Croisy A.; Jacquignon P.; Malaveille C.; Montesano R.; Bartsch H. (1975) Liver-microsome-mediated formation of alkylating agents from vinyl bromide and vinyl chloride. Biochem. Biophys. Res. Commun. 67, 596–603. [DOI] [PubMed] [Google Scholar]
- Green T.; Hathway D. E. (1978) Interactions of vinyl chloride with rat-liver DNA in vivo. Chem.-Biol. Interact. 22, 211–224. [DOI] [PubMed] [Google Scholar]
- Eberle G.; Barbin A.; Laib R. J.; Ciroussel F.; Thomale J.; Bartsch H.; Rajewsky M. F. (1989) 1,N6-Etheno-2′-deoxyadenosine and 3,N4-etheno-2′-deoxycytidine detected by monoclonal antibodies in lung and liver DNA of rats exposed to vinyl chloride. Carcinogenesis 10, 209–212. [DOI] [PubMed] [Google Scholar]
- Fedtke N.; Boucheron J. A.; Walker V. E.; Swenberg J. A. (1990) Vinyl chloride-induced DNA adducts. II: Formation and persistence of 7-(2′-oxoethyl)guanine and N2,3-ethenoguanine in rat tissue DNA. Carcinogenesis 11, 1287–1292. [DOI] [PubMed] [Google Scholar]
- Guengerich F. P.; Mason P. S.; Stott W. T.; Fox T. R.; Watanabe P. G. (1981) Roles of 2-haloethylene oxides and 2-haloacetaldehydes derived from vinyl bromide and vinyl chloride in irreversible binding to protein and DNA. Cancer Res. 41, 4391–4398. [PubMed] [Google Scholar]
- Guengerich F. P.; Kim D. H. (1991) Enzymatic oxidation of ethyl carbamate to vinyl carbamate and its role as an intermediate in the formation of 1,N6-ethenoadenosine. Chem. Res. Toxicol. 4, 413–421. [DOI] [PubMed] [Google Scholar]
- Guengerich F. P. (1992) Roles of the vinyl chloride oxidation products 1-chlorooxirane and 2-chloroacetaldehyde in the in vitro formation of etheno adducts of nucleic acid bases. Chem. Res. Toxicol. 5, 2–5. [DOI] [PubMed] [Google Scholar]
- Bartsch H.; Barbin A.; Marion M. J.; Nair J.; Guichard Y. (1994) Formation, detection, and role in carcinogenesis of ethenobases in DNA. Drug. Metab. Rev. 26, 349–371. [DOI] [PubMed] [Google Scholar]
- Nair U.; Bartsch H.; Nair J. (2007) Lipid peroxidation-induced DNA damage in cancer-prone inflammatory diseases: A review of published adduct types and levels in humans. Free Radical Biol. Med. 43, 1109–1120. [DOI] [PubMed] [Google Scholar]
- Lee S. H.; Oe T.; Blair I. A. (2002) 4,5-Epoxy-2(E)-decenal-induced formation of 1,N6-etheno-2′-deoxyadenosine and 1,N2-etheno-2′-deoxyguanosine adducts. Chem. Res. Toxicol. 15, 300–304. [DOI] [PubMed] [Google Scholar]
- Petrova K. V.; Jalluri R. S.; Kozekov I. D.; Rizzo C. J. (2007) Mechanism of 1,N2-etheno-2′-deoxyguanosine formation from epoxyaldehydes. Chem. Res. Toxicol. 20, 1685–1692. [DOI] [PMC free article] [PubMed] [Google Scholar]
- Lee S. H.; Arora J. A.; Oe T.; Blair I. A. (2005) 4-Hydroperoxy-2-nonenal-induced formation of 1,N2-etheno-2′-deoxyguanosine adducts. Chem. Res. Toxicol. 18, 780–786. [DOI] [PubMed] [Google Scholar]
- Lee S. H.; Blair I. A. (2000) Characterization of 4-oxo-2-nonenal as a novel product of lipid peroxidation. Chem. Res. Toxicol. 13, 698–702. [DOI] [PubMed] [Google Scholar]
- Kawai Y.; Uchida K.; Osawa T. (2004) 2′-Deoxycytidine in free nucleosides and double-stranded DNA as the major target of lipid peroxidation products. Free Radical Biol. Med. 36, 529–541. [DOI] [PubMed] [Google Scholar]
- Maekawa M.; Kawai K.; Takahashi Y.; Nakamura H.; Watanabe T.; Sawa R.; Hachisuka K.; Kasai H. (2006) Identification of 4-oxo-2-hexenal and other direct mutagens formed in model lipid peroxidation reactions as dGuo adducts. Chem. Res. Toxicol. 19, 130–138. [DOI] [PubMed] [Google Scholar]
- Lee S. H.; Silva Elipe M. V.; Arora J. S.; Blair I. A. (2005) Dioxododecenoic acid: A lipid hydroperoxide-derived bifunctional electrophile responsible for etheno DNA adduct formation. Chem. Res. Toxicol. 18, 566–578. [DOI] [PubMed] [Google Scholar]
- Sattsangi P. D.; Leonard N. J.; Frihart C. R. (1977) 1,N2-Ethenoguanine and N2,3-ethenoguanine synthesis and comparison of electronic spectral properties of these linear and angular triheterocycles related to Y bases. J. Org. Chem. 42, 3292–3296. [DOI] [PubMed] [Google Scholar]
- Guengerich F. P.; Persmark M.; Humphreys W. G. (1993) Formation of 1,N2- and N2,3-ethenoguanine derivatives from 2-halooxiranes: Isotopic labeling studies and formation of a hemiaminal derivative of N2-(2-oxoethyl)guanine. Chem. Res. Toxicol. 6, 635–648. [DOI] [PubMed] [Google Scholar]
- Guengerich F. P.; Persmark M. (1994) Mechanism of formation of ethenoguanine adducts from 2-haloacetaldehydes: 13C-Labeling patterns with 2-bromoacetaldehyde. Chem. Res. Toxicol. 7, 205–208. [DOI] [PubMed] [Google Scholar]
- Morinello E. J.; Ham A. J.; Ranasinghe A.; Sangaiah R.; Swenberg J. A. (2001) Simultaneous quantitation of N2,3-ethenoguanine and 1,N2-ethenoguanine with an immunoaffinity/gas chromatography/high-resolution mass spectrometry assay. Chem. Res. Toxicol. 14, 327–334. [DOI] [PubMed] [Google Scholar]
- Marques S. A.; Loureiro A. P.; Gomes O. F.; Garcia C. C.; Di Mascio P.; Medeiros M. H. (2004) Induction of 1,N2-etheno-2′-deoxyguanosine in DNA exposed to β-carotene oxidation products. FEBS Lett. 560, 125–130. [DOI] [PubMed] [Google Scholar]
- Kawai Y.; Kato Y.; Nakae D.; Kusuoka O.; Konishi Y.; Uchida K.; Osawa T. (2002) Immunohistochemical detection of a substituted 1,N2-ethenodeoxyguanosine adduct by omega-6 polyunsaturated fatty acid hydroperoxides in the liver of rats fed a choline-deficient, l-amino acid-defined diet. Carcinogenesis 23, 485–489. [DOI] [PubMed] [Google Scholar]
- Loureiro A. P.; Marques S. A.; Garcia C. C.; Di Mascio P.; Medeiros M. H. (2002) Development of an on-line liquid chromatography-electrospray tandem mass spectrometry assay to quantitatively determine 1,N2-etheno-2′-deoxyguanosine in DNA. Chem. Res. Toxicol. 15, 1302–1308. [DOI] [PubMed] [Google Scholar]
- Martinez G. R.; Loureiro A. P.; Marques S. A.; Miyamoto S.; Yamaguchi L. F.; Onuki J.; Almeida E. A.; Garcia C. C.; Barbosa L. F.; Medeiros M. H.; Di Mascio P. (2003) Oxidative and alkylating damage in DNA. Mutat. Res. 544, 115–127. [DOI] [PubMed] [Google Scholar]
- Pang B.; Zhou X.; Yu H.; Dong M.; Taghizadeh K.; Wishnok J. S.; Tannenbaum S. R.; Dedon P. C. (2007) Lipid peroxidation dominates the chemistry of DNA adduct formation in a mouse model of inflammation. Carcinogenesis 28, 1807–1813. [DOI] [PubMed] [Google Scholar]
- Medeiros M. H. (2009) Exocyclic DNA adducts as biomarkers of lipid oxidation and predictors of disease. Challenges in developing sensitive and specific methods for clinical studies. Chem. Res. Toxicol. 22, 419–425. [DOI] [PubMed] [Google Scholar]
- Langouet S.; Mican A. N.; Muller M.; Fink S. P.; Marnett L. J.; Muhle S. A.; Guengerich F. P. (1998) Misincorporation of nucleotides opposite five-membered exocyclic ring guanine derivatives by Escherichia coli polymerases in vitro and in vivo: 1,N2-Ethenoguanine, 5,6,7,9-tetrahydro-9-oxoimidazo[1,2-a]purine, and 5,6,7,9-tetrahydro-7-hydroxy-9-oxoimidazo[1,2-a]purine. Biochemistry 37, 5184–5193 [published erratum: (1998) Biochemistry 37 (24), 8816]. [DOI] [PubMed] [Google Scholar]
- Akasaka S.; Guengerich F. P. (1999) Mutagenicity of site-specifically located 1,N2-ethenoguanine in Chinese hamster ovary cell chromosomal DNA. Chem. Res. Toxicol. 12, 501–507. [DOI] [PubMed] [Google Scholar]
- Zang H.; Goodenough A. K.; Choi J. Y.; Irimia A.; Loukachevitch L. V.; Kozekov I. D.; Angel K. C.; Rizzo C. J.; Egli M.; Guengerich F. P. (2005) DNA adduct bypass polymerization by Sulfolobus solfataricus DNA polymerase Dpo4: Analysis and crystal structures of multiple base pair substitution and frameshift products with the adduct 1,N2-ethenoguanine. J. Biol. Chem. 280, 29750–29764. [DOI] [PubMed] [Google Scholar]
- Ling H.; Boudsocq F.; Woodgate R.; Yang W. (2001) Crystal structure of a Y-family DNA polymerase in action: A mechanism for error-prone and lesion-bypass replication. Cell 107, 91–102. [DOI] [PubMed] [Google Scholar]
- Goodenough A. K.; Kozekov I. D.; Zang H.; Choi J. Y.; Guengerich F. P.; Harris T. M.; Rizzo C. J. (2005) Site specific synthesis and polymerase bypass of oligonucleotides containing a 6-hydroxy-3,5,6,7-tetrahydro-9H-imidazo[1,2-a]purin-9-one base, an intermediate in the formation of 1,N2-etheno-2′-deoxyguanosine. Chem. Res. Toxicol. 18, 1701–1714. [DOI] [PMC free article] [PubMed] [Google Scholar]
- Cavaluzzi M. J.; Borer P. N. (2004) Revised UV extinction coefficients for nucleoside-5′-monophosphates and unpaired DNA and RNA. Nucleic Acids Res. 32, e13. [DOI] [PMC free article] [PubMed] [Google Scholar]
- Piotto M.; Saudek V.; Sklenar V. (1992) Gradient-tailored excitation for single-quantum NMR spectroscopy of aqueous solutions. J. Biomol. NMR 2, 661–665. [DOI] [PubMed] [Google Scholar]
- James T. L. (1991) Relaxation matrix analysis of two-dimensional nuclear Overhauser effect spectra. Curr. Opin. Struct. Biol. 1, 1042–1053. [Google Scholar]
- Keepers J. W.; James T. L. (1984) A theoretical study of distance determination from NMR. Two-dimensional nuclear Overhauser effect spectra. J. Magn. Reson. 57, 404–426. [Google Scholar]
- Borgias B. A.; James T. L. (1990) MARDIGRAS: A procedure for matrix analysis of relaxation for discerning geometry of an aqueous structure. J. Magn. Reson. 87, 475–487. [Google Scholar]
- Liu H.; Spielmann H. P.; Ulyanov N. B.; Wemmer D. E.; James T. L. (1995) Interproton distance bounds from 2D NOE intensities: Effect of experimental noise and peak integration errors. J. Biomol. NMR 6, 390–402. [DOI] [PubMed] [Google Scholar]
- Case D. A.; Cheatham T. E. III; Darden T.; Gohlke H.; Luo R.; Merz K. M. Jr.; Onufriev A.; Simmerling C.; Wang B.; Woods R. J. (2005) The AMBER biomolecular simulation programs. J. Comput. Chem. 26, 1668–1688. [DOI] [PMC free article] [PubMed] [Google Scholar]
- Arnott S.; Hukins D. W. L. (1972) Optimised parameters for A-DNA and B-DNA. Biochem. Biophys. Res. Commun. 47, 1504–1509. [DOI] [PubMed] [Google Scholar]
- Frisch M. J., et al. (1998) GAUSSIAN 98, Gaussian, Inc., Pittsburgh, PA. [Google Scholar]
- Wang J.; Wang W.; Kollman P. A.; Case D. A. (2006) Automatic atom type and bond type perception in molecular mechanical calculations. J. Mol. Graphics Modell. 25, 247–260. [DOI] [PubMed] [Google Scholar]
- Banci L.; Bertini I.; Savellini G. G.; Romagnoli A.; Turano P.; Cremonini M. A.; Luchinat C.; Gray H. B. (1997) Pseudocontact shifts as constraints for energy minimization and molecular dynamics calculations on solution structures of paramagnetic metalloproteins. Proteins 29, 68–76. [DOI] [PubMed] [Google Scholar]
- Bashford D.; Case D. A. (2000) Generalized Born models of macromolecular solvation effects. Annu. Rev. Phys. Chem. 51, 129–152. [DOI] [PubMed] [Google Scholar]
- Tsui V.; Case D. A. (2000) Theory and applications of the generalized Born solvation model in macromolecular simulations. Biopolymers 56, 275–291. [DOI] [PubMed] [Google Scholar]
- Reid B. R. (1987) Sequence-specific assignments and their use in NMR studies of DNA structure. Q. Rev. Biophys. 20, 2–28. [DOI] [PubMed] [Google Scholar]
- Patel D. J.; Shapiro L.; Hare D. (1987) DNA and RNA: NMR studies of conformations and dynamics in solution. Q. Rev. Biophys. 20, 35–112. [DOI] [PubMed] [Google Scholar]
- Wang Y.; Saleh S.; Marnett L. J.; Egli M.; Stone M. P. (2008) Insertion of dNTPs opposite the 1,N2-propanodeoxyguanosine adduct by Sulfolobus solfataricus P2 DNA polymerase IV. Biochemistry 47, 7322–7334. [DOI] [PMC free article] [PubMed] [Google Scholar]
- Eoff R. L.; Stafford J. B.; Szekely J.; Rizzo C. J.; Egli M.; Guengerich F. P.; Marnett L. J. (2009) Structural and functional analysis of Sulfolobus solfataricus Y-family DNA polymerase Dpo4-catalyzed bypass of the malondialdehyde-deoxyguanosine adduct. Biochemistry 48, 7079–7088. [DOI] [PMC free article] [PubMed] [Google Scholar]
- Shanmugam G.; Goodenough A. K.; Kozekov I. D.; Guengerich F. P.; Rizzo C. J.; Stone M. P. (2007) Structure of the 1,N2-etheno-2′-deoxyguanosine adduct in duplex DNA at pH 8.6. Chem. Res. Toxicol. 20, 1601–1611. [DOI] [PMC free article] [PubMed] [Google Scholar]
- Shanmugam G.; Kozekov I. D.; Guengerich F. P.; Rizzo C. J.; Stone M. P. (2008) Structure of the 1,N2-ethenodeoxyguanosine adduct opposite cytosine in duplex DNA: Hoogsteen base pairing at pH 5.2. Chem. Res. Toxicol. 21, 1795–1805. [DOI] [PMC free article] [PubMed] [Google Scholar]
- Zaliznyak T.; Lukin M.; Johnson F.; de Los Santos C. (2008) Solution structure of duplex DNA containing the mutagenic lesion 1,N2-etheno-2′-deoxyguanine. Biochemistry 47, 4606–4613. [DOI] [PubMed] [Google Scholar]
- Cosman M.; Fiala R.; Hingerty B. E.; Amin S.; Geacintov N. E.; Broyde S.; Patel D. J. (1994) Solution conformation of the (+)-cis-anti-[BP]dG adducts opposite a deletion site in a DNA duplex: Intercalation of the covalently attached benzo[a]pyrene into the helix with base displacement of the modified deoxyguanosine into the minor groove. Biochemistry 33, 11518–11527. [DOI] [PubMed] [Google Scholar]
- Bauer J.; Xing G.; Yagi H.; Sayer J. M.; Jerina D. M.; Ling H. (2007) A structural gap in Dpo4 supports mutagenic bypass of a major benzo[a]pyrene dG adduct in DNA through template misalignment. Proc. Natl. Acad. Sci. U.S.A. 104, 14905–14910. [DOI] [PMC free article] [PubMed] [Google Scholar]
- Schnetz-Boutaud N. C.; Saleh S.; Marnett L. J.; Stone M. P. (2001) The exocyclic 1,N2-deoxyguanosine pyrimidopurinone M1G is a chemically stable DNA adduct when placed opposite a two-base deletion in the (CpG)3 frameshift hotspot of the Salmonella typhimurium hisD3052 gene. Biochemistry 40, 15638–15649. [DOI] [PubMed] [Google Scholar]
- Moe J. G.; Reddy G. R.; Marnett L. J.; Stone M. P. (1994) 1H NMR characterization of a duplex oligodeoxynucleotide containing propanodeoxyguanosine opposite a two-base deletion in the (CpG)3 frameshift hotspot of Salmonella typhimurium hisD3052. Chem. Res. Toxicol. 7, 319–328. [DOI] [PubMed] [Google Scholar]
- VanderVeen L. A.; Hashim M. F.; Shyr Y.; Marnett L. J. (2003) Induction of frameshift and base pair substitution mutations by the major DNA adduct of the endogenous carcinogen malondialdehyde. Proc. Natl. Acad. Sci. U.S.A. 100, 14247–14252. [DOI] [PMC free article] [PubMed] [Google Scholar]
- Oeschger N. S.; Hartman P. E. (1970) ICR-induced frameshift mutations in histidine operon of Salmonella. J. Bacteriol. 101, 490–504. [DOI] [PMC free article] [PubMed] [Google Scholar]
- Hartman P. E.; Ames B. N.; Roth J. R.; Barnes W. M.; Levin D. E. (1986) Target sequences for mutagenesis in Salmonella histidine-requiring mutants. Environ. Mutagen. 8, 631–641. [DOI] [PubMed] [Google Scholar]
- Rosen M. A.; Live D.; Patel D. J. (1992) Comparative NMR study of An-bulge loops in DNA duplexes: Intrahelical stacking of A, A-A, and A-A-A bulge loops. Biochemistry 31, 4004–4014. [DOI] [PubMed] [Google Scholar]
- Morden K. M.; Maskos K. (1993) NMR studies of an extrahelical cytosine in an A·T rich region of a deoxyribodecanucleotide. Biopolymers 33, 27–36. [DOI] [PubMed] [Google Scholar]
- Patel D. J.; Kozlowski S. A.; Marky L. A.; Rice J. A.; Broka C.; Itakura K.; Breslauer K. J. (1982) Extra adenosine stacks into the self-complementary d(CGCAGAATTCGCG) duplex in solution. Biochemistry 21, 445–451. [DOI] [PubMed] [Google Scholar]
- Nikonowicz E. P.; Meadows R. P.; Gorenstein D. G. (1990) NMR structural refinement of an extrahelical adenosine tridecamer d(CGCAGAATTCGCG)2 via a hybrid relaxation matrix procedure. Biochemistry 29, 4193–4204. [DOI] [PubMed] [Google Scholar]
- Joshua-Tor L.; Frolow F.; Appella E.; Hope H.; Rabinovich D.; Sussman J. L. (1992) Three-dimensional structures of bulge-containing DNA fragments. J. Mol. Biol. 225, 397–431. [DOI] [PubMed] [Google Scholar]
- van den Hoogen Y. T.; van Beuzekom A. A.; de Vroom E.; van Der Marel G. A.; van Boom J. H.; Altona C. (1988) Bulge-out structures in the single-stranded trimer AUA and in the duplex (CUGGUGCGG)·(CCGCCCAG). A model-building and NMR study. Nucleic Acids Res. 16, 5013–5030. [DOI] [PMC free article] [PubMed] [Google Scholar]
- van den Hoogen Y. T.; van Beuzekom A. A.; van Den Elst H.; van Der Marel G. A.; van Boom J. H.; Altona C. (1988) Extra thymidine stacks into the d(CTGGTGCGG)·d(CCGCCCAG) duplex. An NMR and model-building study. Nucleic Acids Res. 16, 2971–2986. [DOI] [PMC free article] [PubMed] [Google Scholar]
- Morden K. M.; Gunn B. M.; Maskos K. (1990) NMR studies of a deoxyribodecanucleotide containing an extrahelical thymidine surrounded by an oligo(dA)·oligo(dT) tract. Biochemistry 29, 8835–8845. [DOI] [PubMed] [Google Scholar]
- Morden K. M.; Chu Y. G.; Martin F. H.; Tinoco I. Jr. (1983) Unpaired cytosine in the deoxyoligonucleotide duplex dCA3CA3G·dCT6G is outside of the helix. Biochemistry 22, 5557–5563. [Google Scholar]
- Kalnik M. W.; Norman D. G.; Li B. F.; Swann P. F.; Patel D. J. (1990) Conformational transitions in thymidine bulge-containing deoxytridecanucleotide duplexes: Role of flanking sequence and temperature in modulating the equilibrium between looped out and stacked thymidine bulge states. J. Biol. Chem. 265, 636–647. [PubMed] [Google Scholar]
- Langouet S.; Muller M.; Guengerich F. P. (1997) Misincorporation of dNTPs opposite 1,N2-ethenoguanine and 5,6,7,9-tetrahydro-7-hydroxy-9-oxoimidazo[1,2-a]purine in oligonucleotides by Escherichia coli polymerases I exo- and II exo-, T7 polymerase exo-, human immunodeficiency virus-1 reverse transcriptase, and rat polymerase β. Biochemistry 36, 6069–6079. [DOI] [PubMed] [Google Scholar]
- Choi J. Y.; Zang H.; Angel K. C.; Kozekov I. D.; Goodenough A. K.; Rizzo C. J.; Guengerich F. P. (2006) Translesion synthesis across 1,N2-ethenoguanine by human DNA polymerases. Chem. Res. Toxicol. 19, 879–886. [DOI] [PMC free article] [PubMed] [Google Scholar]
Associated Data
This section collects any data citations, data availability statements, or supplementary materials included in this article.


