

Abstract
The large-conductance, calcium-activated potassium (BK) channels help eliminate potassium in mammals consuming potassium-rich diets. In the distal nephron, principal cells contain BK-α/β1 channels and intercalated cells contain BK-α/β4 channels. We studied whether BK-β4–deficient mice (Kcnmb4−/−) have altered renal sodium and potassium clearances compared with wild-type mice when fed a regular or potassium-rich diet for ten days. We did not detect differences in urinary flow or fractional excretions of potassium (FEK) or sodium (FENa) between Kcnmb4-deficient and wild-type mice fed a regular diet. However, a potassium-rich diet led to >4-fold increases in urinary flows for both groups of mice, although Kcnmb4-deficient mice exhibited less urinary flow, higher plasma potassium concentration, more fluid retention, and significantly lower FEK and FENa than wild-type mice despite similar plasma aldosterone levels. Immunohistochemical analysis revealed increased basolateral Na-K-ATPase in principal cells of all potassium-adapted mice, but expression of Na-K-ATPase in intercalated cells was >10-fold lower. The size of intercalated cells reduced and luminal volume increased among potassium-adapted wild-type but not Kcnmb4-deficient mice. Paradoxically, this led to increased urinary fluid velocity in potassium-adapted Kcnmb4-deficient mice compared with wild-type mice. Taken together, these data suggest that BK-α/β4 channels in intercalated cells reduce cell size, increasing luminal volume to accommodate higher distal flow rates during potassium adaptation. These changes streamline flow across the principal cells, producing gradients more favorable for potassium secretion and less favorable for sodium reabsorption.
A high-K diet is a natural diuretic,1 causing decreased Na and Cl reabsorption in the thick ascending limb (TAL) because of medullary recycling and high interstitial K levels.2 The decreased Na transport in the medullary TAL disrupts the concentrating mechanism, thereby increasing flow to the distal nephron.2 The high deliveries of Na to the connecting tubules (CNT) and cortical collecting ducts (CCD) is exchanged for K, and the increased flow stimulates K secretion to maximize the amount of K secreted to Na absorbed. The renal outer medullary kidney K channel (ROMK) and the large conductance, calcium-activated K channels (BK) in the CNT and CCD serve to eliminate K during K adaptation.3–6
In the distal nephron, the CNT and CCD consist of two epithelial cell types: principal cells (PCs) and intercalated cells (ICs). The PCs mediate Na and water reabsorption and K secretion, and the ICs mediate acid/base transport. Under normal conditions, K secretion by the PCs is mediated primarily by the ROMK channel.7 However, flow-induced K secretion in the distal nephron is mediated by BK.4,8,9
BK are a complex of pore-forming α and accessory β subunits (BK-α/β). The PCs of the CNT contain BK-α/β1 and are well equipped with an abundance of basolateral Na-K-ATPase to secrete K in K-adapted (KA) conditions. However, the preponderance of BK-α reside in ICs10,11 along with the ancillary subunit, BK-β4 (gene: Kcnmb4).12 A study has indicated that BK of ICs are regulated by mitogen-activated protein kinase to prevent K reabsorption during demand for maximal K secretion.13 It has also been proposed that BK-α/β4 in ICs have a role in flow-mediated K secretion.
If high flow induces BK-mediated K secretion, then BK-α/β4 of ICs must have a role. It has been shown that the shear stress produced by high flow causes a transient increase in intracellular Ca to levels that may activate BK. Indeed, ICs, which protrude into the lumens of the CNT and CCD, are particularly subjected to shear stress forces that may elevate intracellular Ca. However, a transient Ca activation of BK would not produce the sustained K transport required for long-term K adaptation.
That BK-α/β4 of ICs may not produce sustained K secretion is also indicated by the paucity of Na-K-ATPase. K adaptation14 or mineralocorticoid treatment15–17 increases the quantity of basolateral Na-K-ATPase of mammalian collecting ducts to maintain a favorable electrochemical driving force for K secretion. However, because ICs have considerably less Na-K-ATPase than PCs,18–21 ICs may not have an adequate K source to sustain K secretion via BK-α/β4.22 Still, Na-K-ATPase has not been quantified in ICs in KA conditions. If the BK-α/β4 were directly involved in the increased K transport associated with K adaptation, then it would be expected that the Na-K-ATPase in ICs would increase summarily to PCs.23
To this end, we determined whether Kcnmb4−/− have altered renal K and Na excretions compared with wild type (WT) under control and KA conditions. Evidence from KA Kcnmb4−/− indicates that the role of BK-α/β4 in ICs is to reduce cell size, thereby increasing tubular fluid volumes to accommodate the higher distal flow rates of KA mice. By reducing the protrusion of ICs into the lumen and increasing tubular volume, flow will be more streamlined across the PCs and a more a favorable chemical gradient for K secretion and less favorable gradient for Na reabsorption will be produced.
Results
Na, K, and Volume Balance
Experiments were performed to determine the difference in Na and K handling and volume balance in four groups of mice: control diet wild type (control WT), control diet Kcnmb4−/− (control Kcnmb4−/−), K-adapted wild type (KA WT), and K-adapted Kcnmb4−/− (KA Kcnmb4−/−). A sample number (N) between 7 and 11 represented all groups.
As shown in Figure 1A, the fractional excretion of Na (FENa) was significantly (P < 0.001) increased for KA WT (0.60 ± 0.03%) compared with control WT (0.40 ± 0.02%). However, the FENa of KA Kcnmb4−/− was only 0.29 ± 0.03%, a value significantly lower compared with KA WT (P < 0.001) and control Kcnmb4−/− (0.39 ± 0.02%, P < 0.02). The decrease in Na excretion indicated a large increase in Na reabsorption in the distal nephron.
Figure 1.

Kcnmb4−/− mice have altered K and Na handling under K adaptation. Bar plots showing (A) FeNa and (B) FEK and plasma concentrations for (C) Na and (D) K for WT and Kcnmb4−/− control and KA conditions. Data represent mean ± SEM. * = significant difference (P < 0.05) between diets. † = significant difference between phenotypes on same diet.
As expected, the KA WT and KA Kcnmb4−/− exhibited a significantly greater fractional excretion of K (FEK) compared with controls (Figure 1B). However, FEK for KA Kcnmb4−/− (93.5 ± 10.8) was significantly attenuated compared with KA WT (162.6 ± 10.8%, P < 0.001). There was no statistical difference in FEK between control WT and control Kcnmb4−/− (23.3 ± 1.5% versus 24.0 ± 0.4%, P = 0.967). There was no statistical difference in GFR between groups (data not shown).
The plasma Na and K concentrations are shown in Figure 1, C and D, respectively. The plasma Na levels were not significantly different among the four treatment groups, with values varying from 137 ± 1 mM for control WT to 139 ± 2 mM for KA Kcnmb4−/− (Figure 1C). The plasma K concentrations of control WT and control Kcnmb4−/− were not different (Figure 1D). The plasma K concentrations for KA WT was slightly but insignificantly (P = 0.085) increased compared with control WT (4.33 ± 0.11 versus 4.05 ± 0.05 mM). The plasma K concentration of KA Kcnmb4−/− (4.75 ± 0.12 mM) was significantly greater than Kcnmb4−/− control (4.03 ± 0.02 mM; P < 0.001) and KA WT (P < 0.005). This increase in plasma K concentration reflected the attenuated K secretory response of KA Kcnmb4−/−.
Urinary output and water intake (by drinking) are shown in Figure 2. As shown in Figure 2A, the urinary output of control Kcnmb4−/− (1.01 ± 0.02 ml/d) was not significantly different from control WT (1.03 ± 0.03 ml/d). The urinary output increased in KA WT by nearly 5-fold to 4.94 ± 0.15 ml/d. The urinary output increased in KA Kcnmb4−/− to 4.32 ± 0.14 ml/d; however, this value was significantly attenuated compared with KA WT.
Figure 2.

Kcnmb4−/− mice retain water during KA. (A) Urine output and (B) water intake values for each treatment group. * = significant difference (P < 0.05) between diets. † = significant difference between phenotypes on same diet.
As shown in Figure 2B, the water consumption of control KA (1.93 ± 0.07 ml/d) was not different from control WT (1.87 ± 0.19 ml/d). The water consumption of KA WT and KA Kcnmb4−/− increased substantially; however, KA Kcnmb4−/− consumed significantly more water (7.70 ± 0.17 ml/d) compared with KA WT (6.42 ± 0.14 ml/d). Therefore, consistent with Na retention, KA Kcnmb4−/− consumed more water and had less urinary output compared with KA WT.
Figure 3 shows volume status as related to weight changes (Figure 3A) and hematocrits (Figure 3B) for the four treatment groups. The KA WT gained slightly more weight (0.42 ± 0.03 g) than control WT (0.22 ± 0.03 g). However, KA Kcnmb4−/− gained 5.2 ± 0.2 g, which was significantly greater than the weight gain of KA WT (P < 0.001) and of control Kcnmb4−/− (0.21 ± 0.02 g; P < 0.001). The hematocrits of KA and control WT were not significantly different (45.7 ± 0.4 versus 45.5 ± 0.4%). However, the hematocrits of KA Kcnmb4−/− were significantly lower compared with control Kcnmb4−/− (35.4 ± 0.5% versus 45.9 ± 0.4%; P < 0.001). The increased weight and lower hematocrit reveal extreme fluid retention and volume expansion for KA Kcnmb4−/−.
Figure 3.

Kcnmb4−/− mice undergo volume expansion during KA. Bar plots illustrating fluid balance as related to (A) weight change and (B) hematocrit in WT and Kcnmb4−/− in control and KA conditions. * = significant difference (P < 0.05) between diets. † = significant difference between phenotypes on same diet.
Aldosterone
Figure 4 shows the plasma aldosterone levels for control and KA WT and Kcnmb4−/−. The aldosterone levels were not significantly different in control Kcnmb4−/− (116.0 ± 1.1 pg/ml) compared with control WT (106.6 ± 2.7 pg/ml). As expected, K adaptation resulted in significantly increased plasma aldosterone concentrations for WT and Kcnmb4−/−. However, the plasma aldosterone concentration for KA Kcnmb4−/− was 149.4 ± 6.9 pg/ml, a value that was not significantly different from the value of 143.8 ± 9.9 pg/ml for KA WT.
Figure 4.

KA increases plasma aldosterone. Plasma aldosterone levels for WT and Kcnmb4−/− on control and KA diets. * = significant difference (P < 0.05) between diets. † = significant difference between phenotypes on same diet.
Differential Effects of K-Adaptation on Na-K-ATPase of ICs and PCs
Immunohistochemical co-staining for V-ATPase (red), a marker of ICs, and the α1 subunit of the Na-K-ATPase (green) is shown in Figures 5A through 5D and is quantified for with relative expression units (AU) for PCs and ICs in each of the four groups (n = 3 in each group). For the CCD of control WT and Kcnmb4−/−, the Na-K-ATPase stained faintly on the basolateral membrane (BLM) of ICs and intensely on the BLM of PCs (absence of V-ATPase; non-IC). The summary bar graph of Figure 5E compares the PC Na-K-ATPase intensities (Figure 5E) of the four groups. Compared with control WT (96.9 ± 1.8) and control Kcnmb4−/− (92.0 ±4.9), KA WT and KA Kcnmb4−/− exhibited significantly greater intensity values of 157.5 ± 5.5 and 146.7 ± 9.3, respectively. There was no significant difference in PC Na-K-ATPase expression between control WT and control Kcnmb4−/− or between KA WT and KA Kcnmb4−/−.
Figure 5.

KA increases Na-K-ATPase expression in PC. Representative sections from (A) WT control, (B) Kcnmb4−/− control, (C) WT KA, and (D) KA Kcnmb4−/− showing CCD immunohistochemically co-stained with V-ATPase (red) and the α1 subunit of the Na-K-ATPase (green). As shown in all images and quantitatively in panel E, PCs (V-ATPase negative) express strong Na-K-ATPase staining on the BLM, which increased by 50% in KA. There was no difference in α1 staining between phenotypes on the same diet.
As shown in Figures 5A through 5D, the Na-K-ATPase expression on ICs was barely detectable, with relative staining values <10% of PC staining values. There was no significant difference in IC Na-K-ATPase staining when control was compared with KA conditions. In addition, there was no difference when IC Na-K-ATPase expression of KA WT was compared with that of KA Kcnmb4−/− (15.97 ± 3.65 versus 13.80 ± 1.82). These results demonstrate that PCs, but not ICs, are adapting to a high-K diet by elevating Na-K-ATPase, which increases the driving force for K secretion. Moreover, the decrease in K secretion in KA Kcnmb4−/− cannot be attributed to a deficiency of Na-K-ATPase in PCs or ICs.
Immunohistochemical Analysis of Tubular Cross-Sectional Area and IC Volume
Despite the decrease in K excretion in Kcnmb4−/−, the minimal levels of Na-K-ATPase in ICs of KA mice suggest a nontransepithelial transport role for BK-α/β4. Because ICs normally protrude into the lumen of the CNT and CCD, we questioned whether the BK-α/β4 would have a volume regulatory role during the high flow–high shear stress of KA conditions to help accommodate the larger fluid volume. If so, the lumens of KA Kcnmb4−/− would be narrowed compared with KA WT. The representative colorimetric immunohistochemical photomicrographs of CCD are shown in Figures 6A through 6D, and a summary of tubular cross-sectional areas are shown for CCD (Figure 6E) and CNT (Figure 6F). There were significant increases in CCD and CNT cross-sectional areas of KA WT when compared with control WT. KA Kcnmb4−/− also exhibited significantly elevated cross-sectional areas of the CNT and CCD compared with control Kcnmb4−/− (P < 0.005). However, these values were significantly less than KA WT. There were no statistical differences in cross-sectional areas of CNT or CCD when comparing control WT with control Kcnmb4−/−. These data show that CCD and CNT tubules have increased luminal volumes in response to K-adaptation-induced fluid flow and this increased luminal volume is blunted in Kcnmb4−/−.
Figure 6.

Kcnmb4−/− CNT and CCD have blunted distention during KA. Representative sections from (A) WT control, (B) Kcnmb4−/− control, (C) WT KA, and (D) KA Kcnmb4−/− illustrating the luminal cross-sectional areas of CCD. Bar plots summarizing the (E) CCD and (F) CNT luminal cross-sectional areas for each treatment group. * = significant difference (P < 0.05) between diets. † = significant difference between phenotypes on same diet.
If flow-induced shear stress activates BK-α/β4 in the absence of matching K delivery by Na-K-ATPase, ICs would exhibit cell volume decrease. We therefore placed WT and Kcnmb4−/− on a control or high-K diet and determined whether ICs exhibited cell volume reduction in the presence or absence of the BK-β4 in vivo. IC volume was estimated using the well established Cavalieri method.24 Summary bar plots of IC volumes are shown for CCD (Figure 7A) and CNT (Figure 7B). Under the high flow, high shear stress conditions of a high-K diet, ICs of CCD and CNT from WT exhibited significant volume reduction. However, ICs from KA Kcnmb4−/− did not exhibit cell volume reduction. These results indicate that the BK-β4 of ICs is necessary for high flow, shear-stress-induced volume decrease.
Figure 7.

ICs from Kcnmb4−/− mice do not undergo flow mediated cell volume decrease. Summary bar plots of measured cell volumes of ICs from (A) CCD and (B) CNT determined in each treatment group. ICs from KA WT, but not KA Kcnmb4−/−, exhibited significantly decreased cell volumes in CCD and CNT. * = significant difference (P < 0.05) between diets. † = significant difference between phenotypes on same diet.
The cross-sectional areas of the proximal tubule (PCT) and the TAL were also measured in the four treatment groups. As shown in Figure 8, the luminal cross-sectional areas of the PCT were similarly increased in the KA WT and KA Kcnmb4−/− compared with control. Because BK-α/β4 is not normally expressed in the PCT, this result is not surprising. The TAL, which normally expresses BK-α/β4,25 responded similarly as the CNT and CCD, with a blunted increase in luminal cross-sectional area in KA Kcnmb4−/− compared with KA WT.
Figure 8.

Kcnmb4−/− TAL tubules, but not PCT, have blunted distention during KA. Representative sections from (A) control WT, (B) control Kcnmb4−/−, (C) KA WT, and (D) KA Kcnmb4−/− illustrating the luminal cross-sectional areas of CCD. Bar plots summarizing the (E) PCT and (F) TAL luminal cross-sectional areas for each treatment group. * = significant difference (P < 0.05) between diets. † = significant difference between phenotypes on same diet.
It is conceivable that edema, caused by the fluid retention, was causing the constriction of the CNT and CCD of the KA Kcnmb4−/−. However, we found no significant difference in kidney weights, with values of 149 ± 4, 133 ± 5, 162 ± 3, and 140 ± 6 mg for control WT, control Kcnmb4−/−, KA WT, and KA Kcnmb4−/−, respectively. That the kidney weight did not increase in KA Kcnmb4−/− indicates the narrowed lumens were not due to renal edema-induced tubular compression. The lack of narrowing of the PCT in KA Kcnmb4−/− also argues against edema-induced tubular compression.
It was determined whether a reduction of BK-α expression was the reason for the failure of the CNT and CCD to exhibit a reduction in cell size in the KA Kcnmb4−/−. However, as shown in Supplemental Figure 1, we found no significant difference in expressions of BK-α on ICs (identified by V-ATPase) of the four treatment groups.
Discussion
Normally, KA mammals maintain blood volume and plasma K levels within normal limits by mechanisms including mineralocorticoid-induced augmentation of the driving force for K secretion with additional epithelial Na channels and Na-K-ATPase in PCs. However, we show that KA Kcnmb4−/− exhibit impaired K and Na excretion, yielding volume retention and a reduction in the ratio of K excreted to Na reabsorbed. This was an interesting finding because BK-α/β4 resides in ICs, which have minimal Na-K-ATPase, even in KA conditions. Moreover, KA WT and Kcnmb4−/− exhibited equal concentrations of plasma aldosterone production and equally increased amounts of Na-K-ATPase in the BLM of PCs. The minimal amount of Na-K-ATPase in ICs suggests that the BK-α/β4 do not have a K secretory role.
In addition to the driving force effects of aldosterone, K secretion is enhanced in KA mammals by virtue of increased distal flow rates, which stimulate BK-mediated K secretion. Although the KA Kcnmb4−/− accommodated the more than 4-fold increase in flow, the distal tubules remained narrowed and the IC size remained large compared with WT. We conclude that in KA mice, BK-α/β4 play a role in the cell volume reduction of ICs and increase the luminal cross-sectional area in response to the high flow rates through the CNT and CCD. By reducing IC size, the tubule volume is increased, thereby maintaining high chemical gradients for K secretion and reduced chemical gradients for Na reabsorption.
Na, K, and Volume Balance in KA Kcnmb4−/−
It is not new that BK components are involved in electrolyte and volume homeostasis.4,26–28 Although the BK-α/β4 resides in the apical membrane of ICs, there was a large decrease in the amount of K secreted and an increase in the amount of Na absorbed in KA Kcnmb4−/−. The K secretory defect in Kcnmb4−/− was manifested by a reduced urinary K clearance and an increased plasma K concentration. The increased Na and water retention was manifested as reduced Na excretion and extreme volume expansion.
In a previous study from this laboratory, we found that KA Kcnmb1−/− (BK-β1) manifested a K secretory defect, leading to an elevated plasma K concentration and aldosteronism.27 Another study revealed that BK-α−/− exhibited extreme aldosteronism.6 In the study presented here, the plasma K concentration increased significantly in the KA Kcnmb4−/−; however, we found no difference in plasma aldosterone compared with KA WT. Aldosterone was probably not elevated in KA Kcnmb4−/− because of opposing hormonal effects. Because there was considerable volume retention in KA Kcnmb4−/−, suppressed plasma angiotensin II levels would lower aldosterone production. Moreover, aldosterone was probably suppressed by elevated levels of atrial natriuretic factor, which inhibits adrenal aldosterone production.29–31
The reduced K secretion in the KA Kcnmb4−/− can be best explained by the failure to increase the tubular fluid volume. A reduced tubular volume would result in faster elevation of tubular K concentration as K is secreted in the CNT and CCD. An elevated luminal K concentration reduces the chemical gradient for K secretion.32–34
The increased Na and fluid retention is not due to primary hyperaldosteronism because the plasma aldosterone levels were the same in the KA WT and KA Kcnmb4−/−. It has been shown that BK-β4 is predominantly expressed in the brain and alcohol modulates BK-α/β4.35 Therefore, a neural defect of Kcnmb4−/−, in which the mice are drinking excessively, should be considered. We observed a moderate but significant increase in water consumption in the Kcnmb4−/−. However, a primary neural defect of excessive drinking by Kcnmb4−/− should manifest as hyponatremia and increased urinary volume, even in mice on control diets. The normal plasma Na concentration and decreased urinary output of KA Kcnmb4−/− is consistent with the finding of a primary renal defect of Na and water retention.
The normal plasma Na concentration with Na retention for KA Kcnmb4−/− can be explained by an intrinsic renal defect characterized by the failure to increase the tubular cross-sectional area and fluid volume. It has been shown that a reduced cross-sectional area and increased fluid velocity and shear stress would increase epithelial Na channel-mediated Na reabsorption.36 In that study, the increased tubular flow resulted in elevated Na reabsorption without affecting the transepithelial potential, indicating that Na transport electrically couples with paracellular Cl reabsorption rather than K secretion. In addition, the faster velocity of flow but with reduced amount of tubular fluid volume in KA Kcnmb4−/− results in a faster replenishment of the Na and Cl reabsorptive gradient as Na is extracted in the distal nephron. Therefore, the high shear stress of the high velocity through narrowed lumens of KA Kcnmb4−/− results in increased Na and Cl reabsorption with a less negative transepithelial potential and reduced driving force for K secretion, causing the observed volume retention and rise in plasma K concentration.
Several other unknown factors released by shear stress may be responsible for the reduced K secretion and enhanced Na reabsorption in the narrowed tubules of KA Kcnmb4−/−. The rapid velocities of fluid would have additional shear stress effects on ICs that are still protruding into the lumen. Various compounds may be released from ICs that could inhibit K secretion and stimulate Na reabsorption.
Several studies have shown that shear stress affects the claudins of tight junctions of endothelial cells.37,38 It is therefore possible that paracellular Cl transport is increased to short-circuit the Na reabsorption and uncouple its exchange for K secretion. As a molecular switch to control NaCl reabsorption as opposed to Na-K exchange, with no lysine kinase 4 (WNK4) resides in the tight junction of the CCD where it increases paracellular Cl transport.39 It would be interesting to determine the effects of shear stress on WNK4 as a regulator of the paracellular Cl conductivity of the CNT or CCD.
It should be noted that the fluid retention of the KA Kcnmb4−/−, noted by a weight gain of 5 g more than WT, is disproportionately greater than indicated by the decrease in hematocrit (from approximately 45% to 35%). The additional weight is due to extravascular edema because we have observed fluid accumulation in the abdominal cavities of the KA Kcnmb4−/−.
Effects of a High-K Diet on Na-K-ATPase in Distal Tubular Cells
Several studies have shown that the amount of Na-K-ATPase in cells of the distal nephron is increased in KA conditions.40–42 However, ICs have a paucity of Na-K-ATPase,20,21 a component necessary for the sustained delivery of K through the cell and to the apical BK-α/β4. Studies have not determined whether the Na-K-ATPase of ICs is also increased under KA conditions. These results support the finding that the Na-K-ATPase of ICs is <10% of the quantity in the PCs or CNT. Although we found an increase in staining intensity of Na-K-ATPase in the BLM of the PCs and CNT of KA mice, we did not find an increase in the Na-K-ATPase of the ICs. The Na-K-2Cl transporter (NKCC), described in MDCK-C11 cells and which has many IC properties, is a potential source of K entering the cell via the basolateral membrane.43 The NKCC could serve to replenish the K of the ICs when flow ceases and the cells return to their normal size. However, for sustained K transport via NKCC, a primary active Na pump other than the Na-K-ATPase found in the PCs would be necessary to maintain a low intracellular Na concentration. These results suggest that, unlike the PCs, the ICs are not directly engaged in net K transport of KA mice. Therefore, the source of the enhanced K secretion in the distal nephron of KA mammals is likely in the CNT and PCs, which exhibit a 50% increase in Na-K-ATPase.
Regulation of IC Volume by BK-α/β4
Our data showed that the ICs from KA WT, but not KA Kcnmb4−/−, exhibited a reduction of cell size. This result is consistent with high distal flow activating BK-α/β4, with the BK-β4 as a necessary component, initiating a volume regulatory decrease. ICs are bestowed with a relatively high cell potential of approximately −30 mV44,45 because of a large dominating basolateral Cl conductance.46 Thus, there is a large electrochemical gradient for K to exit the cell when K channels are activated. In this scenario, on shear-stress activation of BK-α/β4, the intracellular K would exit the cell, Cl would follow the electrical gradient, and water would exit down an osmotic gradient via aquaporin 6 channels, which were previously identified in ICs.47 Indeed, we have recently shown that shear stress activates BK-α/β4 of MDCK-C11 cells, an IC clone of distal tubule cells, causing a reduction in cell K content. This effect was eliminated by transfecting MDCK-C11 with BK-β4 small interfering RNA.48
Reduction of IC Size Affects Tubular Flow
The volumetric flow rate (Q) of an incompressible, fully developed fluid through a tube of any cross-sectional geometry can be expressed as
where μ is the mean fluid velocity and A is the tubule cross-sectional area. Under normal and high flow conditions, the CNT and CCD are mostly impermeable to water. Therefore, one can assume that the flow rate (Q) in these segments is constant and changes in tubule cross-sectional area will affect fluid velocity (eq 1). On the basis of CNT and CCD cross-sectional areas measured in WT and Kcnmb4−/− in control and KA conditions (Figure 6), we calculated their average fluid velocities (Table 1) on the basis of previously observed flow rates.49 Paradoxically, in KA WT (i.e., high tubule flow), the velocity decreases substantially because of the large increase in tubule cross-sectional area. This enhances distal tubule fluid volume and reduces the luminal K concentration, allowing a more favorable chemical gradient for K secretion (Figure 1B), thereby explaining the reduced K excretion in the KA Kcnmb4−/− and the BK-mediated flow-induced K secretion in the isolated perfused CCD.9,50
Table 1.
Average fluid velocitya
| Fluid Velocity (mm/min) | CNTb | CCDc |
|---|---|---|
| WT, normal flow | 23.44 | 21.28 |
| Kcnmb4−/−, normal flow | 22.39 | 20.80 |
| WT, high flow | 15.77 | 25.05 |
| Kcnmb4−/−, high flow | 25.18 | 38.82 |
aFluid velocities in the CNT and CCD for given volumetric flow rates were calculated based on eq 1 and the CNT and CCD cross-sectional areas given in Figure 6. Animals on a control diet exhibited normal tubular flow. Animals on a high-K diet exhibited high flow
bCNT: normal flow = 3 nl/min, high flow = 7 nl/min.
cCCD: normal flow = 15 nl/min, high flow = 35 nl/min.
Changes in tubular cross-sectional area also can be explained by the hydrostatic pressure gradients along the distal nephron that are necessary to drive fluid flow. The Hagen–Poiseuille equation describes the volumetric flow rate (Q) in terms of tubule radius (a), fluid viscosity (μ), and hydrostatic pressure gradient (dp/dz):
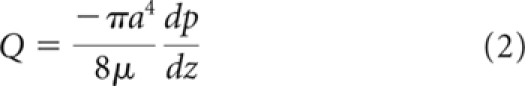 |
Because μ is constant, Q is a linear function of pressure drop but a quadratic function of tubule radius. Therefore, small changes in tubule radius can profoundly affect the volumetric flow rate. For the given flow rates (Table 1), we plotted the required hydrostatic pressure gradient (dp/dz), for a given tubule radius (Figure 9). Radii were chosen based on the range of cross-sectional areas that were measured (Figure 6) assuming a circular cross-section (A = πa2). Assuming that the CNT did not dilate under high flow conditions (a = 5 μm), then a pressure gradient of 25 mmHg/cm would be needed to maintain a 7-nl/min flow. Because the hydrostatic pressure upstream in Bowman's space is approximately 15 mmHg, this would not be possible. However, increasing tubule radius to only 7 μm would require a more feasible pressure gradient of only 6.6 mmHg/cm. As tubule radius increases, the need for large pressure gradients at high flow rates decreases substantially (a function of a4), making this less of an issue in the CCD.
Figure 9.

High pressure gradients are required in the absence of tubule dilation. Pressure gradient (dp/dz) was plotted as a function of tubule radius for a given volumetric flow rate in the CNT and CCT according to the Hagen–Poiseuille equation (eq 2).
Relative to PCs, ICs protrude into the lumen, acting as “speed bumps” along the distal nephron, disturbing the tubule fluid flow field, and increasing tubular resistance to flow. Flow-induced BK activation in ICs leads to a substantial reduction in IC volume, thereby reducing their luminal profile, decreasing tubular resistance, and increasing tubular volumetric fluid flow.
BK-β4 was also found in the distal convoluted tubule and the TAL.25 BK are thought to have a role in cell volume regulation in TAL cells.51 The cross-sectional areas of the distal convoluted tubule were not measured in this study. However, consistent with a role for BK-α/β4 in reducing cell size with increased flow, we detected significantly lower TAL cross-sectional areas in KA Kcnmb4−/−. We found no difference in cross-sectional areas of the PCT, which does not have BKβ4, when KA WT was compared with KA Kcnmb4−/−.
Summary and Relevance
The results of this study provide a different view on the role of BK in ICs with respect to flow-mediated K secretion elicited by a high-K diet. The finding that PCs, but not ICs, of KA mice exhibit an increase in basolateral Na-K-ATPase suggests that ICs may not transport K transcellularly. Instead, the high flow conditions of K adaptation cause a decrease in IC size and an increase in luminal diameter, resulting in larger volumes of distal fluid. A reduced K concentration in the CNT and CCD yields a more favorable chemical gradient for secreting K. That the PCs exhibited an increase in Na-K-ATPase in the KA mice suggests that the PCs are secreting K transcellularly, probably through the BK-α/β1 (in CNT) or ROMK. The BK-α/β4 of ICs may take part in sustained K secretion in KA conditions through an active transport mechanism that does not involve the Na-K-ATPase. However, the data of this study show that an important component of flow-mediated K secretion is the reduction of IC size via activation of BK-α/β4.
Concise Methods
Animal Studies
All animals were maintained in accordance with the Institutional Animal Care and Use Committee of the University of Nebraska Medical Center. At approximately 8 weeks of age, WT (C57BL/6, Charles River, Wilmington, MA) and Kcnmb4−/− mice (generously provided by R. Brenner) were given normal mouse chow (0.6% K+, 0.32% Na+, control) or chow with a high K content (5.0% K+, 0.32% Na+, from Harlan Teklad, Madison, WI), for 10 days. The animals had full access to water at all times. Urine samples were collected several times a day using metabolic cages (Nalgene), as described previously.27
The Kcnmb4−/− mice were developed and verified by tissue-typing by Brenner et al.52 The genotype was further verified in our laboratory by the lack of BK-β4 protein in renal cortex of Kcnmb4−/−.25
After treatment, mice were anesthetized and blood samples were harvested as described previously27 for measuring hematocrit and plasma aldosterone, creatinine, Na, and K concentrations. A flame photometer (Jenway model PFP7/C, Barloworld Scientific Ltd., Essex, United Kingdom) was used to measure plasma and urine Na and K concentrations. Plasma aldosterone (Cayman Chemical, Ann Arbor, MI) and creatinine (BioAssay Systems, Hayward, CA) concentrations were measured by colorimetric assay following the manufacturer's protocol. Kidneys were immediately fixed in Bouins solution (LabChem, Pittsburg, PA) or Histochoice MB (Electron Microscopy Sciences, Hatfield, PA) and embedded in paraffin for sectioning as described previously.25,53
Immunohistochemical Staining
For colorimetric immunohistochemical staining, kidney sections 4 μm thick were processed at room temperature according to standard immunohistochemical methods as described previously.28 Briefly, paraffin slides were washed in xylene and then rehydrated by a series of ethanol washes. When necessary, antigen retrieval was performed by incubating slides for 5 minutes at room temperature in PBS with 1% SDS, followed by washing in PBS. Endogenous peroxidase was quenched with 10% hydrogen peroxide for 20 minutes followed by permeabilization with 0.5% Triton X-100 for 20 minutes and blocking (PBS with 1% BSA and 1% powdered milk) for 30 minutes. Sections were incubated with the primary mouse antibodies diluted in blocking buffer overnight at 4°C. Afterwards, sections were washed three times in PBS with 0.5% Tween-20 and incubated with either species-specific F(ab′)2-horseradish-peroxidase-conjugated or F(ab′)2-alkaline-phosphatase-conjugated or both secondary antibodies (Santa Cruz Biotechnology) for 1 hour at room temperature. Sections were rinsed three times in PBS with 0.5% Tween-20 and then developed with either diaminobenzidin substrate or AP-Fast Red (both from Invitrogen) following the manufacturer's protocol. CNT were identified by basolateral staining with a Na-Ca exchanger mouse monoclonal antibody (Swant, Switzerland, 1:200 dilution), and CCD were identified by basolateral staining with a goat polyclonal aquaporin 3 antibody (Santa Cruz Biotechnology, 1:50 dilution). Similarly, PCT and TAL were identified by staining with goat polyclonal Na/glucose cotransporter antibody (Santa Cruz Biotechnology, 1:50 dilution) and rabbit polyclonal Tamm–Horsfall glycoprotein (Santa Cruz Biotechnology, 1:50 dilution), respectively.
For fluorescence immunohistochemical staining, kidney sections were processed as described above without peroxidase quenching. Sections were incubated with rabbit polyclonal anti-LEAVE (generous gift from Dr. Thomas Pressley), a specific antibody for the α1 subunit of the Na-K-ATPase54 (1:100 dilution), or mouse monoclonal anti-BKα (NeuroMab, University of California, Davis, CA; diluted 1:50) and goat polyclonal anti-VATPase (diluted 1:100, Santa Cruz Biotechnology, Santa Cruz, CA) in blocking buffer overnight at 4°C. Rabbit or mouse IgG was used as a negative control. After washing three times in PBS with 0.5% Tween-20, sections were incubated for 1 hour in the dark at room temperature with either donkey anti-rabbit IgG conjugated Alexa Fluor 488 or donkey anti-mouse IgG conjugated Alexa Fluor 488 and donkey anti-goat IgG conjugated Alexa Fluor 594 (both diluted 1:200 in blocking buffer, Invitrogen). After nuclear staining with 0.25 μg/ml Hoechst 33258 for 10 minutes in the dark at room temperature, sections were rinsed three times in PBS with 0.5% Tween-20, dried, mounted with Prolong Gold (Invitrogen), sealed with nail polish, and viewed on a Leica HC fluorescence microscope with a 40×/0.75 NA HCX PL Fluotar objective with images captured with an QImaging Retiga EXi CCD camera (Surrey, British Columbia, Canada) and analyzed with ImageJ software (version 1.42, National Institutes of Health, Bethesda, MD). Quantification of basolateral Na-K-ATPase signal intensity in PCs (V-ATPase negative) and ICs (V-ATPase positive) was determined following online instructions in single-channel, gray scale images after background correction.
Measurements of Tubule Cross-Sectional Area
Tubule cross-sectional area was measured by counting total pixels within the tubule and converting pixel size to area (1 pixel = 0.14 μm2). All images were taken at the same magnification and resolution on a Leica HC fluorescence microscope with a 40×/0.75 NA HCX PL Fluotar objective with images captured using a high-resolution digital CCD color camera (QImaging MicroPublisher 3.3 RTV, Surrey, British Columbia, Canada) and analyzed with Photoshop (version 6.2). Ten PCT, TAL, CNT, and CCD tubules were randomly selected per section. Four nonserial sections were measured per mouse, and four mice per group, giving 160 tubule cross-sectional area measurements per tubular segment per group.
IC Volume Measurements
IC volume was estimated using the well established Cavalieri method as described previously.24 Four serial sections 3 μm thick were stained as described above. Ten CNT and ten CCD were randomly selected and ICs were identified in each tubule by the lack of basolateral staining of the Na-Ca exchanger55,56 or aquaporin 3.57 IC cross-sectional area was measure as described above for each cell. The IC volume was estimated by summing the IC cross-sectional areas and multiplying by the slice thickness. At least 40 IC volumes were measured per group.
Statistical Methods
Data shown in figures represent mean ± SEM. Unless otherwise denoted, significant differences between treatment groups (control, HK) for WT and Kcnmb4−/− mice were determined by ANOVA plus Student-Newman-Keuls or tukey test (P < 0.05 considered significant). The coefficient of error for the Cavalieri method was determined using the subsampling method.24 We performed data management and statistical analyses using Excel (Microsoft Corporation, Redmond, WA) and SigmaPlot (version 11, Systat Software, GmbH, Germany).
Disclosures
None.
Supplementary Material
Acknowledgments
This work was supported by National Institutes of Diabetes and Digestive and Kidney Diseases grants RO1 DK49461 and RO1 DK73070 (to S.C. Sansom) and a fellowship (0610059Z) from the American Heart Association-Heartland Affiliate (P.R. Grimm). The monoclonal antibody against BK-α was developed by and/or obtained from the University of California–Davis/National Institutes of Health (NIH) NeuroMab Facility, supported by NIH Grant U24-NS-050606 and maintained by the Department of Neurobiology, Physiology, and Behavior, College of Biologic Sciences, at the University of California in Davis, CA. We thank Tom Barger of the Electron Microscopy Research Facility at the University of Nebraska Medical Center for his assistance and technical advice. A portion of this work was presented at the annual Experimental Biology Meeting, April 5 to 9, 2008, San Diego, CA, in abstract form.
Footnotes
Published online ahead of print. Publication date available at www.jasn.org.
Supplemental information for this article is available online at http://www.jasn.org/.
References
- 1. Battilana CA, Dobyan DC, Lacy FB, Bhattacharya J, Johnston PA, Jamison RL: Effect of chronic potassium loading on potassium secretion by the pars recta or descending limb of the juxtamedullary nephron in the rat. J Clin Invest 62: 1093– 1103, 1978 [DOI] [PMC free article] [PubMed] [Google Scholar]
- 2. Stokes JB: Consequences of potassium recycling in the renal medulla. Effects of ion transport by the medullary thick ascending limb of Henle's loop. J Clin Invest 70: 219– 229, 1982 [DOI] [PMC free article] [PubMed] [Google Scholar]
- 3. Grimm PR, Sansom SC: BK channels in the kidney. Curr Opin Nephrol Hypertens 16: 430– 436, 2007 [DOI] [PubMed] [Google Scholar]
- 4. Bailey MA, Cantone A, Yan Q, MacGregor GG, Leng Q, Amorim JB, Wang T, Hebert SC, Giebisch G, Malnic G: Maxi-K channels contribute to urinary potassium excretion in the ROMK-deficient mouse model of Type II Bartter's syndrome and in adaptation to a high-K diet. Kidney Int 70: 51– 59, 2006 [DOI] [PubMed] [Google Scholar]
- 5. Sansom SC, Welling PA: Two channels for one job. Kidney Int 72: 529– 530, 2007 [DOI] [PubMed] [Google Scholar]
- 6. Rieg T, Vallon V, Sausbier M, Sausbier U, Kaissling B, Ruth P, Osswald H: The role of the BK channel in potassium homeostasis and flow-induced renal potassium excretion. Kidney Int 72: 566– 573, 2007 [DOI] [PubMed] [Google Scholar]
- 7. Lu M, Wang T, Yan Q, Yang X, Dong K, Knepper MA, Wang W, Giebisch G, Shull GE, Hebert SC: Absence of small conductance K+ channel (SK) activity in apical membranes of thick ascending limb and cortical collecting duct in ROMK (Bartter's) knockout mice. J Biol Chem 277: 37881– 37887, 2002 [DOI] [PMC free article] [PubMed] [Google Scholar]
- 8. Kunau RT, Jr, Webb HL, Borman SC: Characteristics of the relationship between the flow rate of tubular fluid and potassium transport in the distal tubule of the rat. J Clin Invest 54: 1488– 1495, 1974 [DOI] [PMC free article] [PubMed] [Google Scholar]
- 9. Woda CB, Bragin A, Kleyman TR, Satlin LM: Flow-dependent K+ secretion in the cortical collecting duct is mediated by a maxi-K channel. Am J Physiol Renal Physiol 280: F786– F793, 2001 [DOI] [PubMed] [Google Scholar]
- 10. Palmer LG, Frindt G: High-conductance K: Channels in intercalated cells of the rat distal nephron. Am J Physiol Renal Physiol 292: F966– F973, 2007 [DOI] [PubMed] [Google Scholar]
- 11. Pacha J, Frindt G, Sackin H, Palmer LG: Apical maxi K channels in intercalated cells of CCT. Am J Physiol 261: F696– F705, 1991 [DOI] [PubMed] [Google Scholar]
- 12. Pech V, Kim YH, Weinstein AM, Everett LA, Pham TD, Wall SM: Angiotensin II increases chloride absorption in the cortical collecting duct in mice through a pendrin-dependent mechanism. Am J Physiol Renal Physiol 292: F914– F920, 2007 [DOI] [PubMed] [Google Scholar]
- 13. Li D, Wang Z, Sun P, Jin Y, Lin DH, Hebert SC, Giebisch G, Wang WH: Inhibition of MAPK stimulates the Ca2+ -dependent big-conductance K channels in cortical collecting duct. Proc Natl Acad Sci U S A 103: 19569– 19574, 2006 [DOI] [PMC free article] [PubMed] [Google Scholar]
- 14. Le HM, Kaissling B, Dubach UC: Distal tubular segments of the rabbit kidney after adaptation to altered Na- and K-intake. II. Changes in Na-K-ATPase activity. Cell Tissue Res 224: 493– 504, 1982 [DOI] [PubMed] [Google Scholar]
- 15. Garg LC, Knepper MA, Burg MB: Mineralocorticoid effects on Na-K-ATPase in individual nephron segments. Am J Physiol 240: F536– F544, 1981 [DOI] [PubMed] [Google Scholar]
- 16. Tsuchiya K, Giebisch G, Welling PA: Aldosterone-dependent regulation of Na-K-ATPase subunit mRNA in the rat CCD: Competitive PCR analysis. Am J Physiol 271: F7– F15, 1996 [DOI] [PubMed] [Google Scholar]
- 17. Hayhurst RA, O'Neil RG: Time-dependent actions of aldosterone and amiloride on Na+-K+-ATPase of cortical collecting duct. Am J Physiol 254: F689– F696, 1988 [DOI] [PubMed] [Google Scholar]
- 18. Ridderstrale Y, Kashgarian M, Koeppen B, Giebisch G, Stetson D, Ardito T, Stanton B: Morphological heterogeneity of the rabbit collecting duct. Kidney Int 34: 665– 670, 1988 [DOI] [PubMed] [Google Scholar]
- 19. Holthofer H, Schulte BA, Pasternack G, Siegel GJ, Spicer SS: Three distinct cell populations in rat kidney collecting duct. Am J Physiol 253: C323– C328, 1987 [DOI] [PubMed] [Google Scholar]
- 20. Sabolic I, Herak-Kramberger CM, Breton S, Brown D: Na/K-ATPase in intercalated cells along the rat nephron revealed by antigen retrieval. J Am Soc Nephrol 10: 913– 922, 1999 [DOI] [PubMed] [Google Scholar]
- 21. Sampaio MS, Bezerra IP, Pecanha FL, Fonseca PH, Capella MA, Lopes AG: Lack of Na(+),K (+)-ATPase expression in intercalated cells may be compensated by Na(+)-ATPase: A study on M. Cell Mol Life Sci 65: 3093– 3099, 2008 [DOI] [PMC free article] [PubMed] [Google Scholar]
- 22. Pluznick JL, Sansom SC: BK channels in the kidney: Role in K(+) secretion and localization of molecular components. Am J Physiol Renal Physiol 291: F517– F529, 2006 [DOI] [PubMed] [Google Scholar]
- 23. Feraille E, Mordasini D, Gonin S, Deschenes G, Vinciguerra M, Doucet A, Vandewalle A, Summa V, Verrey F, Martin PY: Mechanism of control of Na-K-ATPase in principal cells of the mammalian collecting duct. Ann NY Acad Sci 986: 570– 578, 2003 [DOI] [PubMed] [Google Scholar]
- 24. Howard MA, Roberts N, Garcia-Finana M, Cowell PE: Volume estimation of prefrontal cortical subfields using MRI and stereology. Brain Res Brain Res Protoc 10: 125– 138, 2003 [DOI] [PubMed] [Google Scholar]
- 25. Grimm PR, Foutz RM, Brenner R, Sansom SC: Identification and localization of BK-beta subunits in the distal nephron of the mouse kidney. Am J Physiol Renal Physiol 293: F350– F359, 2007 [DOI] [PubMed] [Google Scholar]
- 26. Sausbier M, Arntz C, Bucurenciu I, Zhao H, Zhou XB, Sausbier U, Feil S, Kamm S, Essin K, Sailer CA, Abdullah U, Krippeit-Drews P, Feil R, Hofmann F, Knaus HG, Kenyon C, Shipston MJ, Storm JF, Neuhuber W, Korth M, Schubert R, Gollasch M, Ruth P: Elevated blood pressure linked to primary hyperaldosteronism and impaired vasodilation in BK channel-deficient mice. Circulation 112: 60– 68, 2005 [DOI] [PubMed] [Google Scholar]
- 27. Grimm PR, Irsik DL, Settles DC, Holtzclaw JD, Sansom SC: Hypertension of Kcnmb1−/− is linked to deficient K secretion and aldosteronism. Proc Natl Acad Sci U S A 106: 11800– 11805, 2009 [DOI] [PMC free article] [PubMed] [Google Scholar]
- 28. Grimm PR, Irsik DL, Liu L, Holtzclaw JD, Sansom SC: Role of BKbeta1 in Na+ reabsorption by cortical collecting ducts of Na+-deprived mice. Am J Physiol Renal Physiol 297: F420– F428, 2009 [DOI] [PMC free article] [PubMed] [Google Scholar]
- 29. Barrett PQ, Isales CM, Bollag WB, McCarthy RT: Ca2+ channels and aldosterone secretion: Modulation by K+ and atrial natriuretic peptide. Am J Physiol 261: F706– F719, 1991 [DOI] [PubMed] [Google Scholar]
- 30. Szalay KS, Beck M, Toth M, de CR: Interactions between ouabain, atrial natriuretic peptide, angiotensin-II and potassium: Effects on rat zona glomerulosa aldosterone production. Life Sci 62: 1845– 1852, 1998 [DOI] [PubMed] [Google Scholar]
- 31. Isales CM, Bollag WB, Kiernan LC, Barrett PQ: Effect of ANP on sustained aldosterone secretion stimulated by angiotensin II. Am J Physiol 256: C89– C95, 1989 [DOI] [PubMed] [Google Scholar]
- 32. Good DW, Wright FS: Luminal influences on potassium secretion: Sodium concentration and fluid flow rate. Am J Physiol 236: F192– F205, 1979 [DOI] [PubMed] [Google Scholar]
- 33. Wright FS: Flow-dependent transport processes: Filtration, absorption, secretion. Am J Physiol 243: F1– 11, 1982 [DOI] [PubMed] [Google Scholar]
- 34. Engbretson BG, Stoner LC: Flow-dependent potassium secretion by rabbit cortical collecting tubule in vitro. Am J Physiol 253: F896– F903, 1987 [DOI] [PubMed] [Google Scholar]
- 35. Martin GE, Hendrickson LM, Penta KL, Friesen RM, Pietrzykowski AZ, Tapper AR, Treistman SN: Identification of a BK channel auxiliary protein controlling molecular and behavioral tolerance to alcohol. Proc Natl Acad Sci U S A 105: 17543– 17548, 2008 [DOI] [PMC free article] [PubMed] [Google Scholar]
- 36. Satlin LM, Sheng S, Woda CB, Kleyman TR: Epithelial Na(+) channels are regulated by flow. Am J Physiol Renal Physiol 280: F1010– F1018, 2001 [DOI] [PubMed] [Google Scholar]
- 37. DeMaio L, Chang YS, Gardner TW, Tarbell JM, Antonetti DA: Shear stress regulates occludin content and phosphorylation. Am J Physiol Heart Circ Physiol 281: H105– H113, 2001 [DOI] [PubMed] [Google Scholar]
- 38. Colgan OC, Ferguson G, Collins NT, Murphy RP, Meade G, Cahill PA, Cummins PM: Regulation of bovine brain microvascular endothelial tight junction assembly and barrier function by laminar shear stress. Am J Physiol Heart Circ Physiol 292: H3190– H3197, 2007 [DOI] [PubMed] [Google Scholar]
- 39. Kahle KT, MacGregor GG, Wilson FH, Van Hoek AN, Brown D, Ardito T, Kashgarian M, Giebisch G, Hebert SC, Boulpaep EL, Lifton RP: Paracellular Cl− permeability is regulated by WNK4 kinase: Insight into normal physiology and hypertension. Proc Natl Acad Sci U S A 101: 14877– 14882, 2004 [DOI] [PMC free article] [PubMed] [Google Scholar]
- 40. Fujii Y, Mujais SK, Katz AI: Renal potassium adaptation: Role of the Na+-K+ pump in rat cortical collecting tubules. Am J Physiol 256: F279– F284, 1989 [DOI] [PubMed] [Google Scholar]
- 41. Garg LC, Narang N: Effects of potassium bicarbonate on distal nephron Na-K-ATPase in adrenalectomized rabbits. Pfugers Arch 409: 126– 131, 1987 [DOI] [PubMed] [Google Scholar]
- 42. Palmer LG, Antonian L, Frindt G: Regulation of apical K and Na channels and Na/K pumps in rat cortical collecting tubule by dietary K. J Gen Physiol 104: 693– 710, 1994 [DOI] [PMC free article] [PubMed] [Google Scholar]
- 43. Akimova OA, Taurin S, Dulin NO, Orlov SN: Purinergic inhibition of Na(+),K (+),Cl (−) cotransport in C11-MDCK cells: Role of stress-activated protein kinases. Purinergic Signal 4: 183– 191, 2008 [DOI] [PMC free article] [PubMed] [Google Scholar]
- 44. Muto S, Giebisch G, Sansom S: Effects of adrenalectomy on CCD: Evidence for differential response of two cell types. Am J Physiol 253: F742– F752, 1987 [DOI] [PubMed] [Google Scholar]
- 45. Koeppen BM: Electrophysiological identification of principal and intercalated cells in the rabbit outer medullary collecting duct. Pflugers Archiv European J Physiol 409: 138– 141, 1987 [DOI] [PubMed] [Google Scholar]
- 46. Muto S, Yasoshima K, Yoshitomi K, Imai M, Asano Y: Electrophysiological identification of alpha- and beta-intercalated cells and their distribution along the rabbit distal nephron segments. J Clin Invest 86: 1829– 1839, 1990 [DOI] [PMC free article] [PubMed] [Google Scholar]
- 47. Ohshiro K, Yaoita E, Yoshida Y, Fujinaka H, Matsuki A, Kamiie J, Kovalenko P, Yamamoto T: Expression and immunolocalization of AQP6 in intercalated cells of the rat kidney collecting duct. Arch Histol Cytol 64: 329– 338, 2001 [DOI] [PubMed] [Google Scholar]
- 48. Holtzclaw JD, Rigle JD, Irsik DL, Grimm PR, Sansom SC: The BK channel in intercalated cells mediates shear stress induced ATP dependent K efflux [Abstract]. FASEB J 23: LB146, 2009 [Google Scholar]
- 49. Wu L, Gao X, Brown RC, Heller S, O'Neil RG: Dual role of the TRPV4 channel as a sensor of flow and osmolality in renal epithelial cells. Am J Physiol Renal Physiol 293: F1699– F1713, 2007 [DOI] [PubMed] [Google Scholar]
- 50. Liu W, Morimoto T, Woda C, Kleyman TR, Satlin LM: Ca2+ dependence of flow-stimulated K secretion in the mammalian cortical collecting duct. Am J Physiol Renal Physiol 293: F227– F235, 2007 [DOI] [PubMed] [Google Scholar]
- 51. Montrose-Rafizadeh C, Guggino WB: Role of intracellular calcium in volume regulation by rabbit medullary thick ascending limb cells. Am J Physiol 260: F402– F409, 1991 [DOI] [PubMed] [Google Scholar]
- 52. Brenner R, Chen QH, Vilaythong A, Toney GM, Noebels JL, Aldrich RW: BK channel beta4 subunit reduces dentate gyrus excitability and protects against temporal lobe seizures. Nature Neurosci 8: 1752– 1759, 2005 [DOI] [PubMed] [Google Scholar]
- 53. Wei P, Lane PH, Lane JT, Padanilam BJ, Sansom SC: Glomerular structural and functional changes in a high-fat diet mouse model of early-stage type 2 diabetes. Diabetologia 47: 1541– 1549, 2004 [DOI] [PubMed] [Google Scholar]
- 54. Pressley TA: Phylogenetic conservation of isoform-specific regions within alpha-subunit of Na(+)-K(+)-ATPase. Am J Physiol 262: C743– C751, 1992 [DOI] [PubMed] [Google Scholar]
- 55. Loffing J, Loffing-Cueni D, Valderrabano V, Klausli L, Hebert SC, Rossier BC, Hoenderop JG, Bindels RJ, Kaissling B: Distribution of transcellular calcium and sodium transport pathways along mouse distal nephron. Am J Physiol Renal Physiol 281: F1021– F1027, 2001 [DOI] [PubMed] [Google Scholar]
- 56. Loffing J, Kaissling B: Sodium and calcium transport pathways along the mammalian distal nephron: from rabbit to human. Am J Physiol Renal Physiol 284: F628– F643, 2003 [DOI] [PubMed] [Google Scholar]
- 57. Zharkikh L, Zhu X, Stricklett PK, Kohan DE, Chipman G, Breton S, Brown D, Nelson RD: Renal principal cell-specific expression of green fluorescent protein in transgenic mice. Am J Physiol Renal Physiol 283: F1351– F1364, 2002 [DOI] [PubMed] [Google Scholar]
Associated Data
This section collects any data citations, data availability statements, or supplementary materials included in this article.