

Abstract
The role of spike rate versus timing codes in visual target selection is unclear. We simultaneously recorded activity from multiple frontal eye field neurons and asked whether they interacted to select targets from distractors during visual search. When both neurons in a pair selected the target and had overlapping receptive fields (RFs), they cooperated more than when one or neither neuron in the pair selected the target, measured by positive spike timing correlations using joint peristimulus time histogram analysis. The amount of cooperation depended on the location of the search target: it was higher when the target was inside both neurons' RFs than when it was inside one RF but not the other, or outside both RFs. Elevated spike timing coincidences occurred at the time of attentional selection of the target as measured by average modulation of discharge rates. We observed competition among neurons with spatially non-overlapping RFs, measured by negative spike timing correlations. Thus, we provide evidence for dynamic and task-dependent cooperation and competition among frontal eye field neurons during visual target selection.
Introduction
Complex behavior is the result of interactions among neurons in different brain areas. Saccadic visual search is one behavior ideal for understanding the role of neuronal interactions in perceptual decision making. Several studies have shown functional correlations between pairs of neurons involved in perception and decisions (Ts'o et al., 1986; Engel et al., 1991a; 1991b; Ahissar et al., 1992; Zohary et al., 1994; Vaadia et al., 1995; Snider et al., 1998; Das and Gilbert, 1999; Narayanan and Laubach, 2006; Samonds et al., 2006; Cohen et al., 2007; Poulet and Petersen, 2008; Stark et al., 2008), but it is unclear to what degree these correlations are dynamic and how they depend on task demands.
During visual search for a target among distractors, the brain must allocate attention to the target while filtering out distractor objects (Wolfe, 1998). Do cortical neurons that discriminate between a search target and distractors interact to select the target, or do they each select the target independently? To answer this, we investigated the role of spike synchrony in visual target selection in the macaque frontal eye field (FEF). Visually responsive FEF neurons signal the location of a target of visual search by increasing activity with the target inside their receptive field (RF) relative to when a distractor is in the RF (Schall and Hanes, 1993; Schall et al., 1995; Thompson et al., 1996; Sato et al., 2001; Sato and Schall, 2003; Cohen et al., 2009a). We recorded activity from multiple FEF neurons simultaneously and measured spike rate and timing correlations between pairs of neurons.
We show that when both neurons in a pair selected the target of search and had overlapping RFs, they cooperated through spike timing synchrony when the target was inside the intersection of both neurons' RFs around the time when each neuron selected the target as measured by its firing rate. Furthermore, when both neurons in a pair selected the target of search and had non-overlapping RFs, they competed through spike timing asynchrony when the target was inside one but not the other neuron's RF. These results reject the hypothesis that each FEF neuron selects the target independently and sends target selection signals to be pooled downstream. Rather, FEF neurons cooperate and compete to select targets during visual search, suggesting that spike timing, as well as spike rate, conveys information about target location.
Materials and Methods
Behavioral task and recordings
We recorded activity from pairs or groups of FEF neurons in both hemispheres of three male macaques (Macaca radiata) during color and form visual search tasks of varying difficulty (Table 1). Because we analyzed spike timing relationships in pairs of neurons, many neurons contributed data to more than one pair (107 of 208). However, because the proportion of neurons contributing to the pairs of interest (the rightmost three columns in Table 1) was smaller (36 of 164), we removed the neurons contributing data to multiple pairs and found similar results, albeit with weaker effects. Thus, we present data with those neurons included.
Table 1.
Numbers of neurons and pairs of neurons in each analysis of visual search data
| Monkey | Recording sessions | Total |
Both neurons selecttarget |
One neuron selects target |
Neither neuron selectstarget |
||||
|---|---|---|---|---|---|---|---|---|---|
| Pairs | Neurons | Pairs | Neurons | Pairs | Neurons | Pairs | Neurons | ||
| F | 28 | 154 | 97 (75) | 17 | 25 (8) | 27 | 39 (10) | 12 | 18 (6) |
| Q | 27 | 34 | 57 (6) | 7 | 14 (0) | 8 | 15 (1) | 4 | 8 (0) |
| S | 21 | 51 | 54 (26) | 8 | 16 (0) | 14 | 18 (8) | 7 | 11 (3) |
| Total | 76 | 239 | 208 (107) | 32 | 55 (8) | 49 | 72 (19) | 23 | 37 (9) |
Numbers in parentheses indicate neurons contributing to more than one pair.
In the color search task (Fig. 1A, left), monkey F searched for a target (green disk) among seven distractors (Sato et al., 2001). Each trial began with the monkey fixating a central spot for ∼600 ms. A target was then presented at one of eight isoeccentric locations equally spaced around the fixation spot. The other seven locations contained distractor stimuli. Distractors could be red disks (efficient search) or yellow-green disks (inefficient search). The monkey was given a liquid reward for making a single saccade to the target location and fixating it for ∼400 ms.
Figure 1.
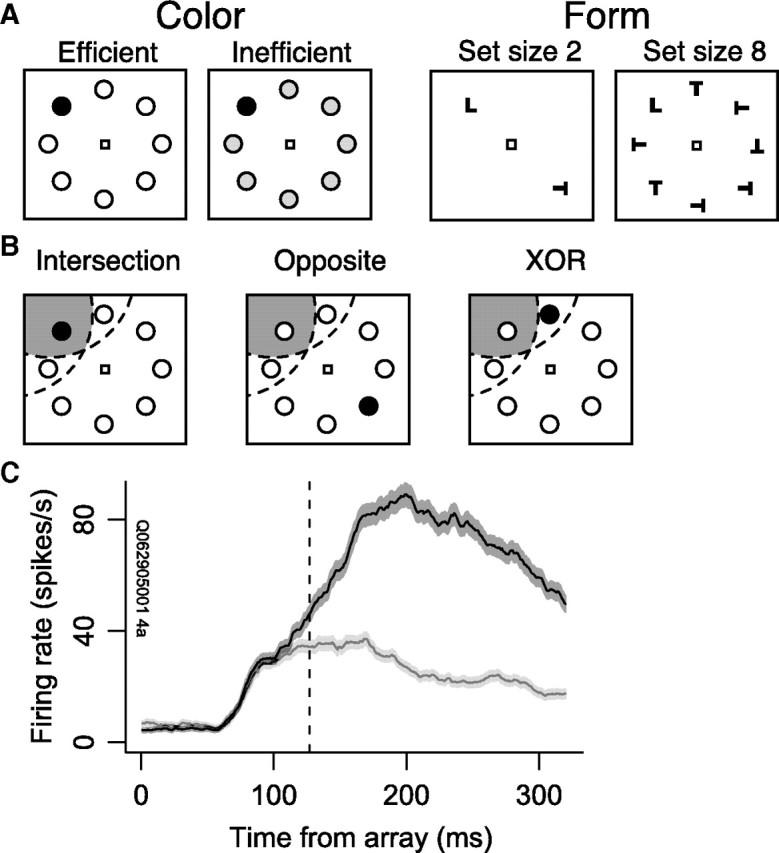
A, Color and form visual search tasks. In each task, monkeys were required to make a single saccade to the target for reward. B, Diagram of RF conditions. The dashed arcs represent the RFs of a pair of neurons. The shaded gray region represents the intersection of the RFs. The “intersection” condition occurred when the target was inside the intersection of the pair of neurons' RFs (i.e., in the shaded gray region). The “opposite” condition occurred when the target was in a location opposite the RF intersection. The “XOR” condition occurred when the target was in one neuron's RF but outside the other's RF. C, Example neuron that selected the target during the form search task. The black curve with dark bands represents the mean ± SEM firing rate when the target was inside the neuron's RF. The gray curve with light bands represents the mean ± SEM firing rate when the target was opposite the RF. Initially, the neuron's firing rate did not discriminate between target and distractors, but after 130 ms its firing rate selected the target (dashed vertical line).
In the form search task (Fig. 1A, right), monkeys Q and S searched for a target (T or L) among distractors (L or T) (Woodman et al., 2007; Cohen et al., 2009a). Distractors could be homogeneous (e.g., upright Ls) or heterogeneous (e.g., Ls oriented differently). Each trial began with the monkey fixating a central spot for ∼600 ms. A target was then presented at one of eight isoeccentric locations equally spaced around the fixation spot. The other seven locations contained 1, 3, or 7 distractor stimuli (set sizes 2, 4, and 8, respectively). The monkey was given a liquid reward for making a single saccade within 2000 ms to the target location and fixating it for 1000 ms. Across sessions the monkeys alternated between searching for Ts with Ls as distractors and Ls with Ts as distractors. Trials with incorrect behavioral responses were excluded from neural analyses. Behavioral analyses of these data have been published previously (Sato et al., 2001; Cohen et al., 2009a).
Activity from each neuron was recorded during a memory-guided saccade task to distinguish visual- from movement-related activity (Hikosaka and Wurtz, 1983; Bruce and Goldberg, 1985). The target (filled gray circle) was presented in isolation for 80–150 ms. Monkeys were required to maintain fixation for 400–1000 ms after the target onset. When the fixation spot disappeared, the monkey was rewarded for a saccade to the remembered location of the target. We used the data from the memory-guided saccade task to classify neurons according to the following criteria (Cohen et al., 2009b). Visual neurons had significantly greater activity in the 100 ms after the target flash than in the 100 ms before the target flash. Movement neurons had greater responses in the 100 ms leading up to the saccade than in the 100 ms before the target flash. Visuomovement neurons had greater responses in the 100 ms after the target flash and in the 100 ms leading up to the saccade than in the 100 ms before the target flash. All three classes of neurons were included in our preliminary analyses, as well as neurons that were not classified as visual, movement, or visuomovement.
Monkeys were surgically implanted with a head post, a subconjunctival scleral eye coil, and recording chambers. Surgery was conducted under aseptic conditions with animals under isoflurane anesthesia. Antibiotics and analgesics were administered postoperatively. All surgical and experimental procedures were in accordance with the National Institutes of Health Guide for the Care and Use of Laboratory Animals and approved by the Vanderbilt Institutional Animal Care and Use Committee. Details have been described previously (Schall et al., 1995; Sato et al., 2001; Cohen et al., 2009a).
Recordings were acquired from the rostral bank of the arcuate sulcus using tungsten microelectrodes (FHC). To confirm that electrodes were in FEF, we evoked saccades with low-threshold microstimulation (<50 μA) at each site (e.g., Bruce et al., 1985). Spikes were sorted online and offline using principal components analysis and template matching (Plexon). To ensure that spikes came from different neurons, we only analyzed pairs of neurons recorded from different electrodes. To measure the firing rate of each neuron, we used a spike density function, convolving each spike with a kernel resembling a postsynaptic potential (Thompson et al., 1996). Spike density functions were used to measure target selection time, but not in spike synchrony analyses.
Data analysis
Target selection time.
To measure the time of target selection, we used millisecond-by-millisecond Wilcoxon rank sum tests. Selection time was defined as the time at which the distribution of activity when the search target was inside a neuron's RF was significantly greater than the distribution of activity when the target was opposite the RF for 10 consecutive milliseconds with p < 0.01. For one neuron, we used a more conservative criterion of 50 consecutive milliseconds based on visual inspection of the spike-density functions. This “neuron–antineuron” approach presumes that a population of neurons in the brain representing the location of the target competes with a population of neurons representing the location of distractors opposite the target. Measuring selection time with a receiver operating characteristic analysis (Thompson et al., 1996) yielded indistinguishable results. Neurons from which we measured a target selection time were all classified as visual and visuomovement and had significant above-baseline activity during the memory delay period in the memory-guided saccade task. Fourteen neurons had phasic visual activity with no activity above baseline during the delay of the memory-guided saccade task; these neurons did not discriminate between target and distractors during the search task because their responses were too brief. There was no difference in target selection time between visual and visuomovement neurons. While movement neurons showed increased activity before a saccade was made to the target inside of their movement field relative to a distractor outside of their movement field, this activity was not considered “target selective” because these neurons select the endpoint of the saccade, not the location of the target (Thompson et al., 1997; Murthy et al., 2001; Sato and Schall, 2003; Schall, 2004). Indeed, we observed that these neurons fired at their baseline rate when a saccade was made outside their movement fields. Thus, while we measured a “target selection time” for these movement neurons, we did not classify them as target selective; rather, they were saccade endpoint selective.
Figure 1C shows target selection in an example neuron. One of the factors of interest in this study was whether both, one, or neither neuron in a pair selected the target. Of the neurons that did not select the target, some were movement neurons that were involved in preparing saccades, some were visual or visuomovement neurons that did not select the target (typically transiently firing visual neurons) and some were not task related. Of the 208 total neurons in the dataset, 115 were visual or visuomovement neurons that selected the target.
Visuomovement index.
To quantify the strength of visual- and movement-related activity, we computed a visuomovement index for each target-selecting visual and visuomovement neuron:
where V is the average firing rate from 50 to 150 ms after target onset in the memory-guided saccade task and M is the average firing rate in the 100 ms before saccades in the memory-guided saccade task. The visuomovement index is −1 for neurons with only movement-related activity and 1 for neurons with only visual-related activity.
Spike rate noise correlations.
We measured spike rate noise correlations as the trial-by-trial spike rate correlation after the mean spike rate was subtracted from each neuron in the pair (Averbeck and Lee, 2004). The noise correlation is defined as follows:
where λj is the spike rate from the jth neuron, Λj is the mean spike rate from the jth neuron, i references a given trial, and 〈 · 〉 denotes expected value.
Spike synchrony.
We measured spike-timing relationships using joint peristimulus time histograms (JPSTHs) (Aertsen et al., 1989; Brody, 1999a,b). The shuffle-corrected, normalized JPSTH is defined as follows:
where t1 and t2 are time points within a trial, Si(t) is the spike train on the ith trial at time t, and σ(t) is the SD of the PSTHs S(t). JPSTH measures correlations in spike timing over the time course of experimental trials at varying lags between spike trains. To compute JPSTHs, we used the time from 50 ms before search array onset to the 90th percentile of the saccade response time distribution for a given pair of neurons. We used a 1 ms bin width for spike counts to search for precise spike timing relationships. To visualize trends in the JPSTH matrix, we applied a two-dimensional mean filter with a 10 × 10 square kernel (see Fig. 3); all statistical tests were performed on unfiltered data. Figure 3 shows the normalized JPSTH (JN in the above equation).
Figure 3.

A, JPSTH of a pair of target-selecting visual neurons (left panel) and a pair of simulated neurons with the same mean firing rates (right panel; see Materials and Methods). The color plots are JPSTH matrices. The gray histograms to the left and below the color plot are PSTHs from the two neurons. The time axis goes from −50 ms before array onset to 244 ms after array onset (90th percentile of saccade response time distribution). The black histogram to the right of the color plot is the coincidence histogram, calculated from a ±10 ms window around the main diagonal of the JPSTH. The gray histogram in the upper right corner is the crosscorrelogram, calculated from a ±50 ms window collapsed across the main diagonal (see Materials and Methods). Dashed black lines indicate search array onset and target selection time (TST) for each neuron. Box-and-whisker plots next to each PSTH show the median, interquartile range, and the range saccade response times. Note the increase in synchrony around the time of target selection in the real neurons but not the simulated neurons, evident in the JPSTH, the coincidence histogram, and the crosscorrelogram. B, JPSTH of a pair of movement neurons. Conventions are as in A. The time axis goes from −50 ms before array onset to 315 ms after array onset (90th percentile of saccade response time distribution). Note the synchrony around the time of saccades in the real neurons but not the simulated neurons.
From the JPSTH, we extracted two measures: a crosscorrelogram, which measures the overall correlation of spike times at varying lags, and a coincidence histogram, which measures the average spike timing correlation over time. Crosscorrelograms (gray histograms in the upper right of each JPSTH in Fig. 3) and their 95% confidence intervals were computed using ±50 ms around a lag of 0 ms (Brody, 1999a,b). Crosscorrelograms were counted as significant if two consecutive values exceeded the confidence intervals. Coincidence histograms (black histograms to the right of JPSTHs in Fig. 3) were computed as the average JPSTH at ±10 ms around the main diagonal. To determine the effects of experimental manipulations on spike timing relationships, we measured the area under the crosscorrelograms in a 20 ms window around a lag of 0 ms and the area under the coincidence histograms. Each of these area measures (i.e., the integral) was the sum of the crosscorrelogram or coincidence histogram values in the appropriate time window, so that positive values were added to the area and negative values were subtracted from the area.
To avoid spurious crosscorrelation due to stimulus-induced firing rate increases, we both used an excitability correction (Brody, 1999a,b) and simulated spike trains with the same average firing rates of the neurons in our dataset. To generate a simulated spike train from a given neuron, we used that neuron's peristimulus time histogram (PSTH) as the probability of spiking at each time point over the course of a trial. For each simulated trial and time bin, we drew from a uniform [0, 1] probability distribution. If the value drawn was less than or equal to the PSTH at that time bin, the simulated trial would have a spike in that time bin. This ensured that while the average time-varying firing rate of the simulated neurons remained the same as the real neurons, the specific spike timing information was random, so any spurious JPSTH correlation caused purely by mean firing rate should also be present in the simulations. This confound is different from that controlled for by the excitability correction of Brody (1999a,b), which is why we used this additional negative control. None of the comparisons described in Results using the excitability correction or the simulated neurons were significant. Crosscorrelograms and coincidence histograms were fit with smoothing splines for visualization, but bar plots and statistics show results from unsmoothed data. All statistical tests were done with Bonferroni corrections for multiple comparisons. Analyses were done with R (http://www.r-project.org/) and Matlab (The MathWorks).
Results
We recorded from 239 pairs of neurons from different electrodes from three macaques (154 pairs from monkey F in the color search task, 34 from monkey Q in the form search task, and 51 from monkey S in the form search task). We measured spike rate and timing correlations manipulating two experimental factors. The first factor, the number of neurons in the pair that selected the search target, had three levels: both neurons in the pair selected, one neuron selected, or neither neuron selected. Note that this does not necessarily mean that both neurons in a pair selected the target on the same set of trials. We define target selection as the discrimination between target and distractor when the respective stimulus was inside a particular neuron's RF; for example, one neuron may select the target when the target is in the upper left part of visual space, while the second neuron selects the target when it is in the lower left part of visual space. The second factor, the position of the target relative to the RFs, had three levels (Fig. 1B): target inside the intersection of the RFs (“intersection”), target inside the RF of one neuron but not the other (“XOR”), or target opposite the intersection of the RFs (“opposite”). We analyzed the 104 pairs of neurons with overlapping RFs (comprised of the 32, 49, and 23 pairs in which both neurons, one neuron, or neither neuron selected the target) (see Table 1). Nine pairs of neurons had completely overlapping RFs, so there was no XOR condition for these pairs.
We defined two types of neurons: (1) visual and visuomovement neurons that selected the target from distractors (see Materials and Methods) and (2) neurons that did not select the target (some of these included movement neurons, which selected the target on correct trials but selected the distractor that was the endpoint of the saccade on incorrect trials). We recorded from 47 neurons that selected the target in the color search task and 68 that selected the target in the form search task. Table 1 shows the number of pairs of each type associated with each analysis.
Noise correlation
We first measured the spike rate noise correlation to determine whether the variability of spike rates of pairs of simultaneously recorded neurons tended to covary. Noise correlation was higher on trials when the target appeared at the intersection of the RFs than when it was opposite the intersection or in one RF but not the other (Fig. 2A) (F(2,181) = 5.1, p < 0.01).
Figure 2.
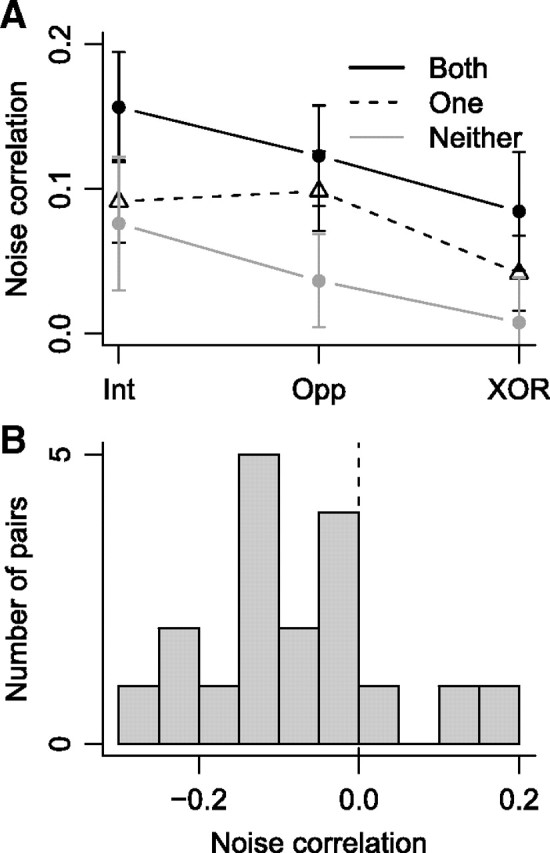
A, Mean ± SEM noise correlation between pairs of neurons in which both selected the target (black points and black lines), one selected the target (triangles and dashed lines), and neither selected the target (gray points and gray lines) when the target was inside the intersection of RFs (Int), opposite the intersection (Opp), and in one RF but not the other (XOR). B, Histogram of noise correlation values for pairs of neurons with non-overlapping RFs that both selected the target.
We next analyzed 18 pairs of neurons in which both neurons in each pair selected the target and the RFs of each pair were non-overlapping in the visual field. These pairs can be considered to comprise neurons from different pools, whereas the pairs of neurons with overlapping RFs can be considered as derived from the same pool, analogous to neurons with similar or different direction tuning in MT (Cohen and Newsome, 2008). We found negative noise correlations for these 18 pairs of neurons when the search target was in one RF but not the other (Fig. 2B) (mean ± SEM, −0.077 ± 0.026, t(17) = −2.95, p < 0.01). This indicates that signals arriving from neurons in different spatial pools in FEF exhibit a “push-pull” interaction in spike rate.
Joint peristimulus time histogram analysis
Next, we measured JPSTHs for each pair of neurons. Figure 3 shows two example JPSTHs with crosscorrelograms and coincidence histograms. In Figure 3A, the left plot shows analysis of a pair of visual neurons that selected the target in the color search task. The right plot shows analysis of simulated neurons with the same time-varying average firing rates as the two visual neurons (note the similar PSTHs between data and simulated neurons). The data clearly show synchronous firing beginning around the time of target selection (dashed lines) in the two neurons that does not appear in the analysis of simulated neurons. This is apparent in the JPSTH, coincidence histogram, and the crosscorrelogram. Figure 3B shows a pair of movement neurons recorded in the color search task with strong synchronous firing around the time of saccade onset, which does not appear in the analysis of simulated neurons with the same time-varying average firing rates.
Crosscorrelogram analysis
To measure the spike timing relationships between pairs of FEF neurons, we calculated crosscorrelograms. The crosscorrelogram measures the correlation between spiking in the pair of neurons, taking into account spurious correlations based on firing rate (see Materials and Methods), but ignoring the time course of correlations. Of the 239 pairs of neurons, 21 (8.8%) showed significant peaks in the crosscorrelogram, while none of the simulated pairs of neurons showed significant peaks, measured using 95% confidence intervals (see Materials and Methods).
Figure 4 shows crosscorrelograms from each experimental condition collapsed across task difficulty. The left column shows the crosscorrelograms and the right column shows the area under the crosscorrelograms in a window ±10 ms wide around zero lag. There was a significant effect of neuron pair type (i.e., both, one, or neither neuron in a pair selected the target; mixed-effects ANOVA, F(2,98) = 3.4, p < 0.05) and target location (i.e., intersection, XOR, or opposite; F(2,180) = 18.1, p < 0.001) on crosscorrelogram area. When both neurons in a pair selected the target (32 pairs), and the target was inside the intersection of their RFs, they showed significantly higher positive correlations than when the target was opposite the intersection (Fig. 4) (paired t(31) = 3.9, p < 0.001). The same effect held for pairs in which one neuron, but not the other, selected the target and the target was inside the intersection of the RFs versus in one RF but not the other (49 pairs; paired t(48) = 3.4, p < 0.01) or opposite the intersection (t(39) = 2.9, p < 0.01). Comparing across pair type, when the target was inside the intersection of RFs, pairs of neurons in which both selected the target showed significantly higher positive correlations than pairs in which neither neuron selected the target (Fig. 4) (Welch's t(53) = 2.2, p < 0.05).
Figure 4.
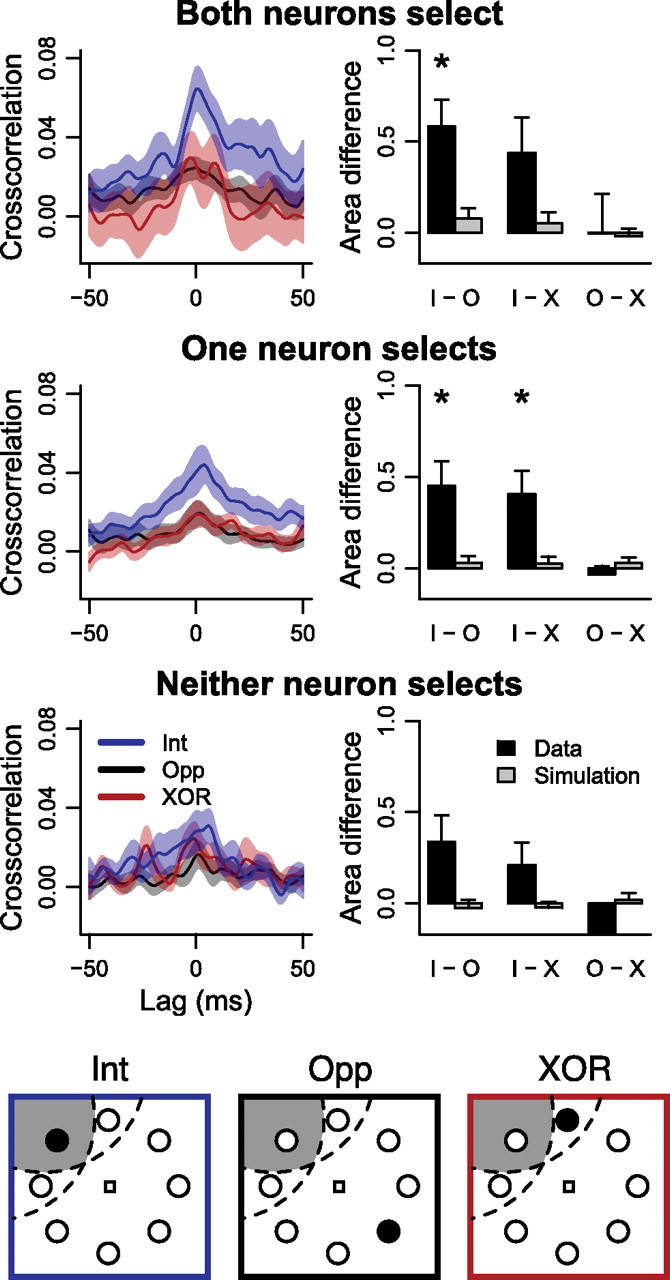
Crosscorrelograms and crosscorrelogram areas for each experimental condition, combined across task difficulty. The left column shows mean ± SEM crosscorrelograms when the target was inside the intersection of the RFs (“intersection” condition; blue), in one RF but not the other (“XOR” condition; red) and opposite the intersection of the RFs (“opposite” condition; black). The right column shows mean ± SEM of the differences in the area (i.e., integral) of the crosscorrelograms in a ±10 ms window around a lag of 0 ms for each paired comparison. Asterisks denote significance. The top row shows results from pairs in which both neurons selected the target. The middle row shows results from pairs in which one neuron, but not the other, selected the target. The bottom row shows results from pairs in which neither neuron selected the target.
To ensure that these effects were not due to changes in firing rate, we simulated neurons with the same time-varying average firing rates (see Materials and Methods). There were no significant correlations or pairwise differences in any correlations (Fig. 4, gray bars). Thus, pairs of neurons showed the strongest positive correlations when the target of search was inside both of their RFs and both neurons selected the target from distractors.
Coincidence histogram analysis
To measure the time course of spike correlations, we extracted coincidence histograms from the JPSTHs. The coincidence histogram is a measure of the time course of correlations in a window ±10 ms wide around zero lag, ignoring the spike timing relationships in terms of lag. Figure 5 shows coincidence histograms from each experimental condition collapsed across task difficulty, aligned to the time of search array onset (left column) and saccade onset (right column). Note that the increase in coincidence histograms occurred after the initial increase in firing rate in response to the onset of the search array (dashed line in Fig. 5, top left), suggesting that the increased spike timing correlations were not due solely to increased firing rates.
Figure 5.
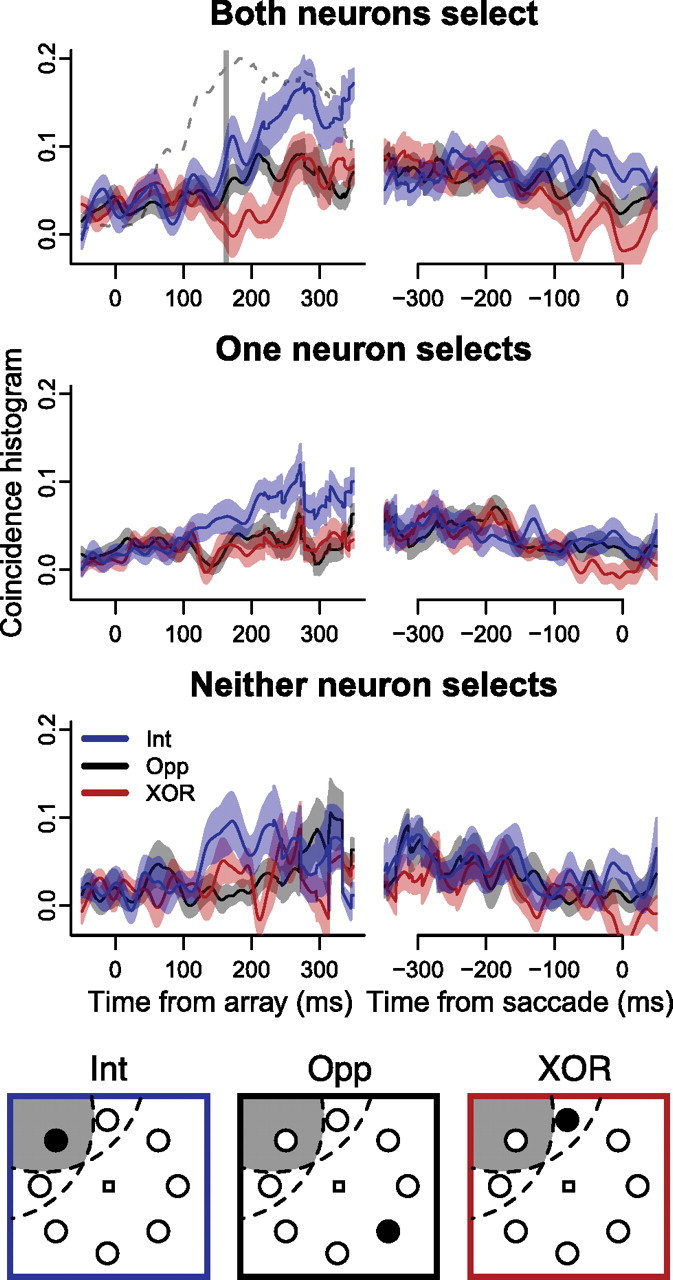
Coincidence histograms for each experimental condition, combined across task difficulty. The top row shows mean ± SEM coincidence histograms when both neurons selected the target, aligned to array onset (left) and saccade onset (right) when the target was inside the intersection of the RFs (“intersection” condition; blue), in one RF but not the other (“XOR” condition; red) and opposite the intersection of the RFs (“opposite” condition; black). The middle row shows the same when only one neuron in the pair selected the target. The bottom row shows the same when neither neuron in the pair selected the target. Vertical line indicates mean target selection time in individual neurons when both neurons selected the target. Dashed line in upper left plot shows the average firing rate when the target was inside RFs, normalized between 0 and 0.2, indicating that the increase in coincidence was not a result of the initial increase in firing rate of individual neurons.
There was a significant effect of neuron pair type (i.e., both, one, or neither neuron in a pair selected the target; mixed-effects ANOVA, F(2,98) = 3.1, p < 0.05) and target location (i.e., intersection, XOR, or opposite; F(2,195) = 26.0, p < 0.001) on coincidence histogram area. Coincidence histogram area was significantly larger when both neurons in a pair selected the target than when one or neither neuron selected the target (Welch's t(170) = 2.6 and t(151) = 3.9, p < 0.01).
Relationship to target selection time
We noticed that around the time of target selection for individual neurons (vertical gray line in Fig. 5 shows the mean target selection time), correlations rapidly increased from baseline when both neurons in a pair selected the target. Therefore, we used target selection time to divide the time course of synchrony into two intervals. The first was from array onset to target selection time, the second from target selection time to the 90th percentile of saccade response times. For pairs of neurons in which both selected the target, the first interval ended at the earlier of the two target selection times and the second interval began at the later of the two target selection times (the median difference between target selection times for these pairs was 23 ms; the median difference between target selection times from pairs of neurons recorded at different times was 30 ms, which was significantly larger measured by Wilcoxon rank sum test, p < 0.05). We measured the time course of spike synchrony in the two intervals using the area of the coincidence histogram in each (Fig. 6).
Figure 6.

Mean ± SEM area under coincidence histograms under three target location conditions (intersection, opposite, and XOR; depicted below the abscissa labels; see Fig. 1 for details) when both neurons in the pair selected the target (left panel), when one neuron selected the target (middle panel), and when neither neuron selected the target (right panel). Asterisks indicate significant differences (see Results) between RF conditions within each group of pair type (“both,” “one,” or “neither”). All coincidence histogram areas from simulated neurons were not significantly different from zero, and are not shown here. Areas are normalized by the length of the interval.
There was a significant effect of interval (before vs after target selection time) on coincidence histogram area (mixed-effects ANOVA, F(1,77) = 29.9, p < 0.001). When both neurons in a pair selected the target, there was significantly larger area in the coincidence histogram after target selection time than before selection time both when the target was inside the intersection of the RFs and when the target was opposite the RFs (paired t(31) = 5.2 and 3.1, p < 0.01). Similarly, there was significantly larger coincidence histogram area after as opposed to before selection time when one neuron in the pair selected the target and the target was inside the intersection of the RFs (paired t(48) = 4.2, p < 0.001).
Next, we tested whether there was a difference in coincidence histogram area across neuron pair types as a function of target location (intersection, opposite, or XOR) and interval (before or after target selection time) (Fig. 6). When both neurons in a pair selected the target, we found significantly larger coincidence histogram area after target selection time than when one or neither neuron in a pair selected the target. This effect was present when the target was inside the intersection of the RFs (Welch's t(62) = 2.1 and t(52) = 3.6, p < 0.05) and when the target was opposite the intersection (Welch's t(63) = 2.5 and t(53) = 3.2, p < 0.05). There were no differences between any coincidence histogram areas before target selection time, suggesting that the increase in synchrony when the target was inside the intersection of the RFs was associated with the target selection process.
There was a significant effect of target location on coincidence histogram area (F(2,156) = 22.5, p < 0.001). When the target was inside the intersection of RFs coincidence histogram area was larger than when the target was opposite the intersection (Welch's t(57) = 2.2, p < 0.05) or in one RF but not the other (t(62) = 3.4, p < 0.01) for pairs of neurons in which both selected the target. When one neuron in the pair selected the target, coincidence histogram area was larger when the target was in the intersection of RFs than when it was in one RF but not the other (t(86) = 3.3, p < 0.01).
Effects of distance between neurons
To determine whether the strength of spike timing correlations varied as a function of distance between neurons, we performed two analyses. First, we split crosscorrelograms and coincidence histograms from pairs of neurons with overlapping RFs into two groups: pairs of neurons recorded in the same hemisphere and pairs recorded in different hemispheres. Crosscorrelogram area was significantly larger for intrahemispheric versus interhemispheric pairs of neurons when the target was in the intersection of RFs (Fig. 7A) (Welch's t(79) = 2.3, p < 0.05).
Figure 7.
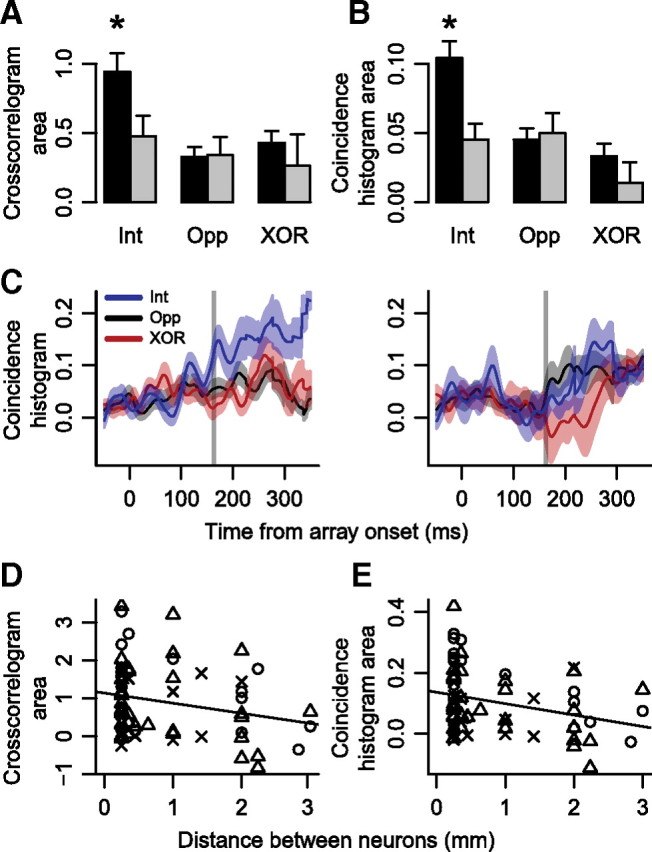
Effects of distance between neurons. A, Mean ± SEM crosscorrelogram area in a ±10 ms window around a lag of 0 ms when the target was inside the intersection of a pair of neurons' RFs (Int), opposite the intersection (Opp), and in one RF but not the other (XOR), when the pair of neurons came from the same (black bars) and different (gray bars) hemispheres. Asterisk indicates that when pairs of neurons came from the same hemisphere and the target was inside the intersection of RFs, crosscorrelogram area was the largest. B, Mean ± SEM coincidence histogram area after target selection time (gray vertical lines in C). Other conventions are as in A. C, Coincidence histograms when both neurons selected the target when the neurons were recorded in the same (left panel) and different (right panel) hemispheres. Shown are mean ± SEM coincidence histograms when the target was inside the intersection of RFs (blue), opposite the intersection (black), and in one RF but not the other (red). Vertical lines indicate mean target selection time in individual neurons when both neurons selected the target. D, Crosscorrelogram area as a function of distance between neurons when the target was in the intersection of RFs and both neurons selected the target (circles), one neuron selected the target (triangles), or neither neuron selected the target (Xs), for pairs of neurons recorded in the same hemisphere. Regression line is shown superimposed. E, Coincidence histogram area after target selection time as a function of distance between neurons recorded in the same hemisphere. Conventions are as in D.
Coincidence histogram area after target selection time, but not before, was larger within the same hemisphere than across different hemispheres. When the target was inside the intersection of the RFs, coincidence histogram area was significantly larger when the neurons were recorded from the same hemisphere than from different hemispheres (Fig. 7B,C) (Welch's t(90) = 3.5, p < 0.01). To rule out the possibility that these differences were due to differences in the magnitude of target selection between pairs of neurons in the same versus different hemispheres, we measured the firing rate difference between when the target was inside each neuron's RF and when the target was opposite the RF, yielding an index of the magnitude of target selectivity. We found no difference in the magnitude of target selection between pairs of neurons recorded in the same versus different hemispheres (Welch's t(90) = 0.44, p > 0.6). We also tested for differences in the amount of overlap between RFs of pairs of neurons in the same versus different hemispheres. ANOVAs with number of overlapping RF locations and same/different hemisphere revealed no significant effect of the number of overlapping RF locations on crosscorrelogram area (F(1,101) = 0.013, p > 0.9) or coincidence histogram area (F(1,101) = 0.059, p > 0.8).
Second, we correlated the area under the crosscorrelograms and coincidence histograms with the distance between pairs of neurons recorded in the same hemisphere. We found that area under the crosscorrelograms decreased as a function of distance between neurons (Fig. 7D) (linear regression slope = −0.27 ± 0.14, intercept = 1.13 ± 0.16, p < 0.05). Similarly, area under the coincidence histogram after target selection time decreased as a function of distance between neurons (Fig. 7E) (linear regression slope = −0.04 ± 0.01, intercept = 0.14 ± 0.02, p < 0.05).
Relationship to saccade response time
To determine whether increases in synchrony varied with saccade response time, we divided the data from each pair of neurons into two groups: trials faster than the median and slower than the median response time for each session. Previous studies have shown that these neurons select the target later with longer response times (Bichot et al., 2001; Sato et al., 2001; Cohen et al., 2009a). The increase in the coincidence histogram when the target was inside the intersection of RFs relative to when the target was inside one RF but not the other first became significant (millisecond-by-millisecond Wilcoxon signed rank test, p < 0.05) at 163 ms after array onset for fast trials (Fig. 8, dashed gray lines) (millisecond-by-millisecond Wilcoxon signed rank test, p < 0.05). For slow trials, the coincidence histogram when the target was inside the intersection of RFs exceeded that when the target was in one RF but not the other 191 ms after array onset. This earlier onset of coincidence histogram difference for fast trials than slow ones correlated with the difference in target selection time between fast and slow trials (Fig. 8, solid gray lines) (mean ± SEM fast trials, 148 ± 3.0 ms; slow trials, 188 ± 3.8 ms; Welch's t(101) = 8.2, p < 0.001). The difference in saccade response time was also significant (Fig. 8, solid black lines) (mean ± SEM fast trials, 195 ± 3.4 ms; slow trials, 304 ± 8.8 ms; Welch's t(97) = 11.4, p < 0.001). A similar pattern of effects, albeit weaker, was observed when we divided data into easy (efficient search in the color task and set size 2 in the form task) and hard (inefficient search in the color task and set size 8 in the form task) trials.
Figure 8.

Mean ± SEM coincidence histograms for pairs of neurons in which both selected the target, when the target was inside the intersection of RFs (blue) versus in one RF but not the other (red) for trials faster (left) and slower (right) than the median saccade response time in each session. Solid gray vertical lines indicate mean target selection times for individual neurons. Dashed gray vertical lines indicate the time at which the blue curves exceeded the red ones statistically (see Results). Solid black vertical lines indicate mean saccade response times.
Visuomovement index
To determine whether the strength of spike synchrony varied with the relative amount of visual- versus movement-related activity in pairs of neurons, we computed a visuomovement index for the 55 target-selecting neurons that comprised the pairs in which both selected the target. The distribution of visuomovement indices happened to be significantly larger than zero (mean ± SEM, 0.22 ± 0.06; t(54) = 3.4, p < 0.01), indicating that target-selecting neurons tended to have stronger visual- than movement-related activity during the memory-guided saccade task. There was no significant correlation between the area under the crosscorrelogram or coincidence histogram and the mean visuomovement index or difference between visuomovement indices between pairs of neurons (all p > 0.2).
Spike correlations during the memory-guided saccade task
To determine whether the observed spike timing correlations were present during saccade target selection without distractors, we calculated JPSTHs during the memory-guided saccade task for the same pairs of neurons analyzed above. Of the 32 pairs of neurons in which both selected the target, 25 of them had sufficient numbers of trials (>50) to calculate JPSTHs. For this sample of 25 pairs of neurons, we calculated crosscorrelograms and coincidence histograms (Fig. 9). There was significantly larger crosscorrelogram area when the target was in the intersection of RFs than when the target was in one RF but not the other (paired t(24) = 2.99, p < 0.01). The area under the coincidence histogram from 50 to 200 ms after the target flash was significantly larger when the target was in the intersection of RFs than when it was in one RF but not the other (paired t(24) = 3.20, p < 0.01).
Figure 9.

Mean ± SEM crosscorrelograms (top left) and coincidence histograms (bottom) aligned to target flash indicated by gray bar (left) and aligned to saccade onset (right) during the memory-guided saccade task. Data from 25 of 32 pairs of neurons with sufficient trials to compute JPSTH are shown when the target was inside the intersection of the RFs (“intersection” condition; blue), in one RF but not the other (“XOR” condition; red), and opposite the intersection of the RFs (“opposite” condition; black).
We compared the coincidence histograms between the memory-guided and visual search tasks for these 25 pairs of neurons. Coincidence histogram area was significantly larger during the search task than the memory-guided task (paired t(24) = 4.62, p < 0.01), suggesting that target-distractor competition enhanced cooperation among neurons with overlapping RFs.
Spike correlations among neurons with non-overlapping receptive fields
Thus far, we have measured spike timing correlations among pairs of neurons with overlapping RFs (i.e., from the same pool). Next, we measured JPSTH for the 18 pairs of neurons analyzed in Figure 2F: those pairs in which both neurons selected the target and the RFs were spatially non-overlapping. We found that around the time of target selection for these neurons, the coincidence histograms shifted to negative correlation values when the target was in one RF but not the other (“XOR”) relative to when the target was in neither RF (Fig. 10). This decrease was significant in the interval from target selection time to saccade (paired t(17) = 2.47, p < 0.05) but not from array onset to target selection time (paired t(17) = 1.03, p > 0.3), as measured by the area under the coincidence histogram in each interval. These results suggest that neurons with spatially non-overlapping RFs compete during target selection.
Figure 10.
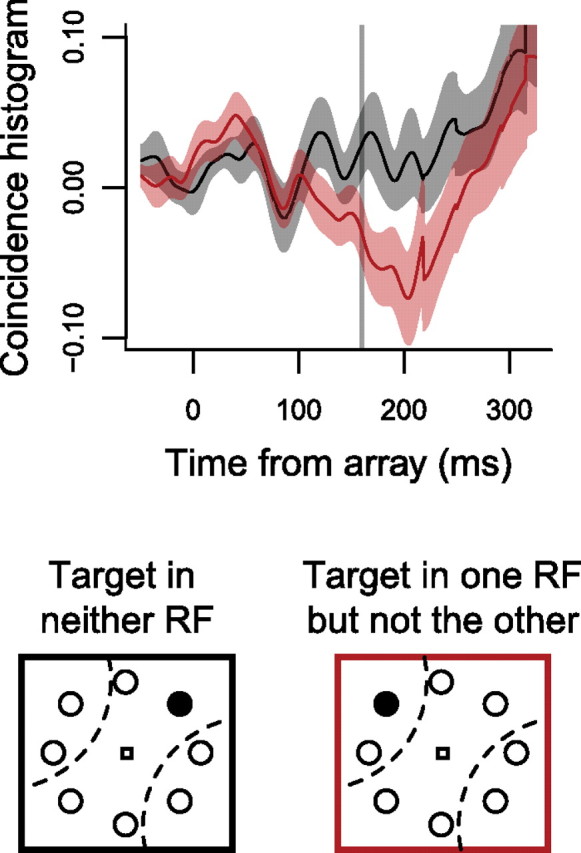
Mean ± SEM coincidence histograms for the 18 pairs of neurons with non-overlapping RFs that both selected the target, when the target was inside one RF but not the other (“XOR” condition; red), and in neither of the RFs (black).
Effects of firing rate
In the analyses reported above, we used three control analyses (shuffle correction, excitability correction, and simulation) to ensure that the spike timing relationships we observed were not due to covariations in firing rate between pairs of neurons. However, these controls do not rule out the possibility that the magnitude of spike timing correlations was related to the magnitude of the firing rates (but see Fig. 5). To test this possibility, we plotted the absolute value of the area under the crosscorrelogram as a function of the mean of the mean firing rates from search array onset to saccade onset for all pairs of neurons. Across the population of 239 pairs of neurons, we found a significant power law between crosscorrelogram area and firing rate: CCA = 0.0055 · FR1.17, where CCA is the crosscorrelogram area and FR is the mean of the mean firing rates (Fig. 11) (p < 0.001 for slope and intercept). Thus, we cannot rule out that common driving input is a source of cooperation and competition in FEF, although we cannot distinguish between this interpretation, one in which cooperation and competition occur exclusively in FEF, and a combination of the two.
Figure 11.

Log-log plot with linear regression of the absolute value of the area under crosscorrelograms versus the mean of the mean firing rates from search array onset to saccade for all 239 pairs of neurons with the target in all locations.
Discussion
We show that interactions between neurons are time varying and depend on whether and how neurons are involved in a task. Pairs of FEF neurons cooperated to select a visual search target from distractors by increasing their probability of firing synchronously when the firing rates of both neurons discriminated target from distractors and when the target was inside both of their RFs. The timing of cooperative synchrony was aligned to the presentation of the visual search array, not saccade onset (Fig. 5), suggesting that the observed synchrony was involved in target selection and not saccade preparation. This is not surprising given that this effect was present in pairs of visual and visuomovement neurons that selected the target individually. The onset of cooperative synchrony also scaled with saccade response time (Fig. 8).
We found greater cooperative synchrony in pairs of neurons located in FEF in the same versus different hemisphere and competitive synchrony in pairs of neurons with non-overlapping RFs. This supports models of selective attention that propose that populations of neurons compete for representation of stimuli (Desimone and Duncan, 1995). However, it is unclear how such models would account for our observation of weak but significant synchrony during the memory-guided saccade task, in which a single target was flashed without distractors (Fig. 9). We showed previously, using a multivariate analysis, that movement neurons were engaged in greater interactions with visual and visuomovement neurons than vice versa (Cohen et al., 2007). Although we could not assess the direction of the interactions in this study given our limited sample of movement neurons, we did find surprisingly precise timing of the onset of synchrony in target-selecting visual and visuomovement neurons that varied with RT and task difficulty (e.g., Fig. 8). This is a significant advance over Cohen et al. (2007) because the previous study did not examine the time dependence of neuronal interactions.
We observed some crosscorrelograms with broad peaks (Fig. 3B), which have been interpreted as evidence for common synaptic input or comodulation (Ts'o et al., 1986; König and Engel, 1995; Nowak et al., 1995; Averbeck and Lee, 2004). Most crosscorrelograms, however, had sharper peaks on the order of 20 ms (Figs. 3A, 4), consistent with those observed in other cortical areas across species, including primary visual cortex (Toyama et al., 1981; Ts'o et al., 1986; Das and Gilbert, 1999; DeAngelis et al., 1999; Samonds et al., 2006), visual area MT (Bair et al., 2001), inferior temporal cortex (Gochin et al., 1991), somatosensory cortex (Celikel et al., 2004; Poulet and Petersen, 2008), auditory cortex (Ahissar et al., 1992; deCharms and Merzenich, 1996; Tomita and Eggermont, 2005), gustatory cortex (Yokota and Satoh, 2001), motor cortex (Allum et al., 1982; Jackson et al., 2003; Narayanan and Laubach, 2006), and prefrontal cortex (Vaadia et al., 1995; Funahashi and Inoue, 2000; Constantinidis et al., 2001, 2002; Constantinidis and Goldman-Rakic, 2002; Narayanan and Laubach, 2006; Tsujimoto et al., 2008). These peaks probably do not reflect direct synaptic connections between pairs of recorded neurons, although the percentage of significant crosscorrelations is consistent with anatomical studies estimating the probability of corticocortical connections using probability models (Abeles, 1991) and fluorescent labeling and patch clamping (Brown and Hestrin, 2009). Recent work has shown synchrony between unconnected neurons in vitro (de la Rocha et al., 2007) and zero-lag peaks that reflect long-range synaptic connections (Vicente et al., 2008). Previous work in cat visual cortex has shown interhemispheric synchrony (Nowak et al., 1995). Thus, we do not claim that the neurons we recorded were synaptically connected, but we emphasize that at a population level these interactions are modulated by the task and could therefore contribute to the decision to select a target.
Given our observation that FEF neurons cooperate to locate a search target, how many neurons are required to make a decision about the target location? A recent study showed that weak correlations in spike timing between cortical neurons can imply strongly correlated networks of neurons (Schneidman et al., 2006). Thus, our observation of small correlation values could have profound effects in FEF population codes. Several studies report optimal or sufficient decision making with a population of 10–100 neurons (Newsome et al., 1989; Zohary et al., 1994; Shadlen et al., 1996; Shadlen and Newsome, 1998; Panzeri et al., 2003; Schoppik et al., 2008), including in FEF (Bichot et al., 2001). Thus, models of networks of neurons that do not account for weak but informative temporal correlations between neurons may overestimate the amount of information a population can encode (Panzeri et al., 1999; Pouget et al., 2000; Averbeck and Lee, 2004; Averbeck et al., 2006). Indeed, a previous study of FEF neurons found that 7–14 neurons were sufficient to select a search target from distractors; they noted that this may have been an underestimate because they did not account for neuronal correlations (Bichot et al., 2001).
We measured noise correlation to determine whether variability in spiking was correlated trial by trial. Previous studies have shown that noise correlation depends on the amount of time used to calculate it (Reich et al., 2001; Constantinidis and Goldman-Rakic, 2002; Averbeck and Lee, 2003, 2004), so we used the spike rates from search array onset to saccade, scaled by that duration. A previous study of MT neurons showed noise correlation values of about 0.12 for pairs of neighboring neurons (Zohary et al., 1994). We find similar values of noise correlation in FEF, but the precise values vary as a function of neurons' involvement in a task (Fig. 2A) for pairs of neurons recorded as far away as opposite hemispheres.
Our noise correlation results suggest that population coding models need to be modified to account for positive and negative noise correlations among neurons in the same versus different pool, respectively. Recent work has shown that MT neurons representing different pools (disparate motion direction preferences) have lower noise correlation values than pairs of neurons representing the same pool (neurons with similar motion direction preferences) (Zohary et al., 1994; Cohen and Newsome, 2008, 2009). Analogously, we may define pairs of neurons with overlapping RFs as part of the same pool and neurons with non-overlapping RFs as belonging to different pools. FEF neurons tend to have contralateral RFs (Mohler et al., 1973; Bruce and Goldberg, 1985; Schall, 1991), so it may be natural to think of each FEF as representing a different population of neurons involved in target selection and attention. Our data are consistent with a model in which neurons with spatially overlapping RFs excite each other as well as a population of interneurons that inhibit neurons with nonoverlapping RFs (Fig. 12).
Figure 12.

Circuit illustrating interactions among FEF neurons representing the target (in the left visual field, represented by right FEF) and distractors during visual search. Large shaded circles represent excitatory neurons. Small shaded circles represent inhibitory interneurons. V-shaped symbols represent excitatory synapses. Small black circles represent inhibitory synapses. Solid lines represent strong connections. Dotted lines represent weak connections. Dashed lines in the search array represent the RFs of the pair of excitatory neurons in each FEF.
Of course, FEF is not the only brain area containing target-selecting neurons. Neurons in posterior parietal cortex (e.g., Constantinidis and Steinmetz, 2001; Thomas and Paré, 2007) and superior colliculus (e.g., McPeek and Keller, 2002) show similar behavior during visual search tasks. The question arises, then, whether neurons in these areas also cooperate to select targets, and how the three areas interact. One hypothesis is that neurons in all three areas cooperate independently within each area and are then pooled downstream (in the superior colliculus, for example). An alternative hypothesis is that neurons in all three areas interact as one large population of target-selecting neurons. Multiple-neuron recordings are required to address this question and, given their anatomical connections, it seems likely that a combination of the two hypotheses is at work. A third hypothesis is that the spike timing correlations we observed did not originate in FEF but instead are due to common input from areas that project to FEF. The power law between crosscorrelation magnitude and firing rate (Fig. 11) and the increased noise correlation for pairs of neurons in the same pool (Fig. 2) are consistent with this hypothesis. Future experiments can distinguish between common input versus local interactions as the source of cooperation and competition in FEF by stimulating or inactivating areas that project to FEF.
In conclusion, we wish to draw a speculative analogy that we believe relates our findings to decision-making studies across different scientific fields. Increased synchrony around the time of target selection may signal formation of a quorum, a feature of many biological systems (Couzin, 2009), including groups of ants (Pratt et al., 2002), bees (Seeley and Visscher, 2004; Passino et al., 2008), bacteria (Waters and Bassler, 2005), and yeast (De Monte et al., 2007). Individuals in a group (e.g., neurons) do not need to know the outcome of the group decision; each individual signals its choice based on local interactions with other individuals, and the decision forms, often very quickly (Taylor et al., 2009). We suggest that it may be useful to view the self-organization evident in neuronal interactions within a framework used by behavioral ecologists to understand large-scale biological patterns.
Footnotes
This work was supported by National Institutes of Health Grants T32-MH064913, T32-EY007135, R01-EY08890, P30-EY08126, and P30-HD015052, the McKnight Endowment Fund for Neuroscience, and Robin and Richard Patton through the E. Bronson Ingram Chair in Neuroscience. We thank J. Haitas for programming assistance and R. Marois, M. Paré, and M. Wallace for insightful discussions.
References
- Abeles M. Corticonics: neural circuits of the cerebral cortex. Cambridge: Cambridge UP; 1991. [Google Scholar]
- Aertsen AM, Gerstein GL, Habib MK, Palm G. Dynamics of neuronal firing correlation: modulation of “effective connectivity”. J Neurophysiol. 1989;61:900–917. doi: 10.1152/jn.1989.61.5.900. [DOI] [PubMed] [Google Scholar]
- Ahissar M, Ahissar E, Bergman H, Vaadia E. Encoding of sound-source location and movement: activity of single neurons and interactions between adjacent neurons in the monkey auditory cortex. J Neurophysiol. 1992;67:203–215. doi: 10.1152/jn.1992.67.1.203. [DOI] [PubMed] [Google Scholar]
- Allum JHJ, Hepp-Reymond M-C, Gysin R. Cross-correlation analysis of interneuronal connectivity in the motor cortex of the monkey. Brain Res. 1982;231:325–334. doi: 10.1016/0006-8993(82)90369-9. [DOI] [PubMed] [Google Scholar]
- Averbeck BB, Lee D. Neural noise and movement-related codes in the macaque supplementary motor area. J Neurosci. 2003;23:7630–7641. doi: 10.1523/JNEUROSCI.23-20-07630.2003. [DOI] [PMC free article] [PubMed] [Google Scholar]
- Averbeck BB, Lee D. Coding and transmission of information by neural ensembles. Trends Neurosci. 2004;27:225–230. doi: 10.1016/j.tins.2004.02.006. [DOI] [PubMed] [Google Scholar]
- Averbeck BB, Latham PE, Pouget A. Neural correlations, population coding and computation. Nat Rev Neurosci. 2006;7:358–366. doi: 10.1038/nrn1888. [DOI] [PubMed] [Google Scholar]
- Bair W, Zohary E, Newsome WT. Correlated firing in macaque visual area MT: time scales and relationship to behavior. J Neurosci. 2001;21:1676–1697. doi: 10.1523/JNEUROSCI.21-05-01676.2001. [DOI] [PMC free article] [PubMed] [Google Scholar]
- Bichot NP, Thompson KG, Chenchal Rao S, Schall JD. Reliability of macaque frontal eye field neurons signaling saccade targets during visual search. J Neurosci. 2001;21:713–725. doi: 10.1523/JNEUROSCI.21-02-00713.2001. [DOI] [PMC free article] [PubMed] [Google Scholar]
- Brody CD. Correlations without synchrony. Neural Comput. 1999a;11:1537–1551. doi: 10.1162/089976699300016133. [DOI] [PubMed] [Google Scholar]
- Brody CD. Disambiguating different covariation types. Neural Comput. 1999b;11:1527–1535. doi: 10.1162/089976699300016124. [DOI] [PubMed] [Google Scholar]
- Brown SP, Hestrin S. Intracortical circuits of pyramidal neurons reflect their long-range axonal targets. Nature. 2009;457:1133–1136. doi: 10.1038/nature07658. [DOI] [PMC free article] [PubMed] [Google Scholar]
- Bruce CJ, Goldberg ME. Primate frontal eye fields. I. Single neurons discharging before saccades. J Neurophysiol. 1985;53:603–635. doi: 10.1152/jn.1985.53.3.603. [DOI] [PubMed] [Google Scholar]
- Bruce CJ, Goldberg ME, Bushnell MC, Stanton GB. Primate frontal eye fields. II. Physiological and anatomical correlates of electrically evoked eye movements. J Neurophysiol. 1985;54:714–734. doi: 10.1152/jn.1985.54.3.714. [DOI] [PubMed] [Google Scholar]
- Celikel T, Szostak VA, Feldman DE. Modulation of spike timing by sensory deprivation during induction of cortical map plasticity. Nat Neurosci. 2004;7:534–541. doi: 10.1038/nn1222. [DOI] [PMC free article] [PubMed] [Google Scholar]
- Cohen JY, Pouget P, Woodman GF, Subraveti CR, Schall JD, Rossi AF. Difficulty of visual search modulates neuronal interactions and response variability in the frontal eye field. J Neurophysiol. 2007;98:2580–2587. doi: 10.1152/jn.00522.2007. [DOI] [PubMed] [Google Scholar]
- Cohen JY, Heitz RP, Woodman GF, Schall JD. Neural basis of the set-size effect in frontal eye field: timing of attention during visual search. J Neurophysiol. 2009a;101:1699–1704. doi: 10.1152/jn.00035.2009. [DOI] [PMC free article] [PubMed] [Google Scholar]
- Cohen JY, Pouget P, Heitz RP, Woodman GF, Schall JD. Biophysical support for functionally distinct cell types in the frontal eye field. J Neurophysiol. 2009b;101:912–916. doi: 10.1152/jn.90272.2008. [DOI] [PMC free article] [PubMed] [Google Scholar]
- Cohen MR, Newsome WT. Context-dependent changes in functional circuitry in visual area MT. Neuron. 2008;60:162–173. doi: 10.1016/j.neuron.2008.08.007. [DOI] [PMC free article] [PubMed] [Google Scholar]
- Cohen MR, Newsome WT. Estimates of the contribution of single neurons to perception depend on timescale and noise correlation. J Neurosci. 2009;29:6635–6648. doi: 10.1523/JNEUROSCI.5179-08.2009. [DOI] [PMC free article] [PubMed] [Google Scholar]
- Constantinidis C, Goldman-Rakic PS. Correlated discharges among putative pyramidal neurons and interneurons in the primate prefrontal cortex. J Neurophysiol. 2002;88:3487–3497. doi: 10.1152/jn.00188.2002. [DOI] [PubMed] [Google Scholar]
- Constantinidis C, Steinmetz MA. Neuronal responses in area 7a to multiple-stimulus displays: I. Neurons encode the location of the salient stimulus. Cereb Cortex. 2001;11:581–591. doi: 10.1093/cercor/11.7.581. [DOI] [PubMed] [Google Scholar]
- Constantinidis C, Franowicz MN, Goldman-Rakic PS. Coding specificity in cortical microcircuits: a multiple-electrode analysis of primate prefrontal cortex. J Neurosci. 2001;21:3646–3655. doi: 10.1523/JNEUROSCI.21-10-03646.2001. [DOI] [PMC free article] [PubMed] [Google Scholar]
- Constantinidis C, Williams GV, Goldman-Rakic PS. A role for inhibition in shaping the temporal flow of information in prefrontal cortex. Nat Neurosci. 2002;5:175–180. doi: 10.1038/nn799. [DOI] [PubMed] [Google Scholar]
- Couzin ID. Collective cognition in animal groups. Trends Cogn Sci. 2009;13:36–43. doi: 10.1016/j.tics.2008.10.002. [DOI] [PubMed] [Google Scholar]
- Das A, Gilbert CD. Topography of contextual modulations mediated by short-range interactions in primary visual cortex. Nature. 1999;399:655–661. doi: 10.1038/21371. [DOI] [PubMed] [Google Scholar]
- DeAngelis GC, Ghose GM, Ohzawa I, Freeman RD. Functional micro-organization of primary visual cortex: receptive field analysis of nearby neurons. J Neurosci. 1999;19:4046–4064. doi: 10.1523/JNEUROSCI.19-10-04046.1999. [DOI] [PMC free article] [PubMed] [Google Scholar]
- deCharms RC, Merzenich MM. Primary cortical representation of sounds by the coordination of action-potential timing. Nature. 1996;381:610–613. doi: 10.1038/381610a0. [DOI] [PubMed] [Google Scholar]
- de la Rocha J, Doiron B, Shea-Brown E, Josić K, Reyes A. Correlation between neural spike trains increases with firing rate. Nature. 2007;448:802–806. doi: 10.1038/nature06028. [DOI] [PubMed] [Google Scholar]
- De Monte S, d'Ovidio F, Danø S, Sørensen PG. Dynamical quorum sensing: population density encoded in cellular dynamics. Proc Natl Acad Sci U S A. 2007;104:18377–18381. doi: 10.1073/pnas.0706089104. [DOI] [PMC free article] [PubMed] [Google Scholar]
- Desimone R, Duncan J. Neural mechanisms of selective visual attention. Annu Rev Neurosci. 1995;18:193–222. doi: 10.1146/annurev.ne.18.030195.001205. [DOI] [PubMed] [Google Scholar]
- Engel AK, König P, Singer W. Direct physiological evidence for scene segmentation by temporal coding. Proc Natl Acad Sci U S A. 1991a;88:9136–9140. doi: 10.1073/pnas.88.20.9136. [DOI] [PMC free article] [PubMed] [Google Scholar]
- Engel AK, Kreiter AK, König P, Singer W. Synchronization of oscillatory neuronal responses between striate and extrastriate visual cortical areas of the cat. Proc Natl Acad Sci U S A. 1991b;88:6048–6052. doi: 10.1073/pnas.88.14.6048. [DOI] [PMC free article] [PubMed] [Google Scholar]
- Funahashi S, Inoue M. Neuronal interactions related to working memory processes in the primate prefrontal cortex revealed by cross-correlation analysis. Cereb Cortex. 2000;10:535–551. doi: 10.1093/cercor/10.6.535. [DOI] [PubMed] [Google Scholar]
- Gochin PM, Miller EK, Gross CG, Gerstein GL. Functional interactions among neurons in inferior temporal cortex of the awake macaque. Exp Brain Res. 1991;84:505–516. doi: 10.1007/BF00230962. [DOI] [PubMed] [Google Scholar]
- Hikosaka O, Wurtz RH. Visual and oculomotor functions of monkey substantia nigra pars reticulata. III. Memory-contingent visual and saccade responses. J Neurophysiol. 1983;49:1268–1284. doi: 10.1152/jn.1983.49.5.1268. [DOI] [PubMed] [Google Scholar]
- Jackson A, Gee VJ, Baker SN, Lemon RN. Synchrony between neurons with similar muscle fields in monkey motor cortex. Neuron. 2003;38:115–125. doi: 10.1016/s0896-6273(03)00162-4. [DOI] [PubMed] [Google Scholar]
- König P, Engel AK. Correlated firing in sensory-motor systems. Curr Opin Neurobiol. 1995;5:511–519. doi: 10.1016/0959-4388(95)80013-1. [DOI] [PubMed] [Google Scholar]
- McPeek RM, Keller EL. Saccade target selection in the superior colliculus during a visual search task. J Neurophysiol. 2002;88:2019–2034. doi: 10.1152/jn.2002.88.4.2019. [DOI] [PubMed] [Google Scholar]
- Mohler CW, Goldberg ME, Wurtz RH. Visual receptive fields of frontal eye field neurons. Brain Res. 1973;61:385–389. doi: 10.1016/0006-8993(73)90543-x. [DOI] [PubMed] [Google Scholar]
- Murthy A, Thompson KG, Schall JD. Dynamic dissociation of visual selection from saccade programming in frontal eye field. J Neurophysiol. 2001;86:2634–2637. doi: 10.1152/jn.2001.86.5.2634. [DOI] [PubMed] [Google Scholar]
- Narayanan NS, Laubach M. Top-down control of motor cortex ensembles by dorsomedial prefrontal cortex. Neuron. 2006;52:921–931. doi: 10.1016/j.neuron.2006.10.021. [DOI] [PMC free article] [PubMed] [Google Scholar]
- Newsome WT, Britten KH, Movshon JA. Neuronal correlates of a perceptual decision. Nature. 1989;341:52–54. doi: 10.1038/341052a0. [DOI] [PubMed] [Google Scholar]
- Nowak LG, Munk MHJ, Nelson JI, James AC, Bullier J. Structural basis of cortical synchronization. I. Three types of interhemispheric coupling. J Neurophysiol. 1995;74:2379–2400. doi: 10.1152/jn.1995.74.6.2379. [DOI] [PubMed] [Google Scholar]
- Panzeri S, Schultz SR, Treves A, Rolls ET. Correlations and the encoding of information in the nervous system. Proc Biol Sci. 1999;266:1001–1012. doi: 10.1098/rspb.1999.0736. [DOI] [PMC free article] [PubMed] [Google Scholar]
- Panzeri S, Petroni F, Petersen RS, Diamond ME. Decoding neuronal population activity in rat somatosensory cortex: role of columnar organization. Cereb Cortex. 2003;13:45–52. doi: 10.1093/cercor/13.1.45. [DOI] [PubMed] [Google Scholar]
- Passino KM, Seeley TD, Visscher PK. Swarm cognition in honey bees. Behav Ecol Sociobiol. 2008;62:401–414. [Google Scholar]
- Pouget A, Dayan P, Zemel R. Information processing with population codes. Nat Rev Neurosci. 2000;1:125–132. doi: 10.1038/35039062. [DOI] [PubMed] [Google Scholar]
- Poulet JFA, Petersen CCH. Internal brain state regulates membrane potential synchrony in barrel cortex of behaving mice. Nature. 2008;454:881–885. doi: 10.1038/nature07150. [DOI] [PubMed] [Google Scholar]
- Pratt SC, Mallon EB, Sumpter DJ, Franks NR. Quorum sensing, recruitment, and collective decision-making during colony emigration by the ant Leptothorax albipennis. Behav Ecol Sociobiol. 2002;52:117–127. [Google Scholar]
- Reich DS, Mechler F, Victor JD. Independent and redundant information in nearby cortical neurons. Science. 2001;294:2566–2568. doi: 10.1126/science.1065839. [DOI] [PubMed] [Google Scholar]
- Samonds JM, Zhou Z, Bernard MR, Bonds AB. Synchronous activity in cat visual cortex encodes collinear and cocircular contours. J Neurophysiol. 2006;95:2602–2616. doi: 10.1152/jn.01070.2005. [DOI] [PubMed] [Google Scholar]
- Sato TR, Schall JD. Effects of stimulus-response compatibility on neural selection in frontal eye field. Neuron. 2003;38:637–648. doi: 10.1016/s0896-6273(03)00237-x. [DOI] [PubMed] [Google Scholar]
- Sato T, Murthy A, Thompson KG, Schall JD. Search efficiency but not response interference affects visual selection in frontal eye field. Neuron. 2001;30:583–591. doi: 10.1016/s0896-6273(01)00304-x. [DOI] [PubMed] [Google Scholar]
- Schall JD. Neuronal activity related to visually guided saccades in the frontal eye fields of rhesus monkeys: comparison with supplementary eye fields. J Neurophysiol. 1991;66:559–579. doi: 10.1152/jn.1991.66.2.559. [DOI] [PubMed] [Google Scholar]
- Schall JD. On the role of the frontal eye field in guiding attention and saccades. Vision Res. 2004;44:1453–1467. doi: 10.1016/j.visres.2003.10.025. [DOI] [PubMed] [Google Scholar]
- Schall JD, Hanes DP. Neural basis of saccade target selection in frontal eye field during visual search. Nature. 1993;366:467–469. doi: 10.1038/366467a0. [DOI] [PubMed] [Google Scholar]
- Schall JD, Hanes DP, Thompson KG, King DJ. Saccade target selection in frontal eye field of macaque. I. Visual and premovement activation. J Neurosci. 1995;15:6905–6918. doi: 10.1523/JNEUROSCI.15-10-06905.1995. [DOI] [PMC free article] [PubMed] [Google Scholar]
- Schneidman E, Berry MJ, 2nd, Segev R, Bialek W. Weak pairwise correlations imply strongly correlated network states in a neural population. Nature. 2006;440:1007–1012. doi: 10.1038/nature04701. [DOI] [PMC free article] [PubMed] [Google Scholar]
- Schoppik D, Nagel KI, Lisberger SG. Cortical mechanisms of smooth eye movements revealed by dynamic covariations of neural and behavioral responses. Neuron. 2008;58:248–260. doi: 10.1016/j.neuron.2008.02.015. [DOI] [PMC free article] [PubMed] [Google Scholar]
- Seeley TD, Visscher PK. Quorum sensing during nest-site selection by honeybee swarms. Behav Ecol Sociobiol. 2004;56:594–601. [Google Scholar]
- Shadlen MN, Newsome WT. The variable discharge of cortical neurons: implications for connectivity, computation, and information coding. J Neurosci. 1998;18:3870–3896. doi: 10.1523/JNEUROSCI.18-10-03870.1998. [DOI] [PMC free article] [PubMed] [Google Scholar]
- Shadlen MN, Britten KH, Newsome WT, Movshon JA. A computational analysis of the relationship between neuronal and behavioral responses to visual motion. J Neurosci. 1996;16:1486–1510. doi: 10.1523/JNEUROSCI.16-04-01486.1996. [DOI] [PMC free article] [PubMed] [Google Scholar]
- Snider RK, Kabara JF, Roig BR, Bonds AB. Burst firing and modulation of functional connectivity in cat striate cortex. J Neurophysiol. 1998;80:730–744. doi: 10.1152/jn.1998.80.2.730. [DOI] [PubMed] [Google Scholar]
- Stark E, Globerson A, Asher I, Abeles M. Correlations between groups of premotor neurons carry information about prehension. J Neurosci. 2008;28:10618–10630. doi: 10.1523/JNEUROSCI.3418-08.2008. [DOI] [PMC free article] [PubMed] [Google Scholar]
- Taylor AF, Tinsley MR, Wang F, Huang Z, Showalter K. Dynamical quorum sensing and synchronization in large populations of chemical oscillators. Science. 2009;323:614–617. doi: 10.1126/science.1166253. [DOI] [PubMed] [Google Scholar]
- Thomas NWD, Paré M. Temporal processing of saccade targets in parietal cortex area LIP during visual search. J Neurophysiol. 2007;97:942–947. doi: 10.1152/jn.00413.2006. [DOI] [PubMed] [Google Scholar]
- Thompson KG, Hanes DP, Bichot NP, Schall JD. Perceptual and motor processing stages identified in the activity of macaque frontal eye field neurons during visual search. J Neurophysiol. 1996;76:4040–4055. doi: 10.1152/jn.1996.76.6.4040. [DOI] [PubMed] [Google Scholar]
- Thompson KG, Bichot NP, Schall JD. Dissociation of visual discrimination from saccade programming in macaque frontal eye field. J Neurophysiol. 1997;77:1046–1050. doi: 10.1152/jn.1997.77.2.1046. [DOI] [PubMed] [Google Scholar]
- Tomita M, Eggermont JJ. Cross-correlation and joint spectro-temporal receptive field properties in auditory cortex. J Neurophysiol. 2005;93:378–392. doi: 10.1152/jn.00643.2004. [DOI] [PubMed] [Google Scholar]
- Toyama K, Kimura M, Tanaka K. Organization of cat visual cortex as investigated by cross-correlation technique. J Neurophysiol. 1981;46:202–214. doi: 10.1152/jn.1981.46.2.202. [DOI] [PubMed] [Google Scholar]
- Ts'o DY, Gilbert CD, Wiesel TN. Relationships between horizontal interactions and functional architecture in cat striate cortex as revealed by cross-correlation analysis. J Neurosci. 1986;6:1160–1170. doi: 10.1523/JNEUROSCI.06-04-01160.1986. [DOI] [PMC free article] [PubMed] [Google Scholar]
- Tsujimoto S, Genovesio A, Wise SP. Transient neuronal correlations underlying goal selection and maintenance in prefrontal cortex. Cereb Cortex. 2008;18:2748–2761. doi: 10.1093/cercor/bhn033. [DOI] [PMC free article] [PubMed] [Google Scholar]
- Vaadia E, Haalman I, Abeles M, Bergman H, Prut Y, Slovin H, Aertsen A. Dynamics of neuronal interactions in monkey cortex in relation to behavioural events. Nature. 1995;373:515–518. doi: 10.1038/373515a0. [DOI] [PubMed] [Google Scholar]
- Vicente R, Gollo LL, Mirasso CR, Fischer I, Pipa G. Dynamical relaying can yield zero time lag neuronal synchrony despite long conduction delays. Proc Natl Acad Sci U S A. 2008;105:17157–17162. doi: 10.1073/pnas.0809353105. [DOI] [PMC free article] [PubMed] [Google Scholar]
- Waters CM, Bassler BL. Quorum sensing: cell-to-cell communication in bacteria. Annu Rev Cell Dev Biol. 2005;21:319–346. doi: 10.1146/annurev.cellbio.21.012704.131001. [DOI] [PubMed] [Google Scholar]
- Wolfe JM. Visual search. In: Pashler H, editor. Attention. London: University College London; 1998. pp. 13–73. [Google Scholar]
- Woodman GF, Kang M-S, Rossi AF, Schall JD. Nonhuman primate event-related potentials indexing covert shifts of attention. Proc Natl Acad Sci U S A. 2007;104:15111–15116. doi: 10.1073/pnas.0703477104. [DOI] [PMC free article] [PubMed] [Google Scholar]
- Yokota T, Satoh T. Three-dimensional estimation of the distribution and size of putative functional units in rat gustatory cortex as assessed from the inter-neuronal distance between two neurons with correlative activity. Brain Res Bull. 2001;54:575–584. doi: 10.1016/s0361-9230(01)00464-6. [DOI] [PubMed] [Google Scholar]
- Zohary E, Shadlen MN, Newsome WT. Correlated neuronal discharge rate and its implications for psychophysical performance. Nature. 1994;370:140–143. doi: 10.1038/370140a0. [DOI] [PubMed] [Google Scholar]