

Abstract
Objective
To determine the sex-specific relationships between physical activity, aerobic fitness, adiposity (%Fat), mineral-free lean mass (MFLM) and balance and gait performance in older adults.
Design
Eighty-five female and 49 male sedentary, healthy, community-dwelling older adults (M±SD; 69.6±5.4 and 70.3±4.7 years, respectively) were evaluated on habitual physical activity via questionnaire, aerobic fitness by a maximal oxygen consumption treadmill test, whole and regional body composition by DXA, and lower-extremity physical function (LEPF) using gait tasks and computerized dynamic posturography.
Results
As expected, males had less body fat, more lean mass and higher aerobic fitness than females, and tended to perform better on all LEPF tasks (all p≤0.1). Physical activity was not related to gait; however, fitness was related to gait in both sexes (r>0.50, all p<0.05). Body fat was related to gait in women (r=−0.38, p<0.05) but not men. Neither fitness nor body composition was related to balance in men, whereas in women leg MFLM was positively associated (r=0.27, p<0.05). Women, but not men, with a greater body weight to leg MFLM ratio performed worse on gait tasks (p<0.001). There was an interaction with sex for %Fat on gait (p=0.05), and for MFLMLEG on balance (p<0.05).
Conclusions
In sedentary healthy older adults the relation between body composition, aerobic fitness and balance and gait differs between sexes such that women are more strongly impacted by alterations in body composition. Lower %Fat and preservation of lower body lean mass have important implications for reducing the risk of physical disability, especially in older women.
Keywords: body composition, sex, fitness, gait, balance
INTRODUCTION
Similar to other indicators of health status, there are sex disparities with regard to physical function. Older women consistently perform worse on both balance and gait tasks than their male counterparts 1-3. Furthermore, the prevalence of falling 4,5 and the incidence of physical disability 6,7 is greater in older women than men. Importantly, detriments in physical function are predictive of falls, fractures, hospitalizations, psychological impairments, loss of independence and mortality 8-11. It is therefore imperative to identify modifiable risk factors that influence the sex disparity in functional limitations and to elicit targeted interventions to prevent functional decline with age. These disparities may be partially explained by sex differences in body composition, physical activity and aerobic fitness. Specifically, older women typically engage in less habitual physical activity and have lower cardiorespiratory fitness than their male counterparts 12. Additionally, older women have greater adiposity and less lean mass than men 13, and body composition measures have been shown to have a stronger relation to risk for disability in older women compared to men 14.
Reductions in lower-extremity physical function (LEPF), defined here as functional tasks relying primarily on the lower limbs for force production and support, have been associated with poor aerobic fitness, obesity, and reductions in muscle mass 15-18. There is no consensus in the literature with regard to specific components of body composition and function; recent prospective studies have yielded conflicting results in regard to changes in body composition (lean vs. fat) and levels of disability and preservation of physical capacity 19,20. However, with regard to lean mass, it is speculated that leg fat-free mass (FFM) specifically is related to physical performance 21 and loss of leg FFM may be a main predictor of functional decline 19.
Recently, Chen and Guo demonstrated the possibility of a sex-dimorphism in the relationship between body composition and physical function, particularly in regard to lower extremity mobility 22. This sex difference may partially explain the varying findings regarding the influence of fat and lean masses on function, as analyses are often performed in combined samples with little regard to sex specific sub-analyses. Furthermore, because physical fitness and body composition are inter-related, the independent relationships between these indicators of health status and physical function remain unclear. Few studies have simultaneously assessed the contributions of habitual physical activity, aerobic fitness, whole body adiposity (%Fat) and both whole body and regional lean mass to LEPF encompassing both static balance and gait performance. In this context, the primary aim of the present study was to determine the sex-specific relationships between habitual physical activity, aerobic fitness, adiposity, mineral-free lean mass (MFLM) and balance and gait performance in older adults. A secondary aim was to explore the relation of a novel characterization of body composition, MFLM of the legs (MFLMLEG) expressed relative to total body mass (MFLMLEG/WB mass), to LEPF.
METHODS
Subjects
Older community-dwelling individuals (N=85 women, 49 men; M±SD; 69.6±5.4 and 70.3±4.7 years, respectively) were eligible if they were sedentary for a minimum of past 6 months, a body mass index (BMI) between 22 and 38 kg/m2, and medical clearance from a physician. Exclusion criteria included history of inflammatory disease or cancer, severe arthritis, uncontrolled metabolic or cardiovascular disease, HIV, smoking and inability to perform moderate intensity exercise training. Participants were recruited from a parent study assessing the effect of exercise on immune function; all data was collected at baseline. The university Institutional Review Board (IRB) approved all procedures used in the study and all subjects signed an IRB approved informed consent prior to enrollment in the study.
Physical Activity and Aerobic Fitness
Physical activity level was determined using the Physical Activity Scale for the Elderly (PASE) 23 which estimates the total level of household, occupational and leisure-time physical activities on a weekly basis. A graded treadmill exercise test was performed to determine maximal aerobic capacity. Oxygen uptake was continuously measured using open-circuit spirometry (Parvomedics True Max 2400, Sandy UT). Subjects walked on a treadmill at a brisk, but comfortable pace at 0% grade for 3-4 min, followed by a grade increase of 1 to 2% every 1 or 2 min. Test termination was determined by volitional exhaustion, symptom limitation or ECG changes precluding safe exercise continuation. As the great majority but not all participants, reached a true maximal value, the highest attained oxygen uptake, averaged over a 30 sec interval, was used to define peak aerobic capacity (VO2peak); however, notably men and women performed similarly in terms of effort on the test.
Body Composition
Body composition was measured using dual energy x-ray absorptiometry (DXA) (Hologic QDR 4500A, software version 11.1:3, Waltham MA). A whole body scan was used to determine total fat mass and a regional analysis was performed per manufacturer guidelines, which involved placing lines bisecting the femoral neck and the glenohumeral joint to determine mineral free lean mass of the legs (MFLMLEG) and appendicular lean mass (aLM). The MFLM of all arm and leg regions were summed to determine aLM, and the appendicular skeletal muscle index (ASMI) was calculated by dividing aLM by height (m) squared [aLM(kg)/ht(m)2].
Lower Extremity Physical Function (LEPF)
Balance
Balance was assessed using computerized dynamic posturography (EquiTest: NeuroCom International, Clackamas, OR). For safety, participants wore a harness attached to an overhead bar throughout testing. The six test conditions were: 1) normal vision, fixed support, 2) eyes closed, fixed support, 3) vision sway-referenced, fixed support, 4) normal vision, support sway-referenced, 5) eyes closed, support surface sway-referenced, and 6) vision and support surface both sway-referenced. Three trials were completed of each condition and each trial lasted 20 seconds. Scores across trials and conditions were averaged to create a composite balance score. For a complete description of the EquiTest procedures, see Nashner 24.
Gait
Gait performance was assessed using the timed up-and-go (UPGO), a 7 meter walk (WALK), and a 7 meter walk with obstacle (OBWALK). For the UPGO, subjects sat in a chair and on the command “go,” were told to stand and move as quickly as possible around a cone placed 2.5 m away from the chair and return to the chair and sit down while being timed. Similarly, each subject completed two trials of a 7 meter walk with and without stepping over a 30 cm obstacle at the 4 meter point, walking at their normal pace. Subjects also performed a stair ascent (STAIRUP) and descent (STAIRDOWN) on a flight of 15 stairs (18 cm riser, 27 cm tread) and were instructed to ascend and descend at their normal pace, preferably without using the handrail if they could do so safely. A composite gait score was computed by summing the Z-scores for each of the five dynamic tasks to provide an index of global gait function.
Statistics
Data were analyzed with SPSS for Windows version 14.0 (SPSS, Inc., Chicago, IL). Means and standard deviations were calculated for all participant characteristics and primary outcome variables. Distribution statistics were computed to ensure data were normally distributed, based on Shapiro-Wilk test statistics. Independent samples t-tests were conducted to determine sex differences. Pearson correlations were conducted to examine the bivariate associations among variables of interest. Due to known physiological differences between men and women, the impact of these parameters was further assessed with analyses performed separately within gender. To further evaluate the influences of fitness and body composition on LEPF, primary variables of interest (VO2peak, %Fat, MFLMLEG and MFLMLEG/WB Mass) were median split and sex differences were evaluated using independent samples t-test analyses. To determine if the impact of these variables on function outcomes differed between sexes, a 2 × 2 ANOVA was used to test for sex-interactions. All data are presented as mean±SD except the figures which express variability using standard error bars. All significance tests were conducted at the p≤0.05 level.
RESULTS
Data were considered normally distributed. Men and women were similar in age and BMI. As expected, women were shorter and weighed less, had more absolute and relative body fat, were less fit, had lower MFLMLEG and had a lower ASMI (see Table 1). On the EquiTest composite score, men tended to out-perform women (p<0.10), representing a consistently better performance of 3%. For gait performance, women tended to perform slower on the UPGO and 7 meter walk (p≤0.07), representing a 7% and 5% difference, respectively. Women also took longer to complete the OBWALK, STAIRUP and STAIRDOWN (all p<0.05), corresponding to a slower performance of 9%, 9% and 7%, respectively. These sex differences remained when adjusted for height to account for stride length, with the exception of the OBWALK. When evaluating the composite Z-score representing global balance or gait function, men scored better than women on gait tasks (p<0.01), but did not statistically differ on balance tasks (Table 2).
Table 1.
Subject characteristics (M±SD)
| Characteristics | Women N=85 |
Men N=49 |
P-value |
|---|---|---|---|
| Age (yrs) | 69.6 ± 5.4 | 70.3 ± 4.7 | 0.438 |
| Weight (kg) | 72.1 ± 12.8* | 87.6 ± 15.1 | <0.001 |
| Height (m) | 1.60 ± 0.06* | 1.75 ± 0.07 | <0.001 |
| BMI (kg/m2) | 28.1 ± 4.7 | 28.6 ± 4.3 | 0.549 |
| Bodyfat (%) | 38.7 ± 5.6* | 27.8 ± 5.7 | <0.001 |
| Total Fat Mass (kg) | 28.9 ± 8.7* | 25.3 ± 8.7 | 0.024 |
| Total MFLMLEG (kg) | 13.3 ± 2.0* | 19.3 ± 2.3 | <0.001 |
| MFLMLEG / WB Mass | 18.35 ± 1.62* | 22.07 ± 2.13 | <0.001 |
| Appendicular Skeletal Muscle Index (kg/m2) | 6.85 ± 0.89* | 8.74 ± 0.91 | <0.001 |
| VO2peak (ml/kg/min) | 18.1 ± 3.9* | 22.2 ± 4.2 | <0.001 |
| PASE | 143.3 ± 66.8 | 141.4 ± 72.7 | 0.885 |
Indicates a significant sex difference, p < 0.05
Table 2.
Measures of lower extremity physical function in women and men (M±SD)
| Women N=85 |
Men N=49 |
P-value | |
|---|---|---|---|
| Balance | |||
| EquiTest Composite Score | 75.4 ± 7.6 | 77.3 ± 5.7 | 0.100 |
| Gait | |||
| Timed Up and Go (sec) | 6.5 ± 1.3 | 6.1 ± 1.0 | 0.071 |
| 7 meter walk (sec) | 6.6 ± 1.1 | 6.3 ± 0.7 | 0.064 |
| 7 meter walk with obstacle (sec) | 7.0 ± 1.2* | 6.4 ± 0.8 | <0.001 |
| Stair Up (sec) | 8.9 ± 2.2* | 8.2 ± 1.5 | 0.003 |
| Stair Down (sec) | 9.2 ± 1.7* | 8.6 ± 1.4 | 0.020 |
| Gait Composite Z-score† | −0.72 ± 4.7* | 1.25 ± 2.9 | 0.003 |
Indicates a significant sex difference, p < 0.05
Z-score was generated using the entire sample in order to compare across gender
As expected, there were significant relations among the body fat measures (r=0.80 for the entire sample, r>0.90 within gender) and between body fat and aerobic fitness (r range=−0.46 to −0.66; data not shown). Total body fat mass was positively associated with MFLMLEG in the entire sample (r=0.23), which was strengthened when assessed within gender (r=0.71 and 0.34 in women and men, respectively). MFLMLEG/WB Mass was strongly inversely related to body fat measures (r range=−0.66 to −0.89). Additionally, associations among dynamic gait measures ranged from r=0.53 to 0.86, while there was more variable associations between static measures, ranging from r=0.18 to 0.83.
Aerobic fitness had the strongest relation to gait measures in both genders (r range=−0.34 to −0.49 in men; −0.42 to −0.60 in women, all p<0.05; Table 3); however, physical activity measured by PASE had no relation to any measures of LEPF (all p>0.05). In women, both %Fat and MFLMLEG/WB Mass were inversely related to all measures of dynamic LEPF (r range=−0.24 to −0.41, all p<0.05), whereas only the UPGO was correlated with %Fat in men (r=0.29, p<0.05). Similarly, neither body composition nor fitness was related to balance performance in men. However, in women, MFLMLEG was positively associated with EquiTest composite score (r=0.27, p<0.05), but no other measures of body composition or fitness were related to balance.
Table 3.
Correlations between body composition, fitness and lower extremity physical function in women and men
| Appendicular Skeletal Muscle Index (ASMI) (kg/m2) |
Total MFLMLEG (kg) |
MFLMLEG / WB Mass |
Relative Body Fat (%) |
VO2peak ml/kg/min |
||||||
|---|---|---|---|---|---|---|---|---|---|---|
| Women | Men | Women | Men | Women | Men | Women | Men | Women | Men | |
| Balance | ||||||||||
| EquiTest Composite |
0.16 | −0.04 | 0.27* | −0.07 | 0.12 | <0.01 | 0.05 | −0.16 | 0.12 | 0.15 |
| Gait | ||||||||||
| Stair Ascent (sec) |
0.14 | −0.13 | −0.04 | −0.21 | −0.27* | −0.12 | 0.24* | 0.07 | −0.42** | −0.35* |
| Stair Descent (sec) |
0.09 | 0.01 | −0.01 | −0.07 | −0.32** | −0.22 | 0.33** | 0.23 | −0.48** | −0.36* |
| Timed Up and Go (sec) |
0.17 | 0.13 | 0.03 | 0.06 | −0.29** | −0.28* | 0.33** | 0.29* | −0.50** | −0.34* |
| Timed Walk (sec) |
0.13 | 0.14 | 0.05 | 0.04 | −0.41** | −0.10 | 0.38** | 0.17 | −0.60** | −0.40* |
| Timed Obstacle Walk (sec) |
0.13 | −0.01 | −0.00 | −0.13 | −0.36** | −0.14 | 0.37** | 0.19 | −0.58** | −0.44** |
| Gait Composite Z-score |
−0.15 | −0.04 | −0.01 | 0.08 | 0.38** | 0.23 | −0.38** | −0.25 | 0.59** | 0.51** |
Indicates a significant correlation, p < 0.05
p < 0.01.
Evaluating median splits for fitness, %Fat and MFLMLEG illustrates the relative importance of each within gender (Figure 1). Females having higher %Fat performed worse on dynamic function tasks compared to those with lower %Fat (p<0.01), whereas %Fat did not alter dynamic function in males (p>0.10; Figure 1A). Alternatively stated, there was a significant interaction between sex and %Fat such that %Fat impacted dynamic function in females but not males (p=0.05, Figure 1). Similarly, both men and women with higher fitness levels performed better on dynamic tasks compared to individuals with lower fitness (p=0.05 and p<0.01, respectively; Figure 1B); however, the interaction between sex and fitness did not reach significance (p>0.1) suggesting that fitness impacted dynamic function similarly in males and females. When split along the median of the ratio of MFLMLEG / WB Mass, women with higher levels, (i.e. relatively speaking have more leg MFLM to support a lower body mass) outperformed those with low levels (p<0.01), however this ratio did not significantly impact function in men (p>0.10; Figure 1C). Static balance measures were significantly better in women with greater MFLMLEG (Figure 2) compared to women with less MFLMLEG (p=0.01), yet had no influence on balance in men (p=0.65) rendering the sex and MFLMLEG interactive effect on balance function significant (p<0.05, Figure 2).
Figure 1.
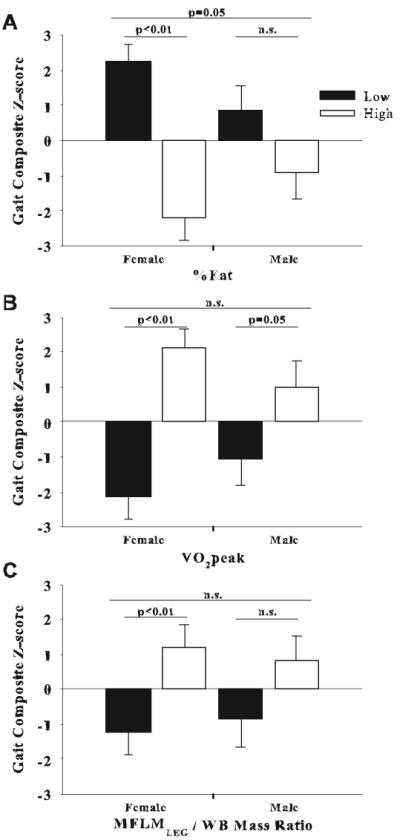
Median splits of %Fat (A), VO2peak (B) and the ratio of MFLMLEG / WB Mass (C) in relation to composite gait Z-scores in women and men.
Figure 2.
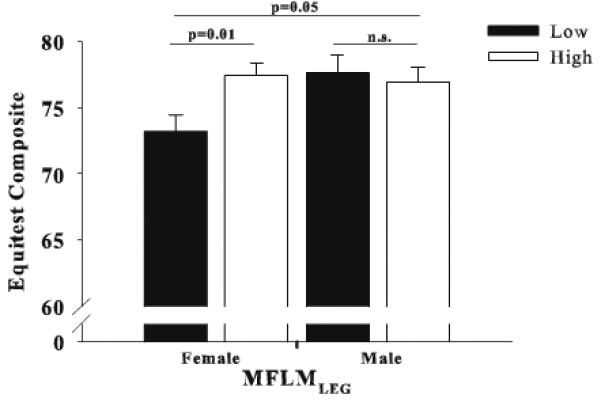
Median splits of MFLMLEG in relation to EquiTest composite balance scores in women and men.
DISCUSSION
The results from the present study add to the accruing body of literature attempting to identify the interactive effects of physical activity, fitness, fat mass and lean mass on age-related declines in physical function. The most notable findings in the present study are a) the sex-specific influence of different body composition components, specifically fat and lean tissue, on balance and gait function and b) the ratio of MFLMLEG/WB Mass is significantly related to gait LEPF in women. Whereas others have reported that sex differences in function appear to be mediated by BMI, we have expanded this finding to more descriptive measures of body composition.
The extent to which body composition components impact performance on functional tasks is not well characterized. Several studies have reported positive associations between increases in BMI or fat mass and risk for physical disability 15,25-32, which appears to be stronger in women than men 31. Although BMI has often been used as a surrogate of obesity, to our knowledge, no study has assessed the relationship between body fat and lean mass, particularly regionally, and LEPF between sexes. Due to known sex differences in the relative fat and lean tissues comprising BMI, we found it pertinent to assess the relations of both body composition and fitness to physical function separately within sex. Furthermore, although others have observed a stronger relationship between “adiposity” and physical function in women than men, these studies have typically used BMI as the adiposity measure. Indeed, in the present study, body fat was related to all measures of dynamic LEPF in women, but not men. Adiposity had no relation with overall static balance ability in the present study (Table 3).
Evidence also suggests that muscle mass is the primary predictor of physical function 16,17. Alternatively, others have demonstrated no greater likelihood of disability in individuals with moderate sarcopenia and those with normal muscle mass 17. Similar to Jankowski et al. 33, there was no correlation between ASMI and LEPF in men or women in the present study; however, it should be recognized that our population was healthy, ambulatory and not at risk for sarcopenia. Further breakdown of regional components of lean tissue have identified leg muscle mass specifically to be strongly associated with LEPF, a logical association 34. Despite no relation between lean mass and function in men, MFLMLEG was positively correlated to balance in women. While the associations were moderate (r=0.27), the physiological and clinical relevance are unknown. Very minimal evidence exists regarding body composition and balance; however, it is presumable that increased MFLMLEG leading to increased balance would have important implications on fall prevention.
Given the impact of both lean and fat mass on LEPF, we believed it was prudent to assess the ratio of MFLMLEG, the burden carrying portion of the body, to whole body mass (WB Mass), the total load to be moved (MFLMLEG / WB Mass). While this ratio had no relation to LEPF in men it was related to all measures of dynamic LEPF in women. Our results clearly suggest an increased risk of disability with disordered body composition in women. Although BMI has been frequently utilized to assess the relationship between body composition and function, our data suggest this may be inappropriate, as it does not allow for dichotomizing the impact of lean and fat masses on LEPF. This is in agreement with a recent report by Woo and colleagues 35, which determined that fat mass was a predictor of walking speed, which remained when adjusting for BMI.
As previously demonstrated 36, aerobic fitness was strongly correlated to LEPF (composite gait Z-scores, r=0.51 and 0.59 in men and women, respectively). Although high fit individuals performed better than low fit individuals, this relationship did not differ between sexes; with fitness likely accounting for at least part of the sex disparity in functional performance. Unlike Koster and colleagues (37), who recently demonstrated that low levels of physical activity were predictive of limitations in mobility, particularly in women, we saw no relation in our cross-sectional analysis, and similar relations between fitness and LEPF in men and women. This is likely due, at least in part, to recruitment criteria of the parent study, all subjects were able to perform activities of daily living; however, they all fell within a narrow range of habitual physical activity levels (i.e., relatively sedentary) which likely accounts for the lack of relation between PASE and LEPF. The influence of habitual physical activity in the activities of daily living domain may be an important component of physical function independent of purposeful exercise; an area that needs further investigation.
Although we present novel findings regarding the interactions of fitness, fatness and physical function within gender, the present study is not without limitations. First, the cross-sectional design precludes any causal interpretation; however, our data provide insight into testing various behavioral interventions (increased aerobic or muscular fitness, decreased adiposity, maintenance of lean mass in the legs) to enhance LEFP in the elderly. Second, our study sample was limited to healthy community-dwelling older adults, with similar BMI to the current national average 37 and may not be applicable to other populations such as older, more frail, and those with more disordered body composition, i.e., sarcopenic and obese.
It is concluded that both aerobic capacity as well as body composition are associated with LEPF. Exercise training has been shown unequivocally to increase aerobic capacity, even in elderly subjects 38. Weight loss through exercise has been shown to prevent or attenuate physical dysfunction in the elderly 39,40. It may be that the optimal intervention (i.e. caloric restriction for weight loss and exercise mode aerobic and/or strength training) may differ for men compared to women to prevent physical disability in the older population.
Summary.
The purpose of this study was to identify sex-specific relationships between physical activity, fitness, body composition and balance and gait in older adults. Our results indicate that balance and gait are more strongly influenced by body composition (both adiposity and lean mass) in women than men.
Acknowledgements
The authors would like to acknowledge Ms. Susan Herrel for her assistance with this study. This research was supported by National Institutes of Health (NIH) Grant AG-18861 to J.A. Woods.
References
- 1.Hageman PA, Leibowitz JM, Blanke D. Age and gender effects on postural control measures. Arch Phys Med Rehabil. 1995;76:961–965. doi: 10.1016/s0003-9993(95)80075-1. [DOI] [PubMed] [Google Scholar]
- 2.Wolfson L, Whipple R, Derby CA, Amerman P, Nashner L. Gender differences in the balance of healthy elderly as demonstrated by dynamic posturography. J Gerontol. 1994;49:160–167. doi: 10.1093/geronj/49.4.m160. [DOI] [PubMed] [Google Scholar]
- 3.Musselman K, Brouwer B. Gender-related differences in physical performance among seniors. J Aging Phys Act. 2005;13:239–253. doi: 10.1123/japa.13.3.239. [DOI] [PubMed] [Google Scholar]
- 4.Colledge NR, Cantley P, Peaston I, Brash H, Lewis S, Wilson JA. Ageing and balance: the measurement of spontaneous sway by posturography. Gerontology. 1994;40:273–278. doi: 10.1159/000213596. [DOI] [PubMed] [Google Scholar]
- 5.Prudham D, Evans JG. Factors associated with falls in the elderly: a community study. Age Ageing. 1981;10:141–146. doi: 10.1093/ageing/10.3.141. [DOI] [PubMed] [Google Scholar]
- 6.Leveille SG, Penninx BW, Melzer D, Izmirlian G, Guralnik JM. Sex differences in the prevalence of mobility disability in old age: the dynamics of incidence, recovery, and mortality. J Gerontol B Psychol Sci Soc Sci. 2000;55:S41–S50. doi: 10.1093/geronb/55.1.s41. [DOI] [PubMed] [Google Scholar]
- 7.Murtagh KN, Hubert HB. Gender Differences in Physical Disability Among an Elderly Cohort. Am J Public Health. 2004;94:1406–1411. doi: 10.2105/ajph.94.8.1406. [DOI] [PMC free article] [PubMed] [Google Scholar]
- 8.Penninx BWJH, Ferrucci L, Leveille SG, Rantanen T, Pahor M, Guralnik JM. Lower Extremity Performance in Nondisabled Older Persons as a Predictor of Subsequent Hospitalization. J Gerontol A Biol Sci Med Sci. 2000;55:M691–M697. doi: 10.1093/gerona/55.11.m691. [DOI] [PubMed] [Google Scholar]
- 9.Guralnik JM, Simonsick EM, Ferrucci L, et al. A short physical performance battery assessing lower extremity function: association with self-reported disability and prediction of mortality and nursing home admission. J Gerontol. 1994;49:M85–M94. doi: 10.1093/geronj/49.2.m85. [DOI] [PubMed] [Google Scholar]
- 10.Guralnik JM, Ferrucci L, Simonsick EM, Salive ME, Wallace RB. Lower-Extremity Function in Persons over the Age of 70 Years as a Predictor of Subsequent Disability. N Engl J Med. 1995;332:556–562. doi: 10.1056/NEJM199503023320902. [DOI] [PMC free article] [PubMed] [Google Scholar]
- 11.Rolland Y, Lauwers-Cances V, Cesari M, Vellas B, Pahor M, Grandjean H. Physical Performance Measures as Predictors of Mortality in a Cohort of Community-dwelling Older French Women. European Journal of Epidemiology. 2006;21:113–122. doi: 10.1007/s10654-005-5458-x. [DOI] [PubMed] [Google Scholar]
- 12.Vogel JA, Patton JF, Mello RP, Daniels WL. An analysis of aerobic capacity in a large United States population. J Appl Physiol. 1986;60:494–500. doi: 10.1152/jappl.1986.60.2.494. [DOI] [PubMed] [Google Scholar]
- 13.Heyward VH, Stolarczyk LM. Applied body composition assessment. Human Kinetics; Champaign: 1996. Body composition and levels of body fatness; pp. 135–42. [Google Scholar]
- 14.Wray LA, Blaum CS. Explaining the role of sex on disability: A population-based study. Gerontologist. 2001;41:499–510. doi: 10.1093/geront/41.4.499. [DOI] [PubMed] [Google Scholar]
- 15.Davison KK, Ford ES, Cogswell ME, dietz WH. Percentage of body fat and body mass index are associated with mobility limitations in people aged 70 and older from NHANES III. J Am Geriatr Soc. 2002;50:1802–1809. doi: 10.1046/j.1532-5415.2002.50508.x. [DOI] [PubMed] [Google Scholar]
- 16.Newman AB, Kupelian V, Visser M, et al. Sarcopenia: alternative definitions and associations with lower extremity function. J Am Geriatr Soc. 2003;51:1602–1609. doi: 10.1046/j.1532-5415.2003.51534.x. [DOI] [PubMed] [Google Scholar]
- 17.Janssen I. Influence of sarcopenia on the development of physical disability: The cardiovascular health study. J Am Geriatr Soc. 2006;54:56–62. doi: 10.1111/j.1532-5415.2005.00540.x. [DOI] [PubMed] [Google Scholar]
- 18.Huang Y, Macera CA, Blair SN, Brill PA, Kohl HW, Kronenfeld JJ. Physical fitness, physical activity, and functional limitation in adults aged 40 and older. Med Sci Sports Exerc. 1998;30:1430–1435. doi: 10.1097/00005768-199809000-00013. [DOI] [PubMed] [Google Scholar]
- 19.Fantin F, Francesco VD, Fontana G, et al. Longitudinal body composition changes in old men and women: interrelationships with worsening disability. J Gerontol A Biol Sci Med Sci. 2007;62:1375–1381. doi: 10.1093/gerona/62.12.1375. [DOI] [PubMed] [Google Scholar]
- 20.Bouchard DR, Beliaeff S, Dionne IJ, Brochu M. Fat mass but not fat-free mass is related to physical capacity in well-functioning older individuals: Nutrition as a Determinant of Successful Aging (NuAge) The Quebec Longitudinal Study. J Gerontol A Biol Sci Med Sci. 2007;62:1382–1388. doi: 10.1093/gerona/62.12.1382. [DOI] [PubMed] [Google Scholar]
- 21.Visser M, Goodpaster BH, Kritchevsky SB, et al. Muscle mass, muscle strength, and muscle fat infiltration as predictors of incident mobility limitations in well-functioning older persons. J Gerontol A Biol Sci Med Sci. 2005;60A:324–333. doi: 10.1093/gerona/60.3.324. [DOI] [PubMed] [Google Scholar]
- 22.Chen H, Guo X. Obesity and functional disability in elderly Americans. J Am Geriatr Soc. 2008;56:689–694. doi: 10.1111/j.1532-5415.2007.01624.x. [DOI] [PMC free article] [PubMed] [Google Scholar]
- 23.Washburn RA, McAuley E, Katula J, Mihalko SL, Boileau RA. The Physical Activity Scale for the Elderly (PASE): Evidence for validity. J Clin Epidemiol. 1999;52:643–651. doi: 10.1016/s0895-4356(99)00049-9. [DOI] [PubMed] [Google Scholar]
- 24.Nashner LM. Computerized dynamic posturography. In: Jacobson GP, Newman CW, Kantush JM, editors. Handbook of Balance Function Testing. Mosby-Year Book; St. Louis MO: 1993. pp. 280–307. [Google Scholar]
- 25.Hubert HB, Bloch DA, Fries JF. Risk factors for physical disability in an aging cohort: the NHANES I Epidemiologic Followup Study. J Rheumatol. 1993;20:480–488. [PubMed] [Google Scholar]
- 26.Davis JW, Ross PD, Preston SD, Nevitt MC, Wasnich RD. Strength, physical activity, and body mass index: relationship to performance-based measures and activities of daily living among older Japanese women in Hawaii. J Am Geriatr Soc. 1998;46:274–279. doi: 10.1111/j.1532-5415.1998.tb01037.x. [DOI] [PubMed] [Google Scholar]
- 27.Zamboni M, Turcato E, Santana H, et al. The relationship between body composition and physical performance in older women. J Am Geriatr Soc. 1999;47:1403–1408. doi: 10.1111/j.1532-5415.1999.tb01557.x. [DOI] [PubMed] [Google Scholar]
- 28.Sternfeld B, Ngo L, Satariano WA, Tager IB. Association of body composition with physical performance and self-reported functional limitation in elderly men and women. Am J Epidemiol. 2002;156:110–121. doi: 10.1093/aje/kwf023. [DOI] [PubMed] [Google Scholar]
- 29.Krahnstoever K, Ford ES, Cogswell ME, Dietz WH. Percentage of body fat and body mass index are associated with mobility limitations in people aged 70 and older from NHANES III. J Am Geriatr Soc. 2002;50:1802–1809. doi: 10.1046/j.1532-5415.2002.50508.x. [DOI] [PubMed] [Google Scholar]
- 30.Zoico E, Di Francesco V, Guralnick JM, et al. Physical disability and muscular strength in relation to obesity and different body composition indexes in a sample of healthy elderly women. Int J Obes Relat Metab Disord. 2004;28:234–241. doi: 10.1038/sj.ijo.0802552. [DOI] [PubMed] [Google Scholar]
- 31.Friedmann JM, Elasy T, Jensen GL. The relationship between body mass index and self-reported functional limitation among older adults: a gender difference. J Am Geriatr Soc. 2001;49:398–403. doi: 10.1046/j.1532-5415.2001.49082.x. [DOI] [PubMed] [Google Scholar]
- 32.Lebrun CE, van der Schouw YT, de Jong FH, Grobbee DE, Lamberts SW. Fat mass rather than muscle strength is the major determinant of physical function and disability in postmenopausal women younger than 75 years of age. Menopause. 2006;13:474–481. doi: 10.1097/01.gme.0000222331.23478.ec. [DOI] [PubMed] [Google Scholar]
- 33.Jankowski CM, Gozansky WS, Van Pelt RE, et al. Relative contributions of adiposity and muscularity to physical function in community-dwelling older adults. Obesity. 2008;16:1039–1044. doi: 10.1038/oby.2007.84. [DOI] [PMC free article] [PubMed] [Google Scholar]
- 34.Visser M, Deeg DJH, Lips P, Harris TB, Bouter LM. Skeletal muscle mass and muscle strength in relation to lower-extremity performance in older men and women. J Am Geriatr Soc. 2000;48 doi: 10.1111/j.1532-5415.2000.tb04694.x. [DOI] [PubMed] [Google Scholar]
- 35.Woo J, Leung J, Kwok T. BMI, body composition, and physical functioning in older adults. Obesity. 2007;15:1886–1894. doi: 10.1038/oby.2007.223. [DOI] [PubMed] [Google Scholar]
- 36.Misic MM, Rosengren KS, Woods JA, Evans EM. Muscle quality, aerobic fitness and fat mass predict lower-extremity physical function in community-wwelling older adults. Gerontology. 2007;53:260–266. doi: 10.1159/000101826. [DOI] [PubMed] [Google Scholar]
- 37.Ogden CL, Carroll MD, Curtin LR, McDowell MA, Tabak CJ, Flegal KM. Prevalence of overweight and obesity in the United States, 1999-2004. J Am Med Assoc. 2006;295:1549–1555. doi: 10.1001/jama.295.13.1549. [DOI] [PubMed] [Google Scholar]
- 38.Evans EM, Racette SB, Peterson LR, Villareal DT, Griewe JS, Holloszy JO. Aerobic power and insulin action improve in response to endurance exercise training in healthy 77-87 yr olds. J Appl Physiol. 2005;98:40–45. doi: 10.1152/japplphysiol.00928.2004. [DOI] [PubMed] [Google Scholar]
- 39.Weiss EP, Racette SB, Villareal DT, et al. Lower extremity muscle size and strength and aerobic capacity decrease with caloric restriction but not with exercise-induced weight loss. J Appl Physiol. 2007;102:634–640. doi: 10.1152/japplphysiol.00853.2006. [DOI] [PMC free article] [PubMed] [Google Scholar]
- 40.Trost SG, Ward DS, McGraw B, Pate RR. Validity of the previous day physical activity recall (PDPAR) in fifth-grade children. Ped Exerc Sci. 1999;11:341–348. [Google Scholar]