Abstract
We report a quantitative phase microscope based on spectral domain optical coherence tomography and line-field illumination. The line illumination allows self phase-referencing method to reject common-mode phase noise. The quantitative phase microscope also features a separate reference arm, permitting the use of high numerical aperture (NA > 1) microscope objectives for high resolution phase measurement at multiple points along the line of illumination. We demonstrate that the path-length sensitivity of the instrument can be as good as 41 , which makes it suitable for nanometer scale study of cell motility. We present the detection of natural motions of cell surface and two-dimensional surface profiling of a HeLa cell.
1. Introduction
Fast, accurate, and low noise quantitative phase microscopy is vital for the most stringent applications such as nano-scale cell membrane dynamics [1]. In the past several years, different modalities have been introduced for quantitative phase measurements [2–11]. These methods can be classified into two main categories: namely, transmission and reflection mode techniques. The transmission mode techniques measure the phase shift induced by the sample relative to the medium. Thus, the measured phase shift is proportional to the refractive index difference, Δn, between the sample and the medium [2–7]. In contrast, the reflection mode phase-sensitive methods rely on low coherence interferometry and yield phase measurement proportional to the index of refraction, n, of the sample rather than the relative index, Δn. Therefore, reflection-based phase measurement techniques promise an advantage in measurement sensitivity by a factor, 2n/Δn, over the transmission-based methods provided that the intensity of illumination source is sufficient enough to compensate for the weak signal in reflection mode. Typical implementations of reflection phase-sensitive methods [8–10] are based on spectral-domain optical coherence tomography (SDOCT) [12,13]. Recently, a full-field time-domain phase-OCT system has also been reported [11].
Classical spectral-domain phase microscope (SDPM) implementations employ common path configuration in which the cell substrate, typically the glass coverslip surface farther from the biological sample, serves as a reference reflector. By measuring the relative phase of the reflections from the specimen and the coverslip surface, the common-mode noise can be rejected. This delivers superior phase stability ideally suited for high-sensitivity phase measurements of biological samples in reflection mode. The common-path spectral domain phase-OCT systems, however, compromise the spatial resolution by using relatively low NA microscope objectives to simultaneously focus the sample and the reference reflectors. The use of low NA microscope objectives also yields relatively stronger optical signals from the coverslip surface adjacent to the biological sample, leading to diminished phase changes due to the sample [14]. We notice that with regard to applications such as cell membrane dynamics, most of the reported phase OCT methods also fall into the category of single point measurement techniques, which inherently limits an analysis of whole-cell or wide-area dynamics.
In 2005, two research groups independently reported the use of line focus illumination and parallel detection of OCT signal for single-shot B-scan imaging without the need for lateral scanning [15,16]. The technique has since been successfully utilized for high-speed dermatological investigation [17] and retinal imaging [18] in vivo. However, the phase detection of OCT signal in a line-field detection scheme has not been reported yet. In this paper, we report a line-field phase microscope (LFPM) for quantitative phase imaging of multiple points along the line of illumination. By using a unique self phase-referencing method, we utilize a high NA objective (NA = 1.2), with the same or better performance in suppressing the effect of environmental noise than the conventional common-path configuration. In contrast to classical SDPM, the proposed technique also allows simultaneous depth-resolved phase measurement of multiple lateral points, thus enabling the study of spatial and temporal coherence of cell membrane motions [19] in reflection mode.
2. Line-field phase microscope
2.1 Experimental Setup
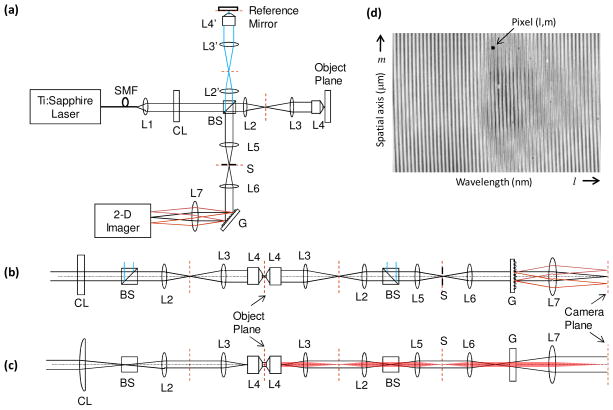
Figure 1(a) shows the schematic of our line-field phase microscope. Light from a mode-locked Ti:Sapphire laser (center wavelength, λc = 800 nm) is coupled into a single-mode fiber for delivery, as well as for broadening the spectrum. The full-width-half-maximum spectral width, Δλ, at the fiber output measures 50 nm, which yields a round trip coherence length of 4 μm in medium whose refractive index, n, equals to 1.37, the average index of a typical cell [20]. A cylindrical lens (f = 300 mm) is used in the path of the collimated beam (1/e2 diameter = 6 mm) along with achromatic lenses L2, L3 and a water immersion 60 × (NA = 1.2) microscope objective, L4, to yield line focused illumination beam (~60 μm × 0.5 μm) in the object plane.
Fig. 1.
(a) Schematic of line-field phase microscope (LFPM). (b,c) Horizontal and vertical perspectives, respectively, of the LFPM. (d) Typical 2-D recorded interferogram illustrating spectral and spatial measurements along the two orthogonal directions of the 2-D spectrometer. SMF: single mode fiber, Li: ith spherical lens, CL: cylindrical lens, BS: beam splitter, S: slit, G: diffraction grating.
A separate reference arm is built using identical optics as that in the sample arm except L4′, where a 40 × microscope objective is used. The returning light beams from sample and reference arms combine at the beam splitter and reach a two-dimensional spectrometer via lenses L5 and L6. A vertical slit S is also introduced at the conjugate plane located between L5 and L6 to reduce the light coming from out-of-confocal region in the object plane and arriving at the spectrometer. The width of the slit is adjusted to 90μm which translates to ~2μm in the object plane, estimating the confocal parameter to be 7.8μm. This indicates that the axial resolution is dictated by the coherence gating rather than the confocal gating. However, the confocal gating certainly played a role in rejecting the unwanted signal before reaching a detector.
The 2-D spectrometer consists of a reflection grating (600 lines/mm), a focusing lens L7, and a high-speed CMOS camera (Photron 1024PCI). The collinear reference and sample beams are dispersed by the grating before reaching the camera via lens L7. Figures 1(b)–1(c) show the horizontal and vertical perspectives of the optical design illustrating the line-field illumination as well as spectral and spatial measurements along the two orthogonal directions of the 2-D spectrometer. Figure 1(d) shows a typical 2-D interferogram recorded by the self phase-referenced low coherence phase microscope.
For a single reflector in the sample, the interference signal recorded by the (l, m) pixel of the 2-D spectrometer can be written as:
| (1) |
where IR,S is the intensity of the light arriving from reference and sample arms, respectively. Here, n is the index of the medium, k is the optical wavenumber, and (zR − zS) is the path length difference between the sample and reference arms. For each lateral position m, the spectral data is resampled evenly in wavenumber space, numerically compensated for dispersion, and Fourier transformed to get the depth-resolved phase and amplitude information of the sample.
There are several advantages of the LFPM shown in Fig. 1. The microscope design features line focus illumination which permits simultaneous depth-resolved phase measurement of multiple lateral points along the line of illumination. The setup also utilizes a separate reference arm which allows placing the line illumination at the depth of interest inside the sample, without compromising optimal reference beam power required for high contrast of interference fringes regardless of the NA of the microscope objective used.
2.2 Common-mode noise rejection
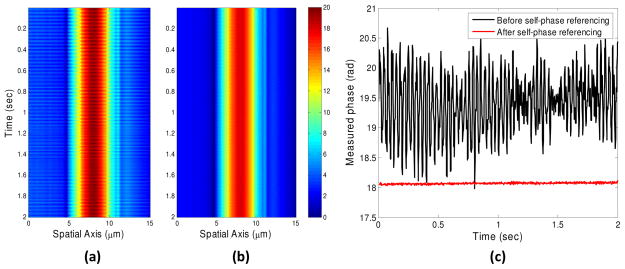
The use of a separate reference arm, however, is subject to random phase noise due to the independent mechanical or thermal fluctuations of the reference beam path with respect to those of the sample beam path. This is illustrated in Fig. 2(a) which shows phase measurements at a frame rate of 500 Hz from the surface of a 10 microns diameter latex microsphere. To eliminate the interferometric noise, we introduce a self-phase referencing method described as follows. Since the phase of all the points on the line illumination beam is acquired at the same time, every point along the line shares the same interferometric noise as any other point. We take the phase measured at a part of the beam illuminating outside of the sample as a reference representing the common-mode noise. By subtracting this reference phase from the phase of the subsequent points on the line focused beam, we remove the common-mode noise as shown in Fig. 2(b).
Fig. 2.
Phase measurements from a fixed location on the surface of a 10 microns diameter latex microsphere (a) before and (b) after common-mode noise removal. (c) Time traces of the measured phase at one point on the line-illumination with and without self-phase referencing.
Figure 2(c) also shows time traces of the measured phase at one point on the latex microsphere surface with and without self-phase referencing, and demonstrates significant suppression of the interferometric noise. In addition, the slit S limits the contribution of signal from the glass coverslip, thus improving the contrast of interference signal originated from the cell surface. In practice, a background phase is also acquired from the coverslip alone. By subtracting this phase from the actual measurement, the system-dependent but time-independent, phase such as the remaining effect of coverslip’s phase contribution is removed. The measured phase along the line of illumination was also used to estimate the curvature of the bead surface. We estimate the radius of the 10 microns diameter bead with 97% or better accuracy within a 4 microns spherical sector.
2.3 Phase measurement sensitivity
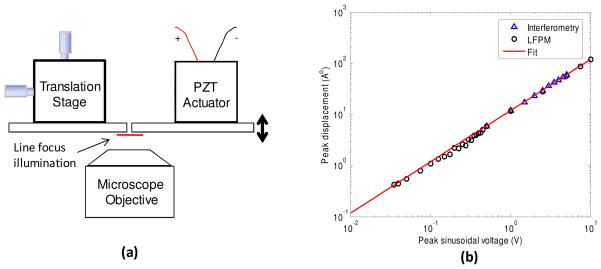
The common-mode noise rejection capability of the LFPM enables phase measurements with high sensitivity. In order to experimentally assess the phase sensitivity of the instrument, we calibrate the motion of a reflector driven by a shear-type piezo actuator (Model #: P-121.01, Physik Instrumente). As shown in Fig. 3(a), two small pieces of a 1 mm glass slide are used; one as a reference surface fixed on a 2-D translational stage and the other as a moving surface mounted on the piezo actuator. The piezo actuator is driven at 400 Hz to displace the glass slide along the optical axis in a sinusoidal fashion. The 2-D translational stage is adjusted to bring the reference glass slide close enough to the moving slide such that the line focus beam partially impinges on each glass surface. Various amplitudes of the sinusoidal signal, ranging from 20 mV to 10 V, are used to drive the piezo actuator. 2-D interferograms are acquired at 1 kHz frame rate and processed to determine the peak displacement of the moving glass slide with respect to the stationary one. For comparison, we perform independent measurements of the moving reflector for large driving voltages (~500mV to 10V) using a Twyman-Green interferometer. Figure 3(b) illustrates the log-log plot of the peak displacement of piezo actuator versus peak sinusoidal voltage. As shown, the phase measurements made using two different optical systems are in complete agreement with each other. A linear fit of the phase measurements is used to calibrate the piezo actuator, indicating that it displaced ~12 Å/Volt. The minimum amplitude of the motion detected by our LFPM, thus the measurement sensitivity, is 41 .
Fig. 3.
(a) Setup to the experimentally measure the phase sensitivity of the LFPM. (b) shows the log-log plot of the peak displacement of piezo actuator measured versus peak sinusoidal drive voltage using LFPM as well as standard interferometry. The measurement sensitivity, i.e., the minimum motion detected by the LFPM, was determined to be 41 .
3. Live cell imaging with LFPM
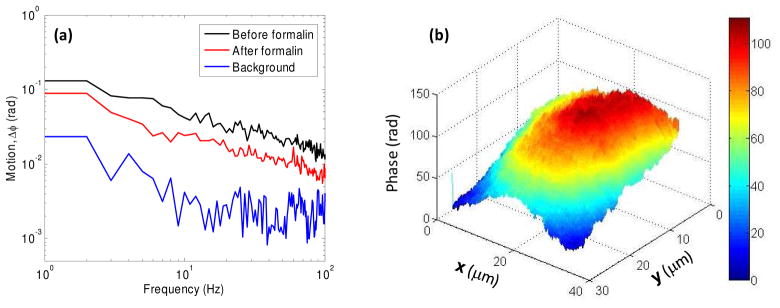
With the high phase-detection sensitivity of our instrument described in the previous section, we measured the membrane dynamics of a HeLa cell. The cells were prepared in a glass-bottom dish and incubated for ~4 hrs. Multiple 2-D interferograms were acquired at 1 kHz for 1 second with line illumination focused at the cell surface. One set of data was taken for the cell under normal culture medium followed by another measurement after chemical fixation of the same cell by adding 4% formaldehyde. Figure 4(a) shows the spatially averaged motion, Δϕ(f), associated with the cell surface up to 150 Hz before and after cell fixation. The control experiment illustrates that our instrument can easily detect the attenuation in cell membrane dynamics due to fixation. The background phase, which was measured at the glass surface, is also shown for comparison. Fitting the spectrum of cell membrane displacements using power-law suggests that Δϕ(f) ≈ f −1/2, indicating that the average cell membrane motion can be classified as thermal fluctuations. Moreover, the scale of motion ranged from 0.5 nm to 5 nm.
Fig. 4.
(a) shows spatially averaged cell membrane fluctuations, Δϕ, of a HeLa cell before and after chemical fixation. Note the reduced cellular motions after cross-linking of cellular proteins by formalin fixation. Post-formalin residual motions likely represent residual thermal motion of the cell surface. (b) 2-D surface profile of a HeLa cell measured by displacing the cell across the line-illumination. A total phase of more than 100 radians was measured with respect to the glass coverslip. Assuming the average index of the cell as 1.37, the overall cell height was estimated as 5 μm.
We also demonstrate the 2-D surface profile of a HeLa cell using our line-field quantitative phase microscope. For this purpose, the center of the line focus beam is focused on the cell surface. The size of the slit S is controlled to obtain appropriate optical signal from the glass coverslip for self-phase referencing. The sample is displaced using a motorized linear translational stage (step size ~100 nm) in a direction orthogonal to the line focus beam. A 2-D interferogram is acquired at each step of the linear stage. As described earlier, an interferogram is also acquired from the coverslip alone for background phase subtraction. Later, the set of acquired 2-D interferograms are processed to calculate the 2-D surface profile of the HeLa cell as shown in Fig. 4(b). We use Flynn’s minimum discontinuity algorithm [21] to unwrap the phase image. A total phase of more than 100 radians was measured with respect to the glass coverslip, illustrating 5 μm total cell height assuming that the average index of the cell was 1.37 [20]. Notice that the focus of the line illumination is placed at a fixed height closed to the cell surface. The 2-D phase image clearly shows the structural features in the middle of the HeLa cell. The loss of structural information near the cell boundary can be attributed to the washed out fringes due to defocused illumination.
4. Summary
In conclusion, we have proposed and demonstrated a quantitative reflection phase microscopy system based on low-coherence spectral domain optical coherence tomography and line-field illumination. The line-field phase microscope allows simultaneous depth-resolved phase measurement of multiple lateral points and enables the use of self phase-referencing method to reject common-mode noise. Specifically, the self-phase referencing suppressed phase detection noise down to as low as 41 . With such high phase sensitivity, we are able to resolve natural motion of the cell surface along the line of illumination, which was on the order of 0.5 – 5 nm. Future direction will include the detection of cellular electromotility, such as cellular motions driven by the action potential in single neurons.
Acknowledgments
This work was funded by the National Center for Research Resources of the National Institutes of Health (P41-RR02594-18), the National Science Foundation (DBI-0754339), and Hamamatsu Corporation.
Footnotes
OCIS codes: (120.3890) Medical optics instrumentation; (170.4500) Optical coherence tomography; (180.6900) Three-dimensional microscopy.
References and links
- 1.Zhang PC, Keleshian AM, Sachs F. Voltage-induced membrane movement. Nature. 2001;413(6854):428–432. doi: 10.1038/35096578. [DOI] [PubMed] [Google Scholar]
- 2.Cuche E, Bevilacqua F, Depeursinge C. Digital holography for quantitative phase-contrast imaging. Opt Lett. 1999;24(5):291–293. doi: 10.1364/ol.24.000291. [DOI] [PubMed] [Google Scholar]
- 3.Popescu G, Deflores LP, Vaughan JC, Badizadegan K, Iwai H, Dasari RR, Feld MS. Fourier phase microscopy for investigation of biological structures and dynamics. Opt Lett. 2004;29(21):2503–2505. doi: 10.1364/ol.29.002503. [DOI] [PubMed] [Google Scholar]
- 4.Ikeda T, Popescu G, Dasari RR, Feld MS. Hilbert phase microscopy for investigating fast dynamics in transparent systems. Opt Lett. 2005;30(10):1165–1167. doi: 10.1364/ol.30.001165. [DOI] [PubMed] [Google Scholar]
- 5.Popescu G, Ikeda T, Dasari RR, Feld MS. Diffraction phase microscopy for quantifying cell structure and dynamics. Opt Lett. 2006;31(6):775–777. doi: 10.1364/ol.31.000775. [DOI] [PubMed] [Google Scholar]
- 6.Wu J, Yaqoob Z, Heng X, Lee LM, Cui XQ, Yang CH. Full field phase imaging using a harmonically matched diffraction grating pair based homodyne quadrature interferometer. Appl Phys Lett. 2007;90(15):151123. [Google Scholar]
- 7.Lue N, Choi W, Popescu G, Ikeda T, Dasari RR, Badizadegan K, Feld MS. Quantitative phase imaging of live cells using fast Fourier phase microscopy. Appl Opt. 2007;46(10):1836–1842. doi: 10.1364/ao.46.001836. [DOI] [PubMed] [Google Scholar]
- 8.Sarunic MV, Weinberg S, Izatt JA. Full-field swept-source phase microscopy. Opt Lett. 2006;31(10):1462–1464. doi: 10.1364/ol.31.001462. [DOI] [PubMed] [Google Scholar]
- 9.Choma MA, Ellerbee AK, Yang CH, Creazzo TL, Izatt JA. Spectral-domain phase microscopy. Opt Lett. 2005;30(10):1162–1164. doi: 10.1364/ol.30.001162. [DOI] [PubMed] [Google Scholar]
- 10.Joo C, Akkin T, Cense B, Park BH, de Boer JF. Spectral-domain optical coherence phase microscopy for quantitative phase-contrast imaging. Opt Lett. 2005;30(16):2131–2133. doi: 10.1364/ol.30.002131. [DOI] [PubMed] [Google Scholar]
- 11.Yamauchi T, Iwai H, Miwa M, Yamashita Y. Low-coherent quantitative phase microscope for nanometer-scale measurement of living cells morphology. Opt Express. 2008;16(16):12227–12238. doi: 10.1364/oe.16.012227. [DOI] [PubMed] [Google Scholar]
- 12.Lexer F, Hitzenberger CK, Fercher AF, Kulhavy M. Wavelength-tuning interferometry of intraocular distances. Appl Opt. 1997;36(25):6548–6553. doi: 10.1364/ao.36.006548. [DOI] [PubMed] [Google Scholar]
- 13.Hausler G, Lindner MW. Coherence Radar” and “Spectral Radar” - New Tools for Dermatological Diagnosis. J Biomed Opt. 1998;3(1):21–31. doi: 10.1117/1.429899. [DOI] [PubMed] [Google Scholar]
- 14.Ellerbee AK, Izatt JA. Phase retrieval in low-coherence interferometric microscopy. Opt Lett. 2007;32(4):388–390. doi: 10.1364/ol.32.000388. [DOI] [PubMed] [Google Scholar]
- 15.Endo T, Yasuno Y, Makita S, Itoh M, Yatagai T. Profilometry with line-field Fourier-domain interferometry. Opt Express. 2005;13(3):695–701. doi: 10.1364/opex.13.000695. [DOI] [PubMed] [Google Scholar]
- 16.Grajciar B, Pircher M, Fercher AF, Leitgeb RA. Parallel Fourier domain optical coherence tomography for in vivo measurement of the human eye. Opt Express. 2005;13(4):1131–1137. doi: 10.1364/opex.13.001131. [DOI] [PubMed] [Google Scholar]
- 17.Yasuno Y, Endo T, Makita S, Aoki G, Itoh M, Yatagai T. Three-dimensional line-field Fourier domain optical coherence tomography for in vivo dermatological investigation. J Biomed Opt. 2006;11(1):014014. doi: 10.1117/1.2166628. [DOI] [PubMed] [Google Scholar]
- 18.Nakamura Y, Makita S, Yamanari M, Itoh M, Yatagai T, Yasuno Y. High-speed three-dimensional human retinal imaging by line-field spectral domain optical coherence tomography. Opt Express. 2007;15(12):7103–7116. doi: 10.1364/oe.15.007103. [DOI] [PubMed] [Google Scholar]
- 19.Popescu G, Park Y, Dasari RR, Badizadegan K, Feld MS. Coherence properties of red blood cell membrane motions. Phys Rev E Stat Nonlin Soft Matter Phys. 2007;76(3 Pt 1):031902. doi: 10.1103/PhysRevE.76.031902. [DOI] [PubMed] [Google Scholar]
- 20.Choi W, Fang-Yen C, Badizadegan K, Oh S, Lue N, Dasari RR, Feld MS. Tomographic phase microscopy. Nat Methods. 2007;4(9):717–719. doi: 10.1038/nmeth1078. [DOI] [PubMed] [Google Scholar]
- 21.Flynn TJ. Two-dimensional phase unwrapping with minimum weighted discontinuity. J Opt Soc Am A. 1997;14(10):2692–2701. [Google Scholar]


