Abstract
We have recently presented a new algorithm for high-speed parallel processing of ultrasound pulse-echo data for real-time three-dimensional (3-D) imaging. The approach utilizes a discretized linear model of the echo data received from the region of interest (ROI) using a conventional beam former. The transmitter array elements are fed with binary codes designed to produce distinct impulse responses from different directions in ROI. Image reconstruction in ROI is achieved with a regularized pseudoinverse operator derived from the linear receive signal model. The reconstruction operator can be implemented using a transversal filter bank with every filter in the bank designed to extract echoes from a specific direction in the ROI. The number of filters in the bank determines the number of image lines acquired simultaneously. In this paper, we present images of a cyst phantom reconstructed based on our formulation. A number of issues of practical significance in image reconstruction are addressed. Specifically, an augmented model is introduced to account for imperfect blocking of echoes from outside the ROI. We have also introduced a column-weighting algorithm for minimizing the number of filter coefficients. In addition, a detailed illustration of a full image reconstruction using subimage acquisition and compounding is given. Experimental results have shown that the new approach is valid for phased-array pulse-echo imaging of speckle-generating phantoms typically used in characterizing medical imaging systems. Such coded-excitation-based image reconstruction from speckle-generating phantoms, to the best of our knowledge, have not been reported previously.
Index Terms: Acoustic arrays, biomedical imaging, image reconstruction, parallel processing
I. Introduction
REAL-TIME imaging requires sufficiently high frame refresh rates. In pulse-echo ultrasound imaging, the data acquisition rate of a single image line is determined by the speed of sound in the medium and the maximum imaging depth. Therefore, parallel acquisition and processing of echo data from multiple image lines are required for real-time reconstruction of an image consisting of a large number of scan lines [such as in three-dimensional (3-D) imaging].
Current commercially available ultrasound imaging systems form an image by sequentially transmitting a pulse along one image line and acquiring return echoes along the same line with a single dynamic-focus receive beam. Considering general clinical applications with possible imaging depth of 20 cm, the acquisition time of one image line is on the order of 260 μs. The frame acquisition time of a two-dimensional (2-D) clinical image (typically consisting of 96–160 lines) required by sequential image line processing is between 25 and 41.6 ms. This allows a frame refresh rate of 24–40 frames/s (fps), which is still commensurable to the television frame refresh rate and adequate for producing a real-time image. However, if the 2-D imaging region of interest (ROI) is extended to a 3-D pyramidal volume, the number of scan lines will dramatically expand to above 10 000 lines per image. The frame refresh rate achieved by sequential processing could be as low as 0.3 fps. Hence, real-time 3-D pulse-echo imaging via the conventional sequential data acquisition approach is impossible. To meet the real-time requirement on frame refresh rates, a real-time 3-D imaging system must be capable of simultaneously acquiring and processing of large number of image lines (64–94 lines). Even in 2-D echocardiography, much higher frame rates than 30 fps are highly desirable. Therefore, high-speed parallel acquisition and processing of multiple image lines will be needed in this application as well. An eightfold to tenfold increase in the image acquisition rate might be sufficient for this application.
Recent progress in transducer fabrication and very-large-scale integration signal processing have motivated several research groups to pursue high-speed ultrasound pulse-echo imaging systems capable of parallel processing multiple image lines for real-time 3-D imaging applications [3], [18], [23], [24], [26], [31], [33], [35]. Basically, two approaches have been proposed and investigated for realizing parallel image line processing. One approach is to modify the beam former so that it creates a limited number of receive beams surrounding a main beam direction [22], [26], [31], [35]. The number of receive beams determines the number of image lines to be acquired simultaneously. A particular imaging system based on this approach was developed by von Ramm et al. [26], [34], [35]. According to a recent report [34], their third-generation volumetric imaging system can create 16 parallel receive beams and scan a 65° × 65° pyramidal volume (with maximum imaging depth 15 cm) at the rate of 20 fps. Due to the use of a wide beam for transmit focusing, however, the above system suffers from the loss of both spatial and contrast resolution. Furthermore, with only 16 parallel receive beams available, currently, the scan lines in a typical volumetric image are separated by 1° in both the azimuthal and the elevation directions. This scan line density may not be high enough for producing high-quality volumetric images for some clinical diagnostic purposes. Increasing scan line density (or extending the current imaging volume size) requires generating more parallel receive beams. This may eventually lead to unaffordable hardware costs and/or low beam-forming quality.
Another approach to achieving parallel image line processing is via coded-excitation [14], [21]. This idea originates from multiple access techniques developed in communication theory [30]. The use of coded-excitation, which is typically implemented by driving transmit elements with properly selected coded sequences, generates independent coded wavefronts traveling along different image lines. Ideally, if these coded wavefronts are orthogonal, a matched filter bank can be used for extracting echoes from all the image lines in parallel.
Conventional coded-excitation systems are implemented based on matched filtering. The major drawback of using matched filtering is that the image reconstruction quality is significantly affected by imperfect orthogonality between coded wavefronts associated with different image lines. Hence, efforts were directed toward improving coded-excitation methods and coded sequence selection to achieve better coding results. Due to the limitation of using finite length coded sequences, however, the established coded wavefronts are always mutually correlated. Conventional coded-excitation systems usually suffer from severe correlation artifacts and, therefore, fail to find applications in medical imaging.
A new coded-excitation pulse-echo imaging system has been presented in our previous reports [5], [27], [28]. The system achieves parallel image line processing by employing a transversal filter bank consisting of a set of pseudoinverse (PI) filters. Unlike a matched filter bank, this filter bank is designed to be capable of decoupling echoes from different image lines before providing matched filtering along the range direction. Thus, the correlation artifacts caused by nonideal spatial coding can be significantly reduced. This overcomes a major drawback which has been obstructing the use of coded-excitation imaging systems in medical imaging.
In this paper, an effective design approach is introduced for achieving the above transversal filter bank. The method is based on a regularized PI image reconstruction operator derived from a discretized spatio-temporal formulation of the system presented in our previous reports [5], [27]–[29]. A complete description of using the design approach in practical applications is also provided. As a preliminary test, a parallel processing coded-excitation imaging system consisting of nine PI filters is established based on the theoretical model for reconstructing a speckle-generating phantom image. With parallel processing capability, the phantom test results indicate that the proposed filter-based coded-excitation system can provide speckle-generating images at a higher acquisition rate compared to the conventional delay-and-sum beam-forming approach.
It should be pointed out that the code length considerations are different between our system and the conventional coded-excitation systems. In conventional coded-excitation systems the longer the coded sequence the lower the range sidelobes and the higher the range resolution. In addition, a significant enhancement in the signal to noise results in an imaging medium free of clutter. Unfortunately, in a speckle-generating medium, there is a clutter component in the received signal of the correlation system that leads to significant reduction in the SNR. These contradictory effects of the code length on the SNR presented a dilemma for conventional coded-excitation systems that, to the best of our knowledge, was not solved effectively for imaging in a speckle-generating environment. The approach described in this paper, on the other hand, purposely uses short code sequences typically on the order of 64-chip maximal length sequences (m-sequences). The code length should be sufficiently high to assure significant overlap between the transmitted codes throughout the ROI. By keeping the code short, however, the clutter component due to speckle can be kept under control. To give a specific example, all the results presented in this paper are generated using 64-chip segments of an m-sequence with an axial extent of about 5 mm. This is only 10–12 times the length of a conventional pulse, but is considerably shorter than a typical pulse sequence in a conventional coded-excitation system (on the order of several centimeters [9]. In our system, range sidelobe suppression is a result of the use of the (regularized) pseudoinverse operator (PIO) upon matched filtering and not the length of the code.
The rest of this paper is organized as follows. The proposed filter design approach is presented in Section II. Section III demonstrates phantom reconstruction results based on a coded-excitation imaging system which employs a 128-element linear array operating at 3.5 MHz. Finally, discussions and conclusions are given in Sections IV and V, respectively.
II. Filter Bank Design
The establishment of the proposed filter-based parallel processing imaging system lies in designing a finite impulse response (FIR) filter bank capable of both lateral echo decoupling and range compression. The design of such a filter bank, as addressed herein, is based on a discretized spatio-temporal linear model of the coded-excitation imaging system presented in our previous papers [5], [27], [28]. The presentation given below consists of: 1) An overview of the system model, 2) a description of the filter bank design problem, 3) the design approach, and 4) its practical implementation strategies for medical imaging applications.
A. System Model
We begin with an overview of the proposed coded-excitation imaging modality [5], [27], [28]. Referring to a typical one-dimensional (1-D) linear array imaging system shown in Fig. 1, a set of mutually uncorrelated coded sequences is launched into the medium via transmit elements to generate coded wavefronts. A receive beam former is then employed to selectively receive echoes from Nφ image lines within a range interval [Rmin, Rmax] and mask echoes and noise from other directions to improve signal-to-noise ratio (SNR) [27]. Assuming scatterers on each image line are located on a uniform grid and the system impulse response is range shift invariant (RSI) along each image line [5], [27], the beam former gives a single receive signal equal to the coherent sum of echoes only from on-grid scatterers in the ROI. A discretized version of this receive signal, denoted as f(k), can be written as
Fig. 1.
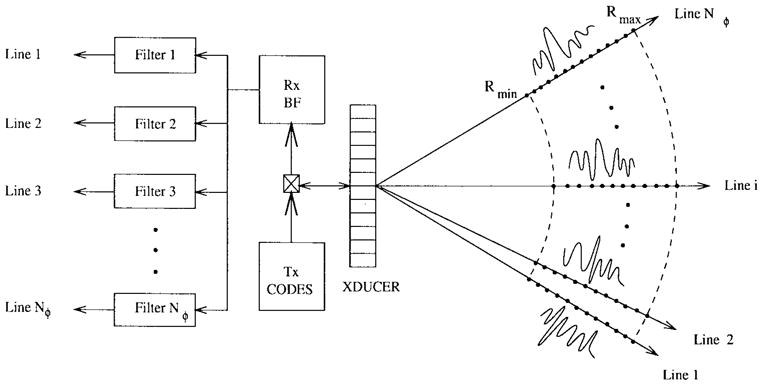
A 2-D sector-format coded-excitation pulse-echo imaging system with transversal filter bank implementation.
| (1) |
where Nr is the grid size determined by the range interval size and the sampling rate, n(k) is the noise signal, gi(k − j) is the system impulse response created by a unit strength scatterer located on the ith image line at the jth range grid position, and si(j) is the actual scatterer strength at that location.
Let Gi = [gi,1, gi,2, · · ·, gi, Nr] and gi, j be the vector version of gi(k − j). Then (1) can be rewritten as
| (2) |
where f, s and n are the vector versions of f(k), s(k), n(k), and n(k), respectively. The imaging operator G, defined as
| (3) |
is a (typically, underdetermined) matrix operator consisting of Nφ linear convolution matrices. Thus, a unique minimum-norm least-square estimate (denoted by ŝ below) of the scatterer vector s can be expressed as
| (4) |
where PIO is a pseudoinverse operator [17], [25] equal to
| (5) |
The superscripts *, t, and † represent conjugate, transpose, and generalized inverse operators, respectively.
B. The Design Problem
It has been shown that the PIO defined by (5) not only provides pulse compression along the range direction, but also decouples echoes from different image lines [5], [27]–[29]. Furthermore, by applying the PIO to the receive signal f, the system can process all the Nφ image lines in parallel.
Direct hardware implementation of the above PIO, however, requires Nφ× Nr filters [27]. The major concern of our filter bank design is to reduce the number of filters from Nφ× Nr to Nφ. Namely, echoes from each image line can be extracted by a single filter. For further reducing hardware costs, the design approach should lead to filters with the smallest possible number of coefficients. In addition, since the filters are normally established based on a simulation model of the system, a robust implementation of the filter bank is also an important objective of the design problem. In this paper, we consider robustness against additive noise as well as modeling errors.
C. The Design Approach
The design approach presented below covers two issues: 1) the derivation of filters based on the PIO and 2) methods of computing filter coefficients for improving robustness and reducing filter length.
1) Filter Derivation
Based on the range shift-invariant assumption of the system impulse responses and the linear convolution formulation of G, previous studies have indicated that the PIO defined by (5) may be implemented by a filter bank { } defined by [5], [27], and [29]
| (6) |
where gi, Nc is the impulse response vector corresponding to the midrange (indexed by Nc) point on the ith image line, the operator [·]r maps a vector into its time reversed version, and the superscript I indicates that is a PI filter.
Note that, with the above filter bank, the echo extraction of each image line can be achieved by processing the receive signal f with a corresponding filter via linear filtering (or convolution). The hardware implementation cost of the PIO is significantly reduced since the number of filters has been minimized from original Nφ × Nr to current Nφ. It can be shown that, unless each gi, k has an impulse-like autocorrelation function, (6) defines a close but not an exact filter bank implementation of the PIO. Factors that may cause modeling errors include frequency dependent attenuation and tissue aberrations. These factors are not addressed in this paper but are subject to ongoing investigations by our group.
The design method proposed in this paper provides an exact filter bank implementation of the PIO with the same number of Nφ FIR filters. Instead of using linear convolution formulation, each Gi (i = 1, 2, · · ·, Nφ) used for constructing G is reformulated as circulant (i.e., a circular convolution matrix) [1], [8]. The operator G thus becomes a row block circulant matrix. Note that, under such a row block circulant formulation, (2) represents the receive signal f by a summation of Nφ circular convolutions. Physically, however, f should be equal to a summation of Nφ linear convolutions according to (1). In terms of the convolution theory, this problem can be solved by properly padding zeros (according to the range interval size to be processed) to the original impulse response vectors before constructing G [1], [8].
The advantage of using a circulant formulation of Gi is that the matrix can be diagonalized as [1], [8], and [32]
| (7) |
where F and F−1 are the backward and forward discrete Fourier transform (DFT) matrices, respectively. Di is a diagonal matrix with the kth diagonal element {Di}k, k equal to the kth DFT coefficient [denoted by λi(k) below] of the zero-padded system impulse response associated with the ith image line. From (5) and (7) we obtain
| (8) |
where is a diagonal matrix defined by
This leads to the following expression of (4)
| (9) |
Equation (9) indicates that the scatterer reconstruction along each image line can be separately obtained. For instance, let ŝi be the reconstructed scatterers distributed along the ith image line. The vector ŝi can then be obtained by
| (10) |
Note that (10) is a matrix-product expression of circular convolution since PIOi = FZi F−1 is a circulant matrix. Thus, ŝi can be equivalently obtained by filtering the receive signal f with a FIR filter defined by
| (11) |
where M is the total number of rows of matrix operator PIOi, PIOi( :, 1) and PIOi(M, :) represent the first column and the last row vectors of matrix operator PIOi, respectively. Equation (10) leads to an exact FIR filter bank implementation of the PIO. Unlike the filters defined by (6), the filtering process in this case is realized based on circular convolution, rather than linear convolution. As mentioned above, it gives results equivalent to linear convolution once the original system responses are properly zero-padded.
2) Filter Computation
According to (8) and (11), the coefficients of each filter in the filter bank defined by (11) can be directly obtained from the matrix operator, PIO, defined by (5). Hence, our filter computation is approached by computing the PIO. The computation of the PIO, in this paper, is achieved using the regularized singular value decomposition (SVD) technique and the column-weighting least-square technique [10], [27], [29]. The use of the regularized SVD technique leads to a robust filter bank. The use of the column-weighting least-square technique, on the other hand, minimizes the number of coefficients of each filter and, therefore, achieves further reduction in the hardware cost [29]. A detailed description of these two techniques is given below.
i) SVD regularization
The computation of the PIO, using (7) and (8), may be achieved by evaluating the DFT coefficients of Nφ zero-padded system impulse responses and the DFT matrices F and F−1. In this study, however, we directly calculate the PIO defined by (5) using the regularized SVD technique [10], [27], [28]. This is preferred as the system defined by (2) is normally ill conditioned. The regularized SVD technique is a very effective tool for finding a robust PIO (or equivalently, a robust filter bank) [4], [13], [27], [29]. In [28] we have shown that the use of regularization leads to a PIO which is robust against both additive noise and model inaccuracies. In particular, the off-grid scatterer problem was shown to be effectively solved by this approach.
In terms of the regularized SVD technique [4], a modified single parameter regularized PIO can be expressed by
| (12) |
where σm ≥ 0(m = 1, 2, · · ·, R) are the singular values, um and vm are the singular vectors associated with σm, R is the rank of G, and β is a nonnegative regularization parameter. Typically, a larger β value results in a more robust PIO. It improves the image contrast resolution and as a tradeoff, reduces the image spatial resolution. The coefficients of a robust filter bank { } can be obtained by properly choosing column or row vectors from the above PIOβ according to (8) and (11).
ii) Column weighting
The purpose of using the column-weighting least-square technique is to minimize the filter length and, therefore, further reduce the hardware cost of the filter bank. The column-weighted least-square solution of (2) is achieved using an objective function defined by [10]
| (13) |
where s = Ws̄, W is a diagonal weighting matrix. The original scatterer reconstruction given by (4) is now modified as ŝ = PIOW f. Here, PIO is a weighted PI operator defined as
| (14) |
and |W|2 = WW*t. Similarly, the set of Nφ FIR filters are directly obtained from the PIOW by properly choosing row or column vectors according to (8) and (11). The computation of the above PIOW is approached using the proposed regularized SVD technique.
Note that the selection of W normally affects the filter coefficient length and the filtering performance. In this study, the diagonal elements of W are selected from low pass window functions [12].
D. Implementation Strategies
The design of the filter bank, according to our approach, requires knowing the system model defined by (2). In practical applications, this model is typically established via simulation, assuming that the system parameters (such as codes, beam-forming configurations, etc.) required in the simulation are known. This, however, inevitably introduces modeling errors (i.e., the difference between the true system model and the simulated system model). The existence of modeling errors may significantly degrade the expected performance of the established filter bank in image reconstruction. It may also result in inconsistent filtering performance from one application to another.
Modeling errors stem from several different sources. Some of them, such as the existence of medium inhomogeneities and off-grid scatterers [28], are object dependent. Others, like imperfections in the receive beam as a spatial mask for blocking unwanted image lines and the use of improper beam-forming configurations for selecting a ROI or image lines for model construction [27], are object independent. Some object dependent modeling errors have been studied in our previous report [28]. The study given below aims at minimizing the object independent modeling errors by properly constructing the system model. Together with PIO regularization, minimization of modeling errors leads to marked improvements in reconstructed image quality. In this study, the following strategies are suggested in implementing the proposed filter design approach for minimizing object independent modeling errors.
1) Model Augmentation
One of the major object independent modeling errors is attributed to receive beam imperfections. Referring to (2), the received signal, f, is modeled as the coherent sum of the echoes coming only from image lines strictly located inside the ROI. Therefore, to construct f, an ideal (receive) spatial mask is assumed to completely block echoes from all the image lines outside the ROI after transmitting coded sequences into the medium. The spatial mask used in reality, however, is achieved by a conventional delay-and-sum beam former designed by applying a proper apodization function to the receive aperture. Its performance is characterized by the beam pattern created by the beam former. No matter how the beam former is designed, however, beam pattern sidelobes always exist due to the use of finite aperture size. The existence of receive beam pattern sidelobes leads to a nonideal spatial mask which cannot perfectly block echoes from unwanted image lines. Unlike the additive noise signal n [see (2)], the contribution of unwanted echoes, referred to as sidelobe leakage below, is system (or beam-forming) dependent and is normally correlated with the desired receive signal f. Hence, it may result in unremovable correlation artifacts in the reconstructed image. This is due to the fact that the filter bank, based on the model defined by (2), is designed to decouple echoes coming only from the image lines inside the ROI [27]–[29].
Complete removal of the above sidelobe leakage effect on image reconstruction lies in accounting for all echoes received by the beam former. Theoretically, this requires the extension of the original model to account for received coded wavefronts associated with all the unwanted image lines covered by the beam pattern sidelobes. This, however, is almost impossible since the total number of unwanted image lines could be unreasonably high.
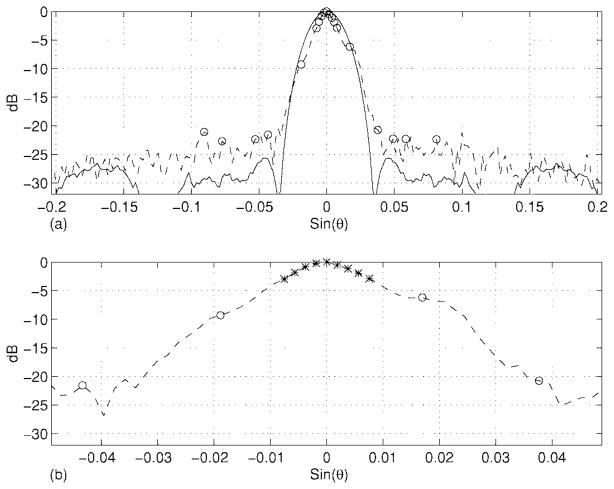
Our strategy to deal with this problem is to establish an augmented model by selectively including unwanted image lines located along high peak sidelobe directions. Considering a typical example shown in Fig. 2(a), the solid line plot in the figure represents the directivity pattern of the received coded wavefronts (or, equivalently, the system impulse responses). This directivity pattern is uniquely determined by the beam pattern created by beam-forming. It should be noted that we make a distinction between beam pattern and directivity pattern. The former is computed based on the conventional pulse-echo beam-forming without coding while the latter is the array radiation pattern when the codes are used on transmit. Compared with the beam pattern, the directivity pattern is more appropriate for characterizing the performance of the actual spatial mask created by the beam former, since our received signal model is built based on the received coded wavefronts. The ROI in this example is covered by the main lobe of the directivity pattern. The “*” signs in Fig. 2(b) represent the image lines to be reconstructed. The original model defined by (2) is constructed based on these image lines only. The augmented received signal model, however, is constructed by extending the above model with a set of image lines selected from peak sidelobe directions (denoted by “○” signs in the figure). Compared with the filter bank derived from the original model, the filter bank derived from the augmented model not only decouples echoes coming from the image lines (to be reconstructed) inside the ROI, but also decouples the image lines along the selected peak sidelobe directions. Note that most sidelobe contribution comes from high peak sidelobe directions. The coded wavefronts associated with directions close to these selected peak sidelobe directions are typically highly correlated. The additional decoupling capability of the filter bank may significantly reduce the reconstruction errors caused by sidelobe leakage.
Fig. 2.
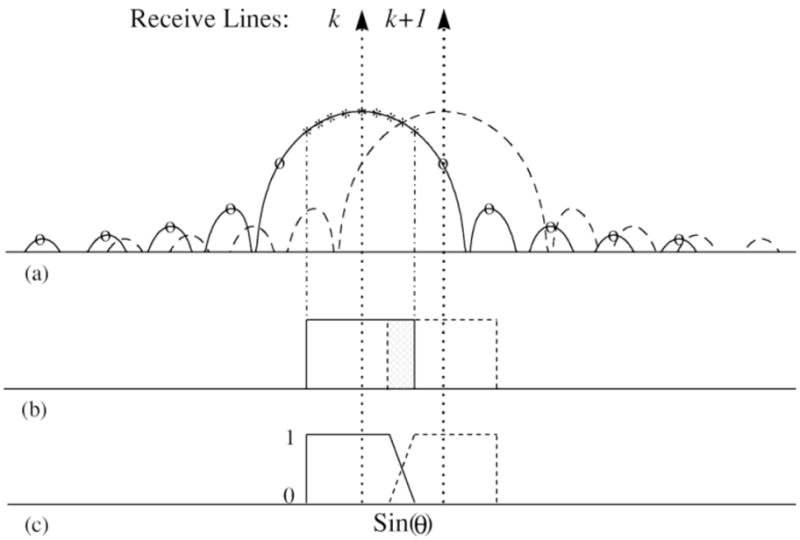
(a) Directivity patterns of the received coded wavefronts associated with the kth (solid) and (k + 1)th (dash) receive lines; “○” and “*”: image directions for constructing the augmented G; “*”: image directions for filtering, (b) filtering block regions associated with receive image line k (solid) and k + 1 (dash); shaded area: the overlapping region, and (c) the weighting function for compounding two neighboring filtering block regions.
2) Subregion Compounding
Another major object independent modeling error is concerned with the violation of the RSI assumption imposed on the system impulse responses [27]. This typically happens when we try to reconstruct a large ROI with range interval size beyond the limit set by the RSI assumption. To avoid this problem, it is necessary to restrict the size of the ROI to be reconstructed or, equivalently, the filtering depth of the established filter bank. This could reduce the cost-effectiveness of the system, since we may have to partition a full size imaging region into smaller subregions and reconstruct each subregion with a specified filter bank designed based on that subregion. An efficient subregion partition approach is thus required to balance the above modeling error and the cost-effectiveness of the system.
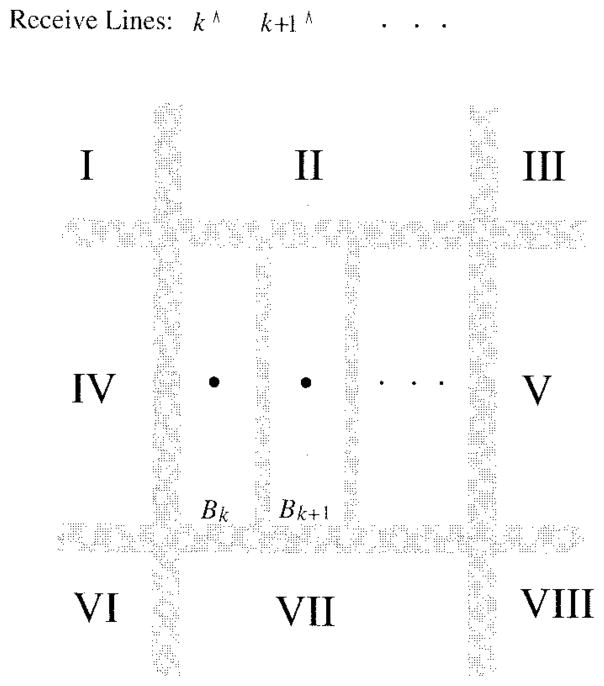
In this study, a subregion compounding method is introduced for dealing with the above problem. According to our strategy, a (large) full size imaging region is partitioned into (partially overlapped) subregions with each of them consisting of a number of (partially overlapped) fundamental filtering block regions of equal size (see Fig. 3). The reconstruction of the segments of image lines covered in a typical fundamental filtering block region is (simultaneously) obtained by filtering a single receive signal with a filter bank established based on that block region. Here, the receive signal, which is equal to the coherent sum of the echoes coming from all the scatterers located inside the block region, is obtained by transmitting codes with steering along (or focusing at the midrange of) the center image line inside the block region, and then recording echoes with the receive beam former focused at the midrange of the same center image line. Above, the receive beam former is designed, based on a properly selected apodization function, for accepting echoes from image lines inside a limited angle defined by the lateral size of a typical block region. Receive focusing allows the receive beam former to select different filtering block regions. Transmit steering (or focusing), on the other hand, allows us to generate uniform radiation field (i.e., coded wavefronts with uniform directivity) within any selected block region. This is very important since, compared to matched filtering or correlator-based coded-excitation applications aiming to improve either data acquisition rates [14], [21] or SNR [20], our system utilizes much shorter coded sequences with decoupling and (range) pulse compression capability [28]. This is best illustrated by the experimental result shown in [27, Fig. 12], which shows that both pulse compression and range sidelobe reduction is feasible with the PI filtering operation. The longer the code the larger the leakage component from speckle in the axial direction. A very short code, on the other hand, may result in highly correlated waveforms from different directions in the ROI. Therefore, the code length should be chosen such that maximum degree of overlap throughout the ROI is achieved with the shortest possible code. For correlation systems, on the other hand, the longer the sequences, the better range resolution [21] or SNR [20].
Fig. 3.
A description of achieving a large size image by compounding subregion images reconstructed by switching filter banks; “●”: receive focal points; shaded areas: the overlapping regions; {Bk+i | i = 1, 2, · · ·}: filtering block regions located in the center subregion.
Fig. 12.
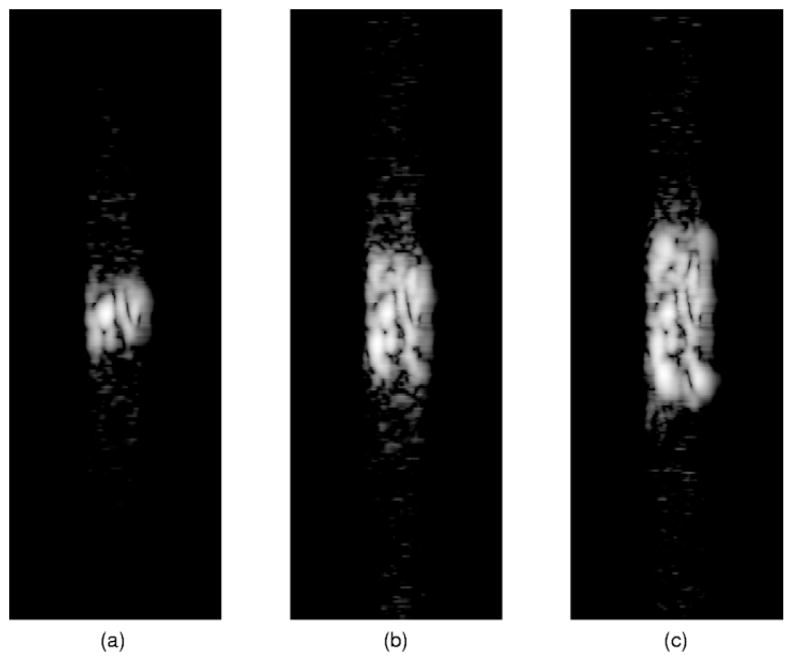
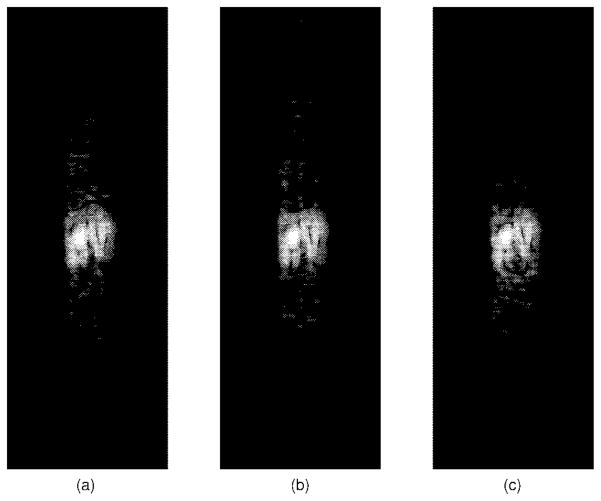
Images (30 dB) of simulated received coded-wavefronts with the receive aperture apodized by a Kaiser window and a Sinc window Sin(α(N − 63.5))/(N − 63.5); (a) a Kaiser window with α = 6; (b) a Sinc window with α = 2; and (c) a Sinc window with α = 3.
The use of short coded sequences brings us advantages in realizing filters with small number of coefficients [29]. Furthermore, it may also lead to small aberration errors caused by medium inhomogeneities. However, if no transmit steering or focusing is used, it will normally result in a uniform radiation field restricted within a very limited angular interval (centered along the array normal direction) due to the short time duration of the coded sequences. An additional advantage of using transmit steering (or focusing) is that it allows for coded wavefronts traveling a longer distance along the selected image lines without significant distortion. The filtering depth (or the range interval size of the block region) can thus be extended.
Based on the above transmit and receive beam-forming configuration, the radiation fields generated in two neighboring filtering block regions are very likely to be the same. Hence, according to our approach, the whole imaging region is partitioned into subregions with each of them defined by a number of closely located block regions where the same radiation field can be generated. Since system models established based on block regions inside a subregion are very similar, a unique filter bank can be found (typically based on the center block region located in the subregion) for reconstructing those block regions. The image of the subregion is then achieved by compounding those reconstructed block regions (see Fig. 2). Finally, the whole image is obtained by compounding images of subregions reconstructed by switching different filter banks (see Fig. 3).
It should be mentioned that, after combining two neighboring filtering block regions or subregions, some artifacts, referred to as blocking effect below, may appear in the compounded image. Referring to Figs. 2(b) and 3, this blocking effect can be removed by allowing partial overlapping between neighboring block regions or subregions and combining the overlapping area with a properly designed compounding function [see Fig. 2(c)] [2].
III. Results
Simulation results presented in our previous reports have shown that the filter bank derived from the regularized PIO has both lateral echo decoupling and range pulse compression capabilities [27]–[29]. Our results have also verified the effectiveness of using the proposed column-weighting technique for designing short filters [29]. In this section, tests based on a speckle-generating cyst phantom are presented to show the validity of the proposed filter-based coded-excitation imaging modality. The phantom was constructed from gelatin with nylon particles used for mimicking tissue scatterers. The particle concentration was appropriately selected so that a fully developed speckle pattern was obtained [15]. Each cyst region (of diameter about 2 cm) contains no particles and is anechoic. A ring-like region at the border of each cyst has slightly lower scatterer concentration than the rest of the phantom.
The tests are demonstrated by comparing our filter-based phantom images with the phantom images obtained via the conventional delay-and-sum beam-forming approach. Here, the conventional beam-forming images are reconstructed based on a pulse-echo ultrasound RF data set collected (for synthetic beam-forming purpose) from the phantom using the linear array described in Section I. The filter-based images are reconstructed by a parallel processing coded-excitation system with nine filters established using our design approach. The coded-excitation phantom data used for reconstruction was obtained by convolving each transmit element RF data record collected from the phantom with a coded sequence of length 64 assigned to that transmit element. The set of coded sequences are selected from segments of maximum length sequences generated by shift registers [36].
The presentation given below consists of two parts. In the first part, a detailed description is provided to show the construction of the filter banks (or, equivalently, the parallel processing imaging system) for reconstructing filter-based images. In the second part, images associated with a subregion of size 60° × 2.723 cm are presented to show the validity of our parallel image line reconstruction approach and the effect of regularization on image quality. An example of achieving a full size (90° × 8.0 cm) filter-based image via subregion compounding is then provided. Unless stated otherwise, all gray scale phantom images are displayed over a 40-dB dynamic range.
A. Filter Construction
The filter banks used in our phantom tests are obtained via simulations. Given the array transducer parameters, coded sequences, and the beam-forming configuration used for constructing the receive signal, the simulation procedure can be summarized by the following five steps: 1) Mimic the coded-excitation output signals by convolving the simulated transducer impulse response with coded sequences. 2) At the receive focal range distance, properly define a 1-D fine grid which spans from −45° to +45° along the lateral direction [28]. 3) Compute the received coded wavefronts (i.e., system impulse responses) for all the image lines defined by the above grid. 4) Find the directivity pattern of the received coded wavefronts in terms of l2 – norm [16] and then determine the image lines used for constructing an augmented G matrix according to the approach described in Section II-D1. 5) Choose a proper regularization value β and find the filter coefficients by computing the regularized PIO defined by (12).
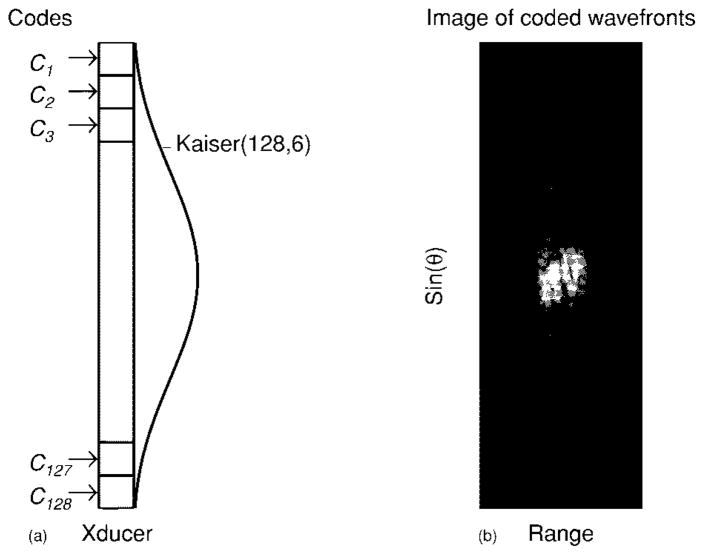
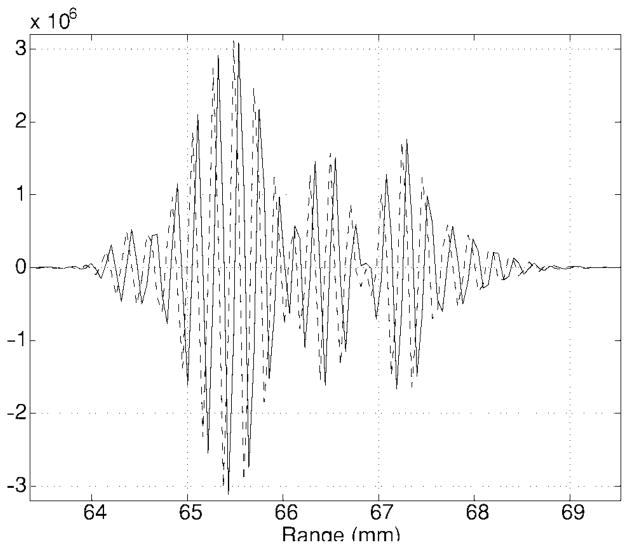
As a typical example, the construction of the filter bank used for reconstructing the subregion images shown in Fig. 8 is demonstrated here. According to our reconstruction strategies, the subregion under consideration is divided into filtering blocks of equal size (specified below). The filter bank to be established in this example is associated with the center block region. Referring to Fig. 4(a), the receive signal is obtained by sending 128 64-chip maximal length (ML) coded sequences into the block region with transmit focusing at the midrange of the center image line and then recording the echoes with a receive beam former focused at the same location. The apodization function applied to the receive aperture is defined by a 128-point Kaiser window with parameter α = 6 [12]. Fig. 4(b) shows the image of the received coded wavefronts obtained using the same beam-forming configuration used for constructing the receive signal. Neighboring image lines associated with these received coded wavefronts are about 0.1° from each other. Fig. 5 gives the complex (after base-band conversion) received coded wavefronts corresponding to the center image line shown in Fig. 4(b). Note that the lateral extent of the image shown in Fig. 4(b) shows that only coded wavefronts within a very limited angle are allowed to enter the receiver due to the use of beam-forming. We also notice that, due to the imperfection of the receive beam former as a spatial mask [see the beam pattern plot in Fig. 6(a)], sidelobe leakage appears in Fig. 4(b). This is also shown in the directivity pattern of the simulated received coded wavefronts given by Fig. 6. By properly selecting the sidelobe peaks of the simulated directivity pattern, an augmented G can be established using the simulated coded wavefronts associated with 19 image lines or directions [see signs “○” in Fig. 6(a)]. Here, each of 19 received coded wavefront signals was padded by 50 zero samples. Referring to (3) and Section II-C1, the augmented G consists of 19 circular convolution matrices formed by these 19 zero-padded coded wavefront signals.
Fig. 8.
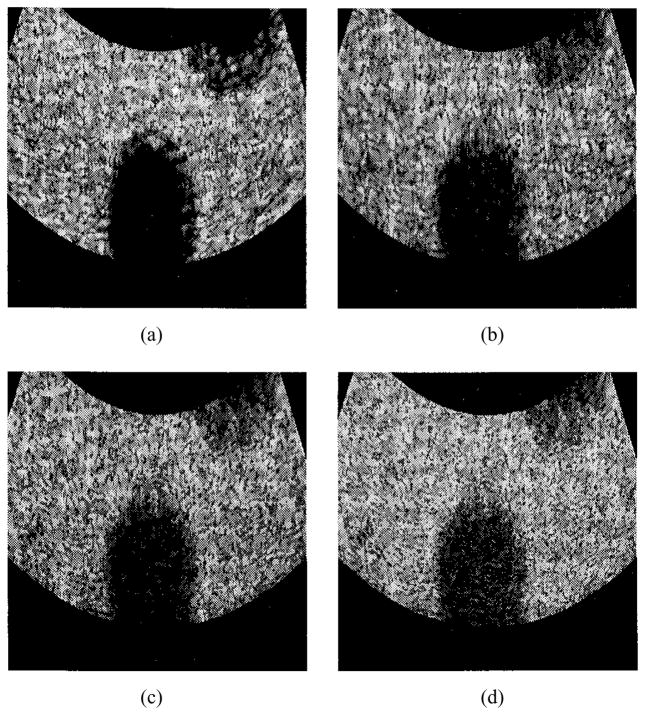
Images reconstructed from a subregion of size 60° × 2.723 cm: (a) the conventional delay-and-sum beam-forming image; (b) the filter bank-based image with β = 34.61; (c) the filter bank-based image with β = 10.62; and (d) the filter bank-based image with β = 5.92.
Fig. 4.
(a) The coded-excitation configuration: sending 128 64-chip (ML) sequences and recording echoes with a receive aperture apodized by a Kaiser window with α = 6 and (b) the image (30 dB) of the simulated received coded-wavefronts obtained by beam-forming along the center image line.
Fig. 5.
The received complex (after base-band conversion) coded wavefront along the center image line; solid: real part; dash: imaginary part.
Fig. 6.
Solid line in (a) simulated wideband beam pattern based on the apodized receive aperture. Dashed lines in (a) and (b): simulated directivity pattern of the received coded wavefronts; “○” signs in (a): image lines for constructing the augmented G; “*” signs in (b): image lines for filtering.
A filter bank consisting of nine filters can thus be obtained by first computing the PIO with proper regularization in terms of the established G, and then selecting row (or column) vectors corresponding to those nine image lines [denoted by the “*” signs in Fig. 6(b)] located inside the main lobe of the directivity pattern. By applying this filter bank to the receive signal recorded by beam-forming along the center image line, echoes from these nine image lines can be extracted in parallel.
It should be pointed out that the lateral size of the block region to be reconstructed is determined by the lateral extent of the image shown in Fig. 4(b). This size can be adjusted by changing the apodization function applied to the receive aperture (see Section IV below). With the current apodization function, the lateral size of the block region (covered by the established nine filters) is about 1°. The range interval size of the block region, however, is set to satisfy the RSI assumption. With the above beam-forming configuration, the coded wavefronts can travel a range distance at least above 1 cm without significant distortion, especially in the array far field. A typical example is given by Fig. 7. Based on the above beam-forming configuration, the figure shows similar (received) coded wavefront images are obtained at three different range distances within the subregion [see Fig. 10(a)]. The range extent of the image shown in Fig. 4(b), which can be adjusted by the length of the coded sequences, affects the length of the filters to be constructed. The shorter the range extent, the shorter the filters.
Fig. 7.
Images (30 dB) of received coded wavefronts at range distances: (a) 10.0 cm; (b) 10.69 cm; and (c) 11.72 cm. The focal distance is fixed at 10.69 cm. Image (b) is simulated for establishing the filter bank to extract echoes from subregion A32 [see Fig. 10(a)].
Fig. 10.
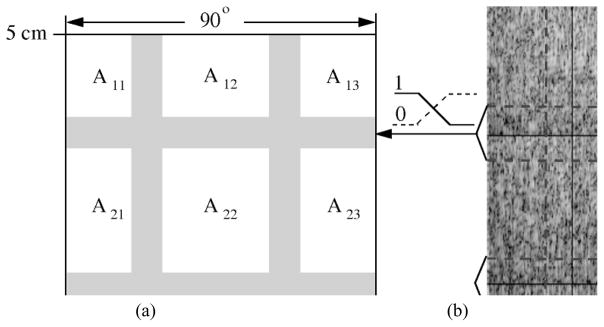
An example of reconstructing a full size (90° × 8 cm) image via subregion compounding: (a) a description of subregion partition and (b) the images of subregions with each of them constructed by a filter bank design for that subregion.
B. Phantom Images
The images displayed in Fig. 8 are reconstructed from a subregion of size 60° × 2.723 cm in terms of the phantom data previously specified. The image shown by Fig. 8(a) is reconstructed via the conventional delay-and-sum beam-forming approach based on the same array (without using apodization). The number of scan lines used in reconstructing this image is 134 (or 200 for 90°), which is slightly over the scan line density set by Nyquist criterion. For each scan line, the transmit array is focused at the midrange location. The receive array is dynamically focused. The image shown by Fig. 8(b) is reconstructed by the filter bank established via the simulation procedure described above. A relatively large regularization parameter (β = 34.61) is selected in this example for achieving a robust filter bank. According to the lateral extent of the image shown in Fig. 4(b), 60 receive image lines with spacing of about 1° are used for establishing this image. For each receive line, the filter bank processes a receive signal and simultaneously provides scatterer reconstruction along nine subdirections (defined by the filters) around the selected receive line. Here, the receive signal is obtained from the coded-excitation phantom data using the same system configuration described in Fig. 4. The whole subregion image is achieved by compounding filtering results obtained from those 60 receive lines. Compared with Fig. 8(a), Fig. 8(b) shows that our filter bank-based reconstruction approach can provide a speckle-generating image at a higher acquisition rate compared to the conventional delay-and-sum beam-forming approach. Although the image quality shown in Fig. 8(b) is degraded since many issues related to system optimization (see Section IV) are still under investigation, such a coded-excitation-based image, to the best of our knowledge, has not been reported previously.
To verify the effectiveness of regularization for improving the filter bank robustness in dealing with both system noise and modeling errors, we varied the regularization value β in computing the above filter bank. Fig. 8(c) and (d) give the images reconstructed by filter banks designed with equal to 10.62 and 5.92, respectively. From Fig. 8(b)–(d) we can see that both noise and the modeling errors are well controlled by adjusting β. By varying β, a tradeoff between spatial resolution and contrast resolution is obtained in the reconstructed image. Let CNR be the local image contrast-to-noise ratio defined in [7], [11], and [19]
| (15) |
where Īo and Īb represent the average intensity (in dB) in the cysts region and the local background region containing the cysts, respectively, and σIb denotes the standard deviation of the background intensity (in dB). The normalized CNR values of the cyst regions in Fig. 8(b)–(d) are 1, 0.9051, and 0.8339, respectively [15]. It should be noted that the CNR values were computed only for the filter-based images. Due to the limitations of our test phantom data, discussed in Section IV, the CNR values for the filter-based images are probably worse than they should be if the phantom data were fully characterized. For this reason, it is more meaningful to compare the CNR values for the filter-based images at different levels of regularization. For comparison purposes, however, the normalized CNR for the beam-forming image of Fig. 8(a) is 1.075.
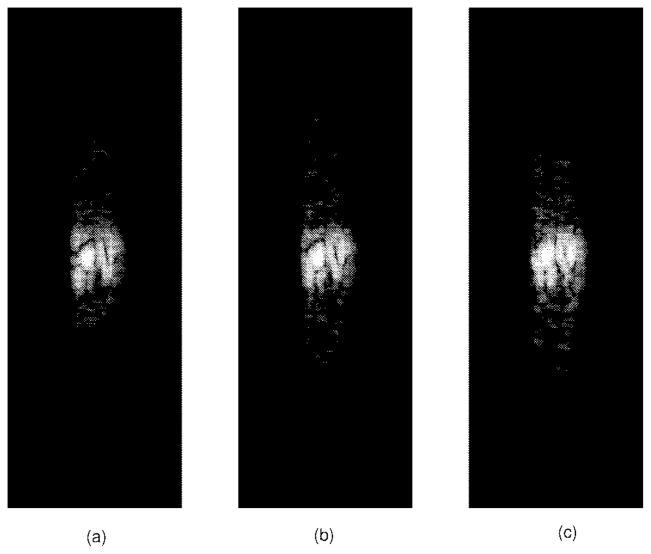
Finally, a full size phantom image covering an area of 90° × 8 cm was obtained via subregion compounding. Referring to Fig. 10, the whole area is partitioned into nine subregions. For each subregion, a unique filter bank is established following the same simulation procedure described above. As addressed above, designing different filter banks for reconstructing different subregions reduces the modeling errors caused by either beam inconsistency at different subregions or the violation of the RSI assumption. This can be shown by the images displayed in Fig. 9. We can observe the differences among the received coded wavefront patterns created in the subregions selected in this example. Fig. 10(b) shows the images of all the subregions and the overlapping areas. Each subregion image is reconstructed by a filter bank (consisting of nine filters) established based on the corresponding subregion. Fig. 11(a) shows the whole filter-based image obtained by compounding these subregion images. A similar image constructed via the conventional beam-forming approach is also provided in Fig. 11(b) for comparison.
Fig. 9.
Typical images (30 dB) of the received coded wavefronts associated with block regions located inside: (a) subregion A11; (b) subregion A22; and (c) subregion A33.
Fig. 11.
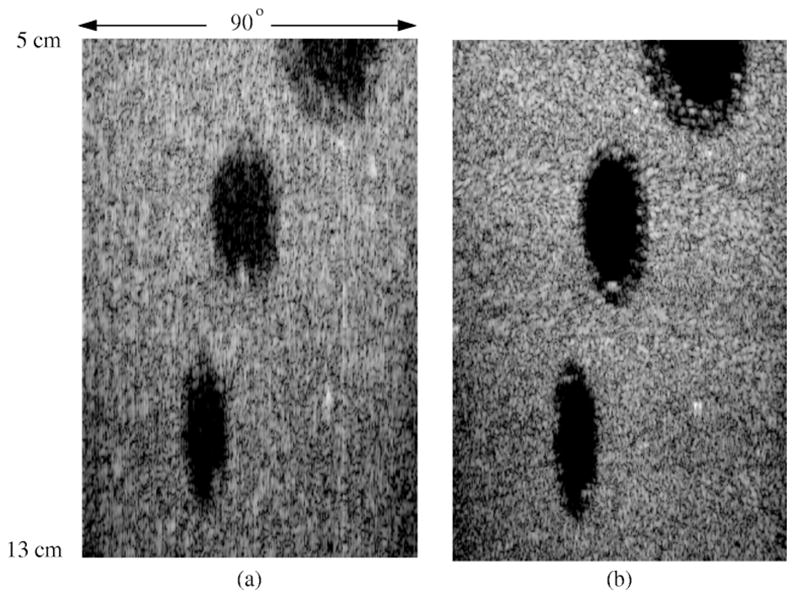
(a) The filter bank-based image obtained via subregion compounding and (b) the conventional beam-forming image.
IV. Discussion
By comparing Fig. 11(a) and (b), we can find that the filter-based image possesses most of the phantom features shown in the beam-forming image. The lateral resolution of both images are fairly close. The range resolution of filter-based image, however, is degraded. Our study indicates that the degradation of range resolution is mostly due to the filter aliasing errors in this specific test since the filter is designed based on a row-block circulant formulation of G. It is also partially due to a fairly conservative regularization parameter used for improving the robustness of the filter bank against both the modeling errors (note that the true model is unknown) and noises. Fundamentally, increasing sufficiently large Pnumber of zero-padding points will solve the aliasing problem (see Section II-C). However, it will lead to a very large matrix which is beyond the computation capability of our current machines. More effective solutions to reducing or removing filter aliasing errors are still under investigation.
Note that blocking artifacts due to subregion (as well as block region) compounding are not completely removed in the filter-based image since the compounding function [see Fig. 2(c) or Fig. 10] used in our test may not be an optimal one. We should also indicate that the subregion partitioning scheme shown in Fig. 10(a) is not optimized in terms of the system cost-effectiveness in reconstructing the image. The sizes of the subregions used in our test are quite conservative. It is quite likely that we can partition the whole region with fewer (larger size) subregions via either extensive simulations or optimizing the beam-forming configuration used for constructing the receive signal. The whole image can thus be reconstructed without switching different filter banks frequently.
It has been mentioned that the lateral extent of the received coded wavefront image shown in Fig. 4(b) can be increased by choosing proper apodization functions. Without changing the coded-excitation and beam-forming configuration used in Fig. 4, Fig. 12 gives several examples which verify the possibility of achieving the received coded wavefront images with a larger lateral extent. This is very important since larger lateral extent results in a larger size filter bank and, consequently, a higher data acquisition rate. However, this also significantly increases the computational burden in calculating filter coefficients, since with the restriction on image line spacing, the dimension of G will expand dramatically for including system responses associated with new image lines. In fact, this is the major reason why we demonstrated our filter-based imaging approach by designing a small filter bank (of size nine) in this paper. Since the filter bank we established is object independent (we leave the design of adaptive filter bank for correcting object dependent errors open at this stage), we can afford to handle extensive computing using more advanced computing facility to establish a much larger size filter bank.
Fundamentally, the image line spacing (or lateral grid spacing) within a typical block region for constructing G is determined by the system spatial resolution [28]. From most filter-based images provided in the previous section, it seems that we probably oversampled the angular space by choosing too higher image line density. This is due to the large regularization value used for calculating the filter coefficients. According to our previous studies [28], if small regularization can be allowed due to low system noise and small modeling errors, it is possible to achieve lateral resolution better than the resolution obtained via conventional beam-forming based on the same array. This feature can be recognized by comparing Fig. 8(a) and (d). The latter seems to have finer resolution cell, though the contrast resolution reduces since the filter bank has become sensitive due to the use of a small regularization value.
In this preliminary study, the design of large size filter banks as well as the problems regarding the optimization of the compounding function, beam-forming configuration, and subregion partitioning are not of major concern. However, it must be emphasized that the design choices illustrated in this paper are representative of image reconstruction procedures required for practical implementation of the new coded-excitation system. The optimization of these different procedures is currently under investigation.
V. Conclusions
A transversal filter bank design approach was introduced for establishing a newly presented filter-based parallel processing ultrasound imaging system with coded-excitations [5], [27], [28]. The design approach is based on a discretized linear model of the receive sample vector that results from the coherent sum of the echoes from all scatterers in the ROI. The filter coefficients are calculated from a regularized PI image reconstruction operator obtained from the model. The use of this operator leads to a set of filters capable of removing correlation artifacts existing in conventional coded-excitation systems implemented by matched filters. Our study shows that both system noise and modeling errors caused by the difference between the true system and the simulation system used for establishing the filter bank are kept well under control using regularization. With the proposed design approach, we can establish a filter-based high-speed system for phased array pulse-echo imaging of speckle-generating phantoms typically used in characterizing medical imaging systems. This may provide a more efficient solution to real-time 3-D pulse-echo imaging problems.
Finally, the phantom data that was available to us for writing this report was incomplete. In particular, we did not have an independent measurement of the array impulse response to characterize the accuracy of our simulation model. This prevented us from carrying out a quantitative investigation of some of the design tradeoff outlined in this paper. However, we emphasize the significance of the image reconstructions given and the effects of regularizing the PIO. This paper should be considered a road map of what can be achieved using this technique. Analytical as well as experimental investigation of the fundamental resolution limits of the new imaging operator will be reported in future reports. In [6], we have presented some analytical results with regards to the fundamental limits on spatial resolution. Efforts to extend these results to contrast resolution along with experimental validation are currently under way.
Acknowledgments
The authors would like to thank Prof. M. O’Donnell, O. S. Haddadin, C. Simon, and S. Lucas for the helpful discussions and comments. They would also like to thank Dr. M. Karaman for collecting the phantom data.
This work was supported by the National Science Foundation (NSF) under Grant ECS-9358301 and by the National Institutes of Health (NIH) under Grant HL57167.
Footnotes
Publisher Item Identifier S 0278-0062(98)09676-1.
Contributor Information
Jian Shen, Lucent Technologies, Inc., Whippany, NJ 07981 USA.
Emad S. Ebbini, Email: emad@ece.umn.edu, Department of Electrical and Computer Engineering, University of Minnesota, 4-174 EE/CSci Building, 200 Union Street S.E., Minneapolis, MN 55455 USA.
References
- 1.Andrews HC, Hunt BR. Digital Image Restoration. Englewood Cliffs, NJ: Prentice-Hall; 1977. [Google Scholar]
- 2.Cohn NA, Emelianov SY, Lubinski MA, O’Donnell M. An elasticity microscope—Part I: Methods. submitted for publication. [Google Scholar]
- 3.Delannoy B, Torguet R, Bruneel C, Bridoux E, Rouvaen JM, Lasota H. Acoustical image reconstruction in parallel-processing analog electronic systems. J Appl Phys. 1979 May;50(5):3153–3159. [Google Scholar]
- 4.Depretter F, editor. SVD and Signal Processing, Algorithms, Applications and Architectures. New York: North-Holland; 1988. [Google Scholar]
- 5.Ebbini ES. Optimal transversal filter bank for 3-D real-time acoustical imaging. Proc 26th Asilomar Conf Signals, Systems and Computers; 1992. pp. 831–835. [Google Scholar]
- 6.Ebbini ES, Shen J. Fundamental resolution limits of a coded-excitation system for real-time pulse-echo imaging. Proc 1997 Ultrasonics Symposium. 1997;2:1539–1542. [Google Scholar]
- 7.Edelstein WA, Bottomley PA, Hart HR, Smith LS. Signal, noise, and contrast in nuclear magnetic resonance (NMR) imaging. J Comput Assist Tomogr. 1983;7:391–401. doi: 10.1097/00004728-198306000-00001. [DOI] [PubMed] [Google Scholar]
- 8.Elliott DF, Rao KR. Fast Transforms: Algorithms, Analysis, Applications. New York: Academic; 1982. [Google Scholar]
- 9.Furgason ES. Optimal operation of ultrasonic imaging systems. Proc 1982 Ultrasonics Symp. 1982;2:919–928. [Google Scholar]
- 10.Golub GH, Van Loan CF. Matrix Computations. 2. Baltimore, MD: Johns Hopkins Univ. Press; 1989. [Google Scholar]
- 11.Goodman JW. Statistical properties of laser speckle patterns. In: Dainty JC, editor. Laser Speckle and Related Phenomena. New York: Springer-Verlag; 1984. [Google Scholar]
- 12.Harris FJ. On the use of windows for harmonic analysis with the discrete Fourier transform. Proc IEEE. 1978 Jan;66:51–84. [Google Scholar]
- 13.Hunt BR. A matrix theory proof of the discrete convolution theorem. IEEE Trans Audio Electroacoust. 1971 Dec;AU-19:285–288. [Google Scholar]
- 14.Jaffe JS, Cassereau PM. Multibeam imaging using spatially invariant insonification. J Acoust Soc Amer. 1988 Apr;83(4):1458–1464. [Google Scholar]
- 15.Karaman M, Li PC, O’Donnell M. Synthetic aperture imaging for small scale systems. IEEE Trans Ultrason, Ferroelec, Freq Contr. 1995 May;42:429–442. [Google Scholar]
- 16.Kreyszig E, editor. Advanced Engineering Mathematics. 6. New York: Wiley; 1988. [Google Scholar]
- 17.Luenberger DG. Optimization by Vector Space Methods. New York: John Wiley; 1969. [Google Scholar]
- 18.MacCan H, Sharp J, Kinter T, McEwan C, Barlillot C, Greenleaf J. Multidimensional ultrasonic imaging for cardiology. Proc IEEE. 1988 Sept;76:1063–1073. [Google Scholar]
- 19.Macovski A. Medical Imaging Systems. Englewood Cliffs, NJ: Prentice-Hall; 1983. [Google Scholar]
- 20.Nahamoo D, Kak AC. Ultrasonic echo imaging with pseudo-random and pulsed sources: A comparative study. Ultrason Imag. 1981;3:1–36. doi: 10.1177/016173468100300101. [DOI] [PubMed] [Google Scholar]
- 21.Newhouse VL, editor. Progress in Medical Imaging. New York: Springer-Verlag; 1988. [Google Scholar]
- 22.O’Donnell M. Efficient parallel receive beam forming for phased array imaging using phase rotation. Proc IEEE Ultrasonics Symp. 1990;3:1495–1498. [Google Scholar]
- 23.Pandian N, Reolant J, Nanda N, Sugens L, Cao Q, Azevedo J, Ludomirski A, Marx G, Vogel M. Dynamic three-dimensional echocardiography: Methods and clinical potential. Echocardiogr. 1994 May;11(3):237–259. doi: 10.1111/j.1540-8175.1994.tb01074.x. [DOI] [PubMed] [Google Scholar]
- 24.Reolant J, Salustri A, Mumm B, Vletter W. Precordial three-dimensional echocardiography with a rotational imaging probe. Echocardiogr. 1995 May;12(3):243–252. doi: 10.1111/j.1540-8175.1995.tb00545.x. [DOI] [PubMed] [Google Scholar]
- 25.Scharf LL. Statistical Signal Processing: Detection, Estimation, and Time Series Analysis. Reading, MA: Addison-Wesley; 1991. [Google Scholar]
- 26.Shattuck DP, Weinshenker MD, Smith SW, von Ramm OT. Explososcan: A parallel processing technique for high-speed ultrasound imaging with linear phased arrays. J Acoust Soc Amer. 1984 Apr;75(4):1273–1282. doi: 10.1121/1.390734. [DOI] [PubMed] [Google Scholar]
- 27.Shen J, Ebbini ES. A new coded excitation ultrasound imaging system—Part I: Basic principles. IEEE Trans Ultrson Ferroelec Freq Contr. 1982;UFFC-43:919–928. [Google Scholar]
- 28.Shen J, Ebbini ES. A new coded excitation ultrasound imaging system—Part II: Operator design. IEEE Trans Ultrson Ferroelec Freq Contr. 1996 Jan;43:141–148. [Google Scholar]
- 29.Shen J, Ebbini ES. On the design of a transversal filter bank for parallel processing multiple image lines in real-time acoustic imaging. Proc ICASSP. 1996;6:3109–3112. [Google Scholar]
- 30.Sklar B, editor. Digital Communications: Fundamentals and Applications. Englewood Cliffs, NJ: Prentice–Hall; 1988. [Google Scholar]
- 31.Smith SW, Pavy HE, Jr, von Ramm OT. High-speed ultrasound volumetric imaging system—Part I: Transducer design and beam steering. IEEE Trans Ultrson Ferroelec Freq Contr. 1991 Mar;38:100–108. doi: 10.1109/58.68466. [DOI] [PubMed] [Google Scholar]
- 32.Theilheimer F. A matrix version of the fast Fourier transform. IEEE Trans Audio Electroacoust. 1968 June;AU-17:158–161. [Google Scholar]
- 33.Turnbull DH, Foster FS. Beam steering with pulsed two-dimensional transducer arrays. IEEE Trans Ultrson Ferroelec Freq Contr. 1991 July;38:320–333. doi: 10.1109/58.84270. [DOI] [PubMed] [Google Scholar]
- 34.von Ramm OT, Castellucci J, Smith SW. Clinical real-time volumetric imaging. Proc. 21st Int. Symp. Ultrasonic Imaging and Tissue Characterization; 1996. [Google Scholar]
- 35.von Ramm OT, Smith SW, Pavy HE., Jr High-speed ultrasound volumetric imaging system—Part II: Parallel processing and image display. IEEE Trans Ultrson Ferroelec Freq Contr. 1991 Mar;38:109–115. doi: 10.1109/58.68467. [DOI] [PubMed] [Google Scholar]
- 36.Yarmilik VN, Demidenko SN. Generation and Application of Pseudorandom Sequences for Random Testing. New York: Wiley; 1988. [Google Scholar]


