Abstract
A computationally efficient hybrid ray–physical optics (HRPO) model is presented for the analysis and synthesis of multiple-focus ultrasound heating patterns through the human rib cage. In particular, a ray method is used to propagate the ultrasound fields from the source to the frontal plane of the rib cage. The physical-optics integration method is then employed to obtain the intensity pattern inside the rib cage. The solution of the matrix system is carried out by using the pseudo inverse technique to synthesize the desired heating pattern. The proposed technique guides the fields through the intercostal spacings between the solid ribs and, thus, minimal intensity levels are observed over the solid ribs. This simulation model allows for the design and optimization of large-aperture phased-array applicator systems for noninvasive ablative thermal surgery in the heart and liver through the rib cage.
Index Terms: Cancer treatment, phased-array focusing, ultrasonic hyperthermia
I. Introduction
High-intensity focused ultrasound (HIFU), in the frequency range of 500 kHz–10 MHz, has been used in a wide range of therapeutic applications. For example, HIFU has considerable potential for deep localized hyperthermia, primarily in conjunction with other cancer treatment modalities, e.g., radiation therapy. This is due to the fact that ultrasound can be easily focused (with mm-size heating spots at the focus) at considerable depths (1–15 cm with focusing) depending on the frequency. The (typically) small heating spot at the focus can be scanned mechanically or electronically to produce the desired heating pattern tailored to the tumor geometry. Clinical hyperthermia systems utilizing HIFU have been used by a number of groups and they continue to demonstrate the promise of this technology. HIFU has become even more attractive with recent advances in phased-array applicator technology, for example [1]–[6]. Phased arrays offer the promise of versatile applicator systems providing several advanced field control features, e.g., high-speed electronic scanning, tissue aberration correction, and applicator/patient motion compensation. Furthermore, optimal pattern synthesis methods have been developed for phased arrays, allowing adequate therapeutic heating of tumors while avoiding overheating of normal intervening tissue [7]–[10].
Recent advances in very large scale integration (VLSI) and transducer technologies have made it possible to build applicator systems containing hundreds of elements. The availability of such applicator systems will make it possible to target tissue organs previously considered unheatable by noninvasive therapeutic ultrasound with large-aperture arrays. Examples are the heart and liver which are (at least partially) shadowed by the rib cage. Applicator arrays with a large number of (relatively) small elements will allow the use of all available intercostal spacings between the ribs to maximize the array gain at the target while sparing the intervening tissue from being excessively heated. However, complex array structures make it absolutely essential to develop a computational model which allows for the optimization of a number of array parameters such as the distribution of active elements, size and curvature of array, operating frequency, and array excitation vector (amplitudes and phases of driving signals to active elements). In this paper, we present a hybrid ray–physical optics (HRPO) computational approach for the analysis and synthesis of multiple-focus phased-array heating patterns through a strong inhomogeneity such as the rib cage.
This paper is organized as follows. We begin by first introducing the analytical and computational formulation for the propagation mechanisms based on ray and physical optics (PO) theories. Subsequently, using the pseudo inverse technique [7], the array feeding pattern is obtained. Numerical examples validated with experimental data representing the actual problem are carried out and discussed at the end of the paper.
II. Computational Formulation
Despite the significant progress made in finite-element methods (FEM), method of moments (MoM), and finite difference time domain (FDTD) computational methods, the size of our problem is significantly larger than problems routinely handled by these methods, even on high-performance parallel computers. A two-dimensional (2-D) 100λ × 100λ region of interest (ROI) (typical for ultrasound) results in millions of grid points with any of these methods, which is considered very large in terms of memory requirements and in terms of the million floating operations per second (MFLOPS). Therefore, an alternative less exact, but computationally efficient, hybrid methodology must be considered for the simulation of our problem.
A. Problem Statement
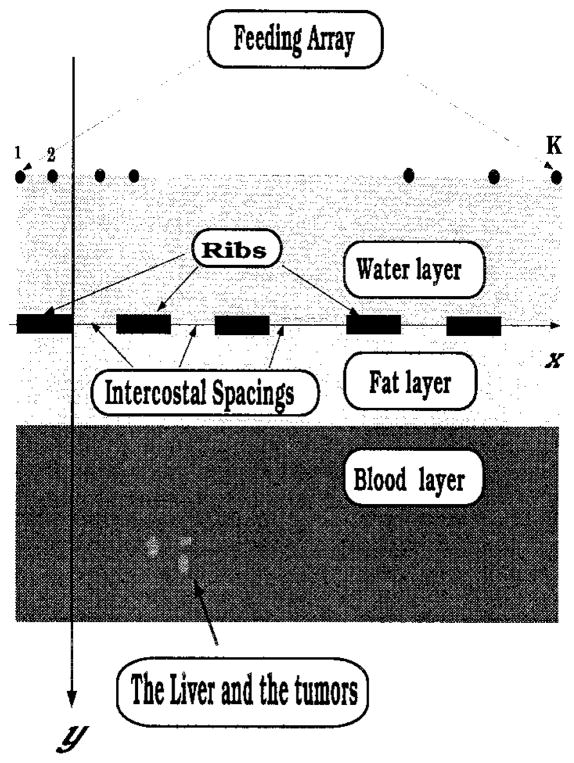
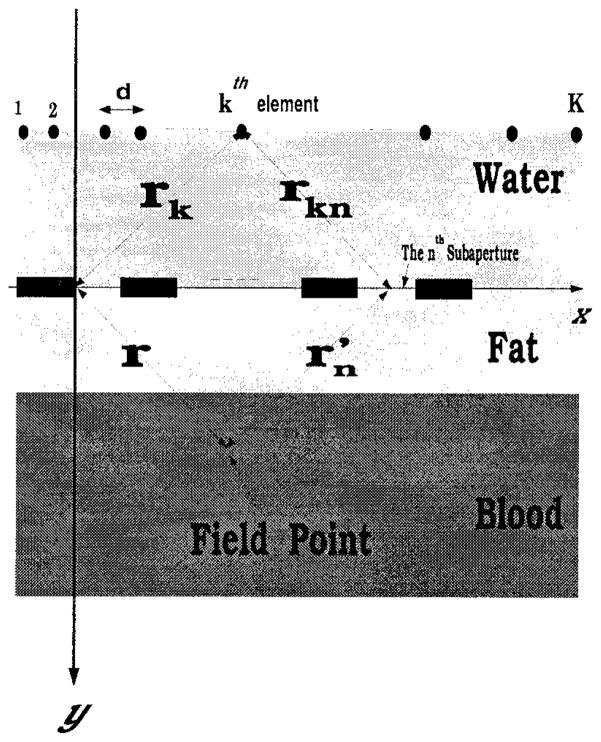
The problem of ultrasound field propagation through the intercostal spacings between the solid ribs and the surrounding tissue can be approximated by the 2-D model shown in Fig. 1. For simplicity, the rib cage is modeled as a planar strip-array located at the interface of the bolus and tissue (simulated as stratified medium). The feeding array is located on the surface of the bolus (water) and although shown planar in the figure, this is not required in the formulation. As shown in Fig. 2, the geometrical parameters of interest are:
Fig. 1.
Problem model. As shown, the ribs are positioned in the y = 0 plane along the x-axis with their lengths (depths) running parallel to the z-axis.
Fig. 2.
Problem geometry and dimensions.
| K | total number of the elements in the linear array (feeding array); |
| d | interelement separation between array elements; |
| vk | Amplitude (driving amplitude) of the kth element of the array; |
| θk | phase shift (driving phase) of the kth element of the array; |
| xk | x axis coordinate of the kth element of the feeding array; |
| yk | y axis coordinate of the kth element of the feeding array; |
| N | number of solid (hard) ribs, each of width l1; |
| L | separation (intercostal spacing) between ribs and it is often referred to as the aperture width. |
Additional parameters are required to define the stratified medium below the ribs (fat, blood, and liver tissues). However, the sound velocity and the density of these layers are very close to each other and we can, therefore, assume that the medium is completely homogeneous (except for the solid ribs). Nevertheless, this assumption is not necessary and does not represent a restriction on the employed analysis.
B. Analytical Solution and Formulation
The key steps of our approach are summarized as follows.
A ray method is used to calculate the fields over the subapertures (tissue between the ribs) with the feeding elements of the array being, for example, uniform line sources. The ribs are assumed as solid (hard) and are considered nonpenetrable.
The aperture fields represent the primary sources to the medium below the ribs. They are integrated over the subapertures using the PO technique which is sufficiently accurate for large apertures. The contributions of the subapertures are added to give the total field at any point in the medium below the ribs.
The above procedure will be referred to as a HRPO technique and is one of the most efficient approaches among the available computational methods (this will be discussed later).
The relation between the pressure and the relative velocity values is put in matrix form to employ the pseudo inverse approach discussed in [7] for pattern synthesis.
Let us now proceed with the derivation of the field values at any location below the ribs. On the assumption of time-harmonic fields with ejωt time dependence, the wave equation can be written as
| (1) |
where φ(r) is the velocity potential in (m2/s), and β = ω/c is the wave number where c is the speed of sound and ω is the radian frequency. This is the standard wave equation and its general solution is given by
| (2) |
where denotes the source amplitude distribution in (s−1) and is the half-space Green’s function in cylindrical coordinates with denoting the zeroth-order Hankel function of the second kind. As usual, gf represents the fields at a distance from a unity line source located at . Under the surface integral, is the total ultrasound field on the surface S′ which encloses the volume V′ and is the unit normal outwardly directed from S′. For sources in homogeneous media, S′ can be allowed to go to infinity and be eliminated from (2). Alternatively, the latter surface integral is used when the sources are not known explicitly and instead the field is given only over the surface S′ as will be seen later.
For a line source which vibrates uniformly in the radial direction with amplitude Uo (m/s) at a frequency ω (rad/s) [11], the radiated potential can be expressed as
| (3) |
where a is the radius of the vibrating cylinder, is the first-order Hankel function of the second kind, and we remark that contour integration was used to determine the reference velocity potential at the surface of the vibrating cylinder.
For our application, the primary line sources are placed several wavelengths away from the ribs and, thus, the large argument approximation of the Hankel function may be used to rewrite (3) as
| (4) |
where
| (5) |
and r is the distance between the source and a point on the subaperture surface. Thus, the field at some point (x′, 0) on the nth subaperture (see Fig. 2) due to the kth line source of the feeding array can be written as
| (6) |
in which rkn is the distance between the kth source and the general point (x′, 0) on the nth subaperture and vk and θk are the relative amplitude and phase of the kth source. To calculate the total field at the general point (x′, 0) due to all K elements of the array, we simply sum all array element contributions
| (7) |
Thus, the potential due to the nth subaperture at any point r below the solid ribs is obtained by using the aperture potential in (7) as the secondary source in (2) to give
| (8) |
where is the distance between the field point (x, y) and the integration point (x′, 0)on the nth subaperture as shown in Fig. 2. This expression is in the context of the PO approximation and by superposition, the total field due to all subapertures is given by (in terms of the array excitation vector)
| (9) |
Substituting (7) and (8) into (9), after rearrangement, φtotal(r) is given by
| (10) |
and for the planar array and rib cage
| (11) |
with
| (12) |
| (13) |
and
| (14) |
in which x and y are the coordinates of the field point.
C. Pseudo Inverse Solution
Our goal in using the pseudo inverse method is to determine the source amplitudes and phases (vk and θk) given a certain desired heating pattern. To do so, we need to express (10) in matrix form and to accomplish this, we rewrite φtotal(r) as
| (15) |
where
| (16) |
In this form, htot (k, r) can be identified as the contribution of all subapertures at the field point due to the kth line source. Equations (15) and (16) can be tested at M points to obtain the matrix system
| (17) |
where u is the complex excitation vector of length K with its kth element equal to vkejθk and H is the total matrix response (of size M × K) where its elements are given by (16). Also, φC,total is a vector of length M and each of its elements represents the velocity potential at the control (field) points rm, m = 1, 2, ···, M.
Clearly, (17) represents an underdetermined system to be solved for the desired response u and where H is the system transfer matrix. Following the procedure in [7] and [8], (17) can be solved to obtain
| (18) |
where Hpi is the pseudo inverse of H. The pseudo inverse operator can be evaluated by a singular-value decomposition of the matrix H [13]. Also, in most cases of practical interest, it is desired to evaluate u based on a minimum number of control points, e.g., the tumor location(s) and, possibly, any points where the field values are required to be kept at low levels.
For the undetermined problem where H is full rank, the pseudo inverse of the matrix H is given by
| (19) |
where the superscripts t and * denote the matrix transpose and conjugation, respectively. We remark that the pseudo inverse technique chooses the minimum norm solution given by (18); see [7] for more details about the minimum norm solution and its advantages over others.
After the complex excitation vector is determined as in (18) and (19), we calculate the array excitation efficiency which is a measure of the amplitude (velocity) distribution uniformity over the feeding array. For a phased array consisting of K elements driven independently by time-harmonic signals, the array efficiency ηA is given by
| (20) |
where Umax is the maximum-amplitude particle velocity at the surface of the array and 〈, 〉 defines the inner product of the complex column vectors. From (20), we note that the array efficiency is higher when the amplitude distribution is more uniform and this is an issue of increasing importance when dealing with limited power handling capability.
III. Synthesis Algorithm
The array design (synthesis) algorithm can be summarized as follows.
First, define the field control points (M points) and the corresponding intensity levels at these points (heating levels). The perspective field points are usually the tumor location and the points at which minimum power deposition must be kept as low as possible.
For each point, evaluate the response vector using (11)–(18) to construct the system response matrix with size M × K.
Using the pseudo inverse technique and following the procedure discussed in [7] and [8], we proceed with the evaluation of the complex excitation vector u.
Next, the region below the ribs is scanned to obtain a field map and ensure that the desired levels are satisfied at the specified control points.
The final step is the evaluation of the heating levels over the solid ribs to ensure that the design has maintained relatively low levels over the surface of the solid ribs. Otherwise, we return to Step 1 and redefine the M control points to include the overheated rib locations.
In our simulation, we employed a typical realistic biological lossy medium associated with a sound speed of 1500 m/s and a density of 1000 kg/m3. The operating frequency was set to 500 kHz (3-mm wavelength) unless otherwise noted. The calculation of the fields just on the rib surfaces was performed based on the following assumptions.
The ribs are of infinite extent (2-D).
The incident waves at the rib locations are locally planar.
The specific acoustic impedance of the hard ribs is much larger than that of water, thus, unity reflection coefficient can be assumed. This can be considered as a worst-case scenario.
Based on these assumptions, the total surface velocity potential at the general point xr along the rib-tissue plane is given by
| (21) |
where is the distance between the test point (xr, 0) on the rib-tissue plane and the kth element of the array. It is given by
| (22) |
The corresponding expression in matrix form is
| (23) |
where hrib is a vector of length K and each of its matrix entries is given by
| (24) |
Each of these entries represents the effect of the kth element of the array on the point (xr, 0) along the rib-tissue plane. Using (22) to (24), we can now proceed to obtain the heating pattern over the ribs and examine whether they exceed the prescribed threshold levels.
IV. Validation
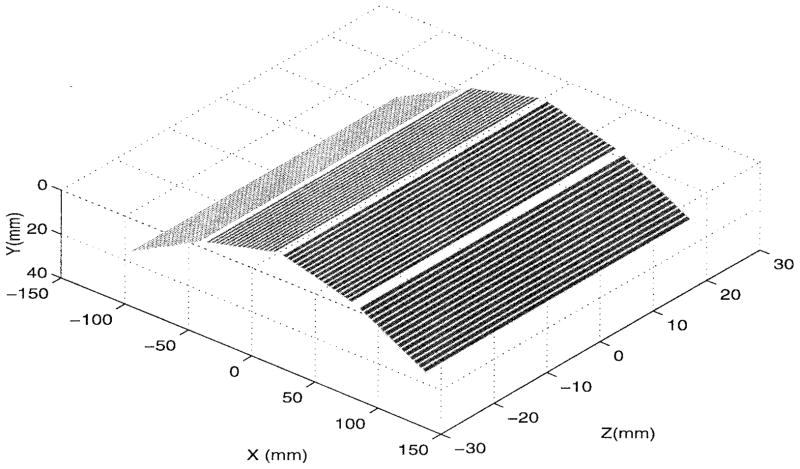
Before employing the aforementioned formulation to the problem at hand, we first perform a validation using experimental data. The experimental setup consisted of a 64-element curved panel as shown in Fig. 3. Four flat subpanels, each having 16 elements were used to construct the array. The element width was 3 mm and the elements were separated by 3.5 mm within each panel. Also, the panel width was 61.5 mm and the interangles between the adjacent subpanels were 162.5° and 145° for the middle and end subpanels, respectively. The panel depth was about 60 mm which is large enough for the 2-D approximation considered here.
Fig. 3.
Three-dimensional (3-D) geometry of the array used in the experiment. The wooden bars simulating the ribs are positioned in the y = 0 plane along the x-axis with their lengths (depths) run parallel to the z-axis.
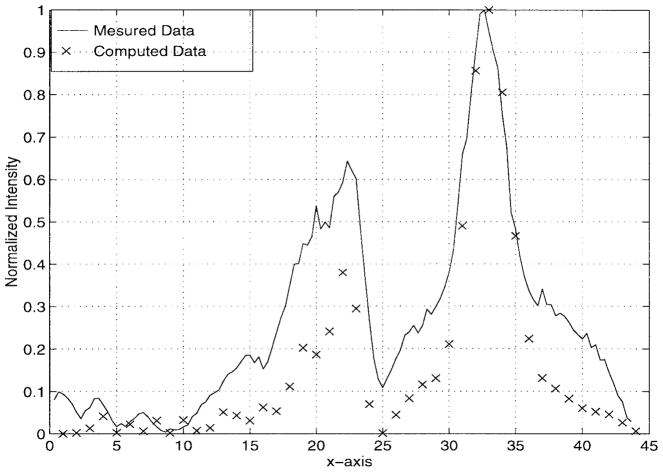
The above setup was used to focus through a strip array represented by six wooden bars, each 18-mm wide and separated by 19 mm from the adjacent strip edges. The excitation frequency was 485 kHz and the feeding array was adjusted to focus at a specified location. The experimental and computational results are given in Fig. 4. Clearly, a very good agreement exists between the calculated and measured heating patterns, especially in the ROI which includes the focus location. This focal plane cut is used for validating our proposed formulation. As observed in this figure, the main lobe measured and computed levels are almost identical and the desired focus is accurately achieved (in both magnitude and location) for both cases. On the other hand, away from the main lobe, we observe that the measured data deviates from the calculated due to several reasons. Among them, is the uncertainty in the rib locations and dimensions of the experimental model (our resolution was on the order of 1 mm which equals one-third of a wavelength). Also, multiple reflections from the boundaries of the water tank caused a standing wave which affected the region outside the main lobe of the focal plane pattern.
Fig. 4.
Comparison between measured and computed data. The x-axis values are given in wavelengths.
V. Numerical Simulation for Single- and Multiple-Focus Patterns
Having validated our modeling approach, we next present some numerical simulations and associated results. As mentioned before, the medium (except for the ribs) is considered homogeneous and for the examples given here, the following geometrical parameters were selected
Two-hundred-forty planar, uniformly spaced excitation elements were used with inter-element separation equal to a half wavelength.
Distance from the array plane to the rib plane = 17λ.
Number of ribs = 6.
Rib width = 6λ.
Aperture (tissue between ribs) width = 7λ.
It is worth mentioning that the above parameters resemble actual data for an average person.
To test our suggested approach, we start by synthesizing a single-focus pattern with the focus location at (40λ, 50λ). Typically, for therapeutic phased-array focusing, the ratio between the focal spot distance from the array surface and the maximum aperture width (f-number) should be kept around unity. This restriction controls the choice of the phased-array distance from the rib plane and more details about the spot size and the 6-db beamwidth are given in [10]. In any case, our design goal is to compute the excitation vector u by applying these values to the design algorithm. The field maps inside the rib cage and over the rib-tissue plane can then be obtained using (17) and (23), respectively. It is noted that for this example, the matrix H was well conditioned. Also, in calculating the integral in equations (11), fourth-order Gaussian integration was used. Because of the highly oscillating integrand, the main integral was subdivided till convergence was achieved.
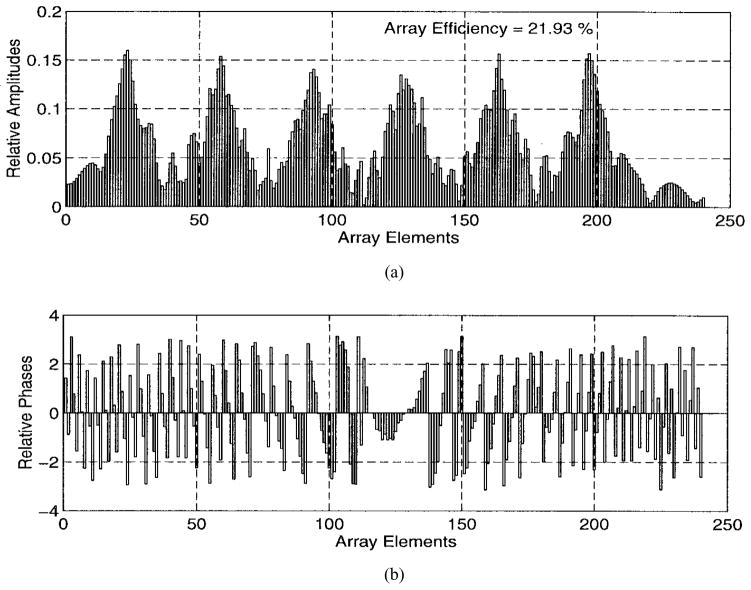
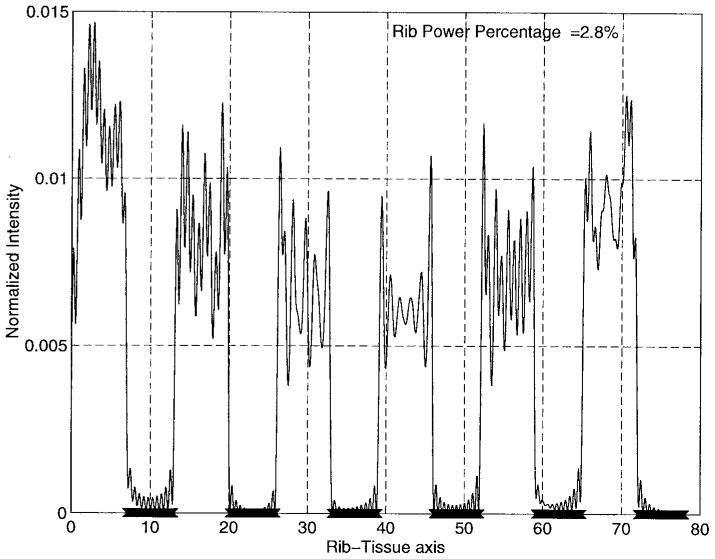
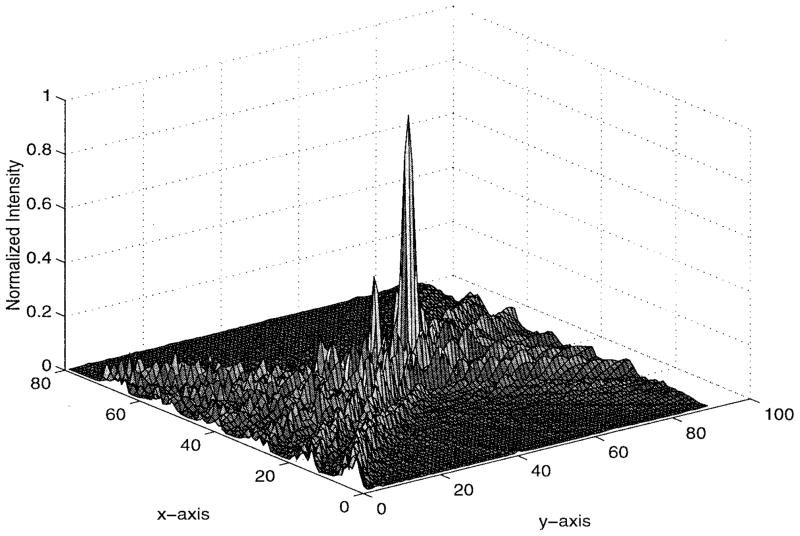
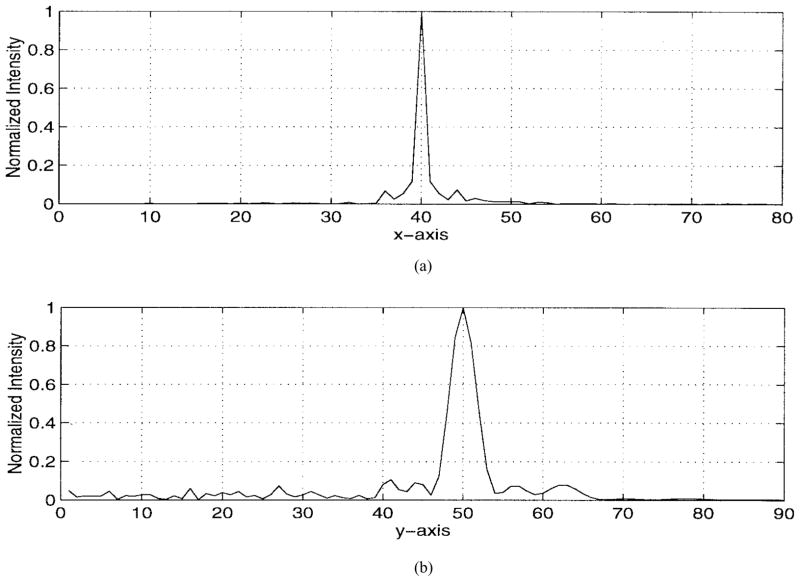
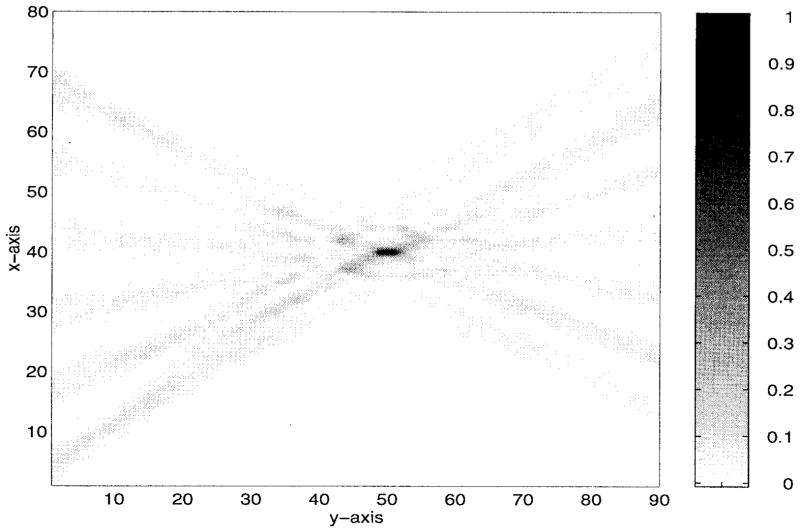
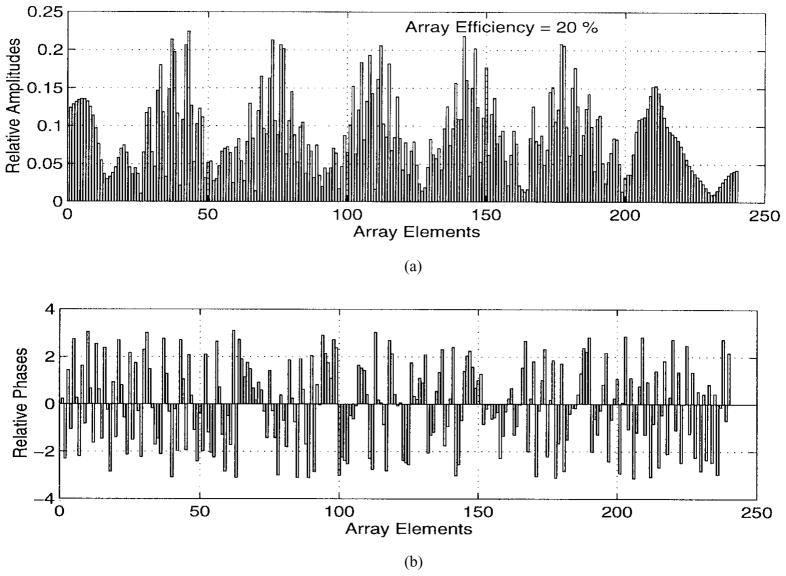
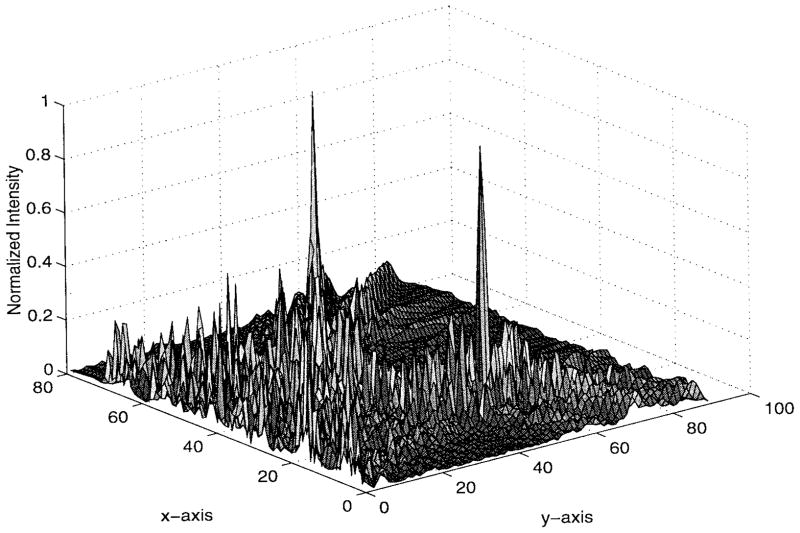
The numerical results are illustrated in Figs. 5–9. Specifically, Fig. 5 shows the relative amplitudes and phases of the feeding array as computed by the pseudo inverse method. The relative particle-velocity distribution indicates the high performance of the employed pseudo inverse technique because the array elements which have insignificant effect on the control points have very small amplitudes. Thus, an excessive amount of heating in the undesired tissues is avoided. Different field maps for the synthesized single-focus pattern are shown in Figs. 6–8. These maps were constructed using one wavelength scanning step in both x and y directions. As shown in Fig. 6, ultrasound energy is almost concentrated at the focus location while minimum interference pattern is observed elsewhere. Fig. 7 displays a 2-D grayscale map for the field intensity pattern inside the rib cage. It shows how ultrasound energy passes through the intercostal spacings (subapertures between the solid ribs) and then converges towards the focus locations. As observed in the two focal plane cuts shown in Fig. 8, the intensity level at the focus location is accurately achieved as specified. This is because the pseudo inverse algorithm gives the exact field values at the control point locations(s) and minimizing power deposition elsewhere.
Fig. 5.
Amplitudes and phases of the feeding array shown in Fig. 2 when used to generate a single focus pattern.
Fig. 9.
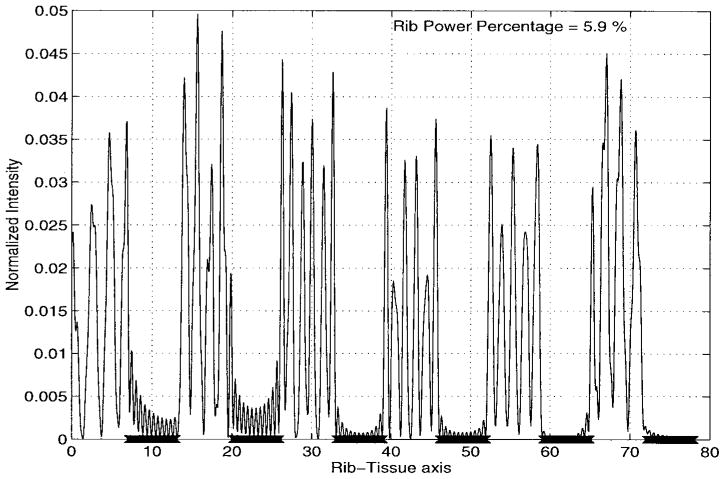
Intensity pattern over the rib-tissue plane for the single-focus case.
Fig. 6.
Three-dimensional intensity pattern for the single-focus case. The simulated ribs are centered at y = 0 and x = 10λ, 23λ, 36λ, 49λ, 62λ, and 75λ.
Fig. 8.
Two cuts at the focal plane to demonstrate in the planes (a) y = 50λ and (b) x = 40λ.
Fig. 7.
Gray scale pattern of the single focus case shown in Fig. 6. The simulated ribs are centered at y = 0 and x = 10λ, 23λ, 36λ, 49λ, 62λ, and 75λ.
Finally, Fig. 9 shows the normalized fields (with respect to the maximum level at the focus locations) over the rib plane. It is indeed pleasing to observe that the intensity levels over the ribs and the intercostal spacings are vanishingly small compared with that at the focus. From this figure, we can easily see that the maximum value for the normalized intensity over the rib-tissue plane is less than .015 which implies that the synthesis algorithm used in the analysis of this model attempts to pass most of the ultrasound energy through the intercostal spacings between the solid ribs. Moreover, rib power ratio, which is the total power over the solid ribs relative to that on the rib-tissue plane, is negligible (less than 3% in this case). As a result, our design eliminates concerns relating to the pain level on the rib/bone surfaces.
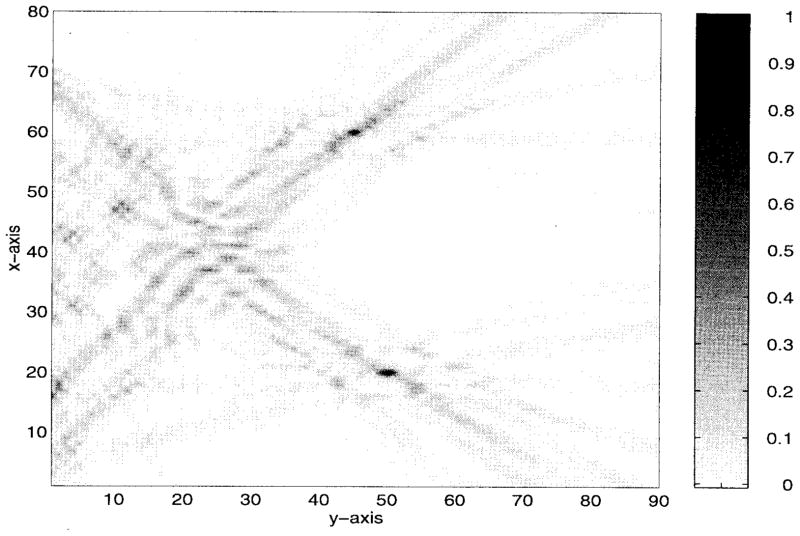
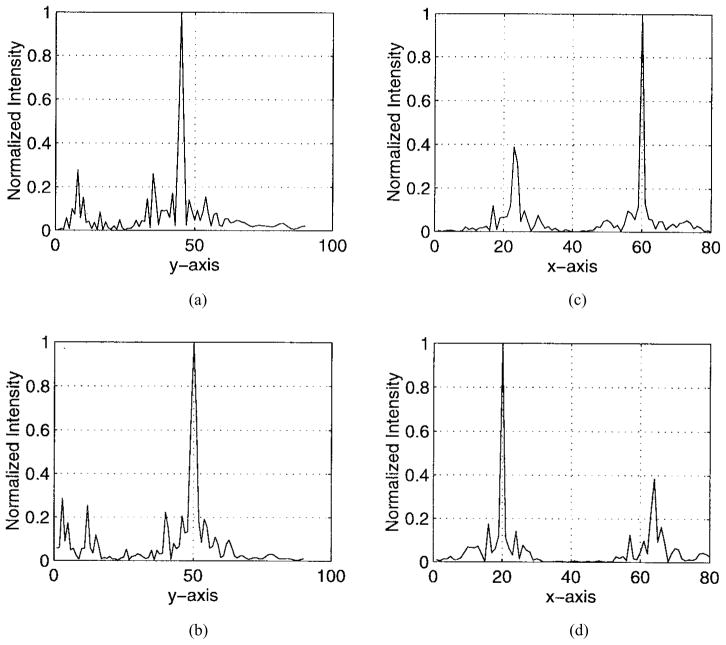
Also, our proposed algorithm is capable of synthesizing multiple-focus patterns in a efficient way. To demonstrate this issue, we simultaneously focused at two different locations inside the rib cage. These locations are given by the coordinates (20λ, 50λ) and (60λ, 45λ). As displayed in Figs. 10–14, the intensity levels at the foci locations are obtained precisely with minimal intensity over the solid ribs. Also, there is a higher interference pattern observed in the near bone region. This is because the PO technique fails to predict the near zone field of a source or radiator. In other words, more accurate modeling is needed to predict the near bone levels.
Fig. 10.
Amplitudes and phases of the feeding array shown in Fig. 2 when used to generate a two-foci pattern.
Fig. 14.
Intensity pattern over the rib-tissue plane for the two-foci case.
VI. Discussion and Conclusions
In this paper, a new approach for analysis and synthesis of phased-array multiple-focus field patterns in the presence of strong scatterers was presented. This hybrid approach ignores certain diffraction terms from the rib edges and is, therefore, expected to be less accurate than a solution based on a full-wave numerical implementation. However, for the problem at hand, this loss of accuracy is not expected to have significant effects on the validity of the results obtained here, due to the fact that the neglected contributions provide correction terms that primarily improve the solution in the shadow region near an obstacle or an edge. At distances several wavelengths away from the obstacle, the ray theory gives an acceptable solution and, therefore, the hybrid method is sufficiently accurate at foci located far away from the ribs. Furthermore, use of the Rayleigh–Sommerfeld diffraction integral eliminates any difficulties relating to the prediction of fields near caustics. It is, therefore, possible to state that the theoretical foundation of the hybrid approach presented in this paper is sound. In addition, while the numerical accuracy of this approach is poor in the shadow regions of edges, this loss in accuracy does not significantly affect the field intensity values in the tissue region beneath the ribs.
Experimental results shown in this paper validate the proposed hybrid approach. From Fig. 4, we observe that the essential features of the field pattern are correctly predicted by the hybrid simulation model. In particular, the location of the focal point as well as the locations and relative intensities of the major interference patterns in the ROI are recovered with excellent precision even with the uncertainty in alignment and dimensions.
A fully developed diffraction analysis model with uniform theories [14] or a full-wave numerical model will provide a better simulation of the intensity patterns in the presence of highly scattering obstacles. However, even with a more accurate model, uncertainties in the obstacles locations with respect to the feeding array are likely to give phase errors which may offset any gains in accuracy. A pulse-echo ultrasonic system for location of obstacles is being designed to enhance the alignment of the experimental system described in this paper. The new system will allow for full characterization of the obstacles, both location and shape. With this information and an improved numerical model, one will be able to more accurately estimate the field intensity levels in the vicinity of the obstacle as well the ROI at and near the focus. This will be essential in predicting any unintended high-intensity heating regions over and around the ribs; an important issue since bone heating is a major treatment-limiting factor when ultrasound is used.
Despite the experimental limitations given, the results presented in this paper support the use of the hybrid model in predicting the quality of phased-array field patterns in the presence of strong obstacles. That is, the hybrid model offers a computationally efficient tool for analysis and synthesis of phased-array heating patterns for localized treatment of deep targets shadowed by strongly scattering obstacles. As such, and because of its low computational requirements, this approach can be a valuable tool for treatment planning. This is quite significant given the large size (in wavelengths) of the ROI.
Both simulation and experimental data shown in this paper, clearly, demonstrate that focused phased-array field patterns can be generated in the presence of strongly scattering obstacles. Thus, we can conclude that phased-array systems are capable of utilizing all acoustical windows (including intercostal spacing between the ribs) to focus on targets partially covered by these obstacles. This is a unique feature to phased-array applicator systems which cannot be achieved by other focusing systems. That is, phased arrays continue to offer the promise of noninvasive treatment of tumors and other target tissues previously considered inaccessible to other focusing systems, e.g., lens-focused and shell transducers. The results shown here and experimentally obtained elsewhere [15] demonstrate the potential for large-aperture ultrasound arrays for tissue targets in the liver and the heart. It is interesting to note that Fig. 5 indicates that the synthesis procedure utilizes the full aperture of the array, including elements that do not have a direct path to the focus, since they are shadowed by the scattering obstacles. In contrast, previously proposed methods relying strictly on ray tracing (see [15] for an example) utilize only a fraction of the array aperture. This could severely limit the array gain and, consequently, limit our ability to generate useful heating patterns.
Finally, no attempt was made to optimize or improve the synthesized field patterns beyond the pseudo inverse pattern synthesis method. This topic is beyond the scope of this paper. However, the presence of strongly scattering obstacles calls for a modification of the basic synthesis algorithm described in [16] for homogeneous and weakly scattering inhomogeneous media. A two-step synthesis procedure has been formulated and is currently being tested for this purpose with encouraging initial results. For example, in the simulation model described in Fig. 1, the first step consists of a synthesis procedure performed in the half-space beneath the ribs from the desired focal points to a set of fictitious line sources separated by λ/2 in the intercostal spacings between the ribs. These fictitious sources constitute a virtual array covering the available acoustical windows into the target region. If the first step does not yield a useful pattern, then no array configuration can be designed to achieve the treatment objective. In other words, this step determines if the available acoustical window puts a fundamental limit on one’s ability to focus in the presence of a given obstacle. The second step is another synthesis problem with the fictitious sources within the intercostal spaces, defined as control points, and the real array elements, defined as sources. Preliminary simulation results show that the new two-step procedure offers significant improvement over the direct (one-step) synthesis approach. A complete description of the two-step synthesis procedure along with representative simulation results is the subject of a second report that is currently in preparation.
Fig. 11.
Three-dimensional intensity pattern for the two-foci case. The simulated ribs are centered at y = 0 and x = 10λ, 23λ, 36λ, 49λ, 62λ, and 75λ.
Fig. 12.
Grayscale pattern of the two-foci case shown in Fig. 11. The simulated ribs are centered at y = 0 and x = 10λ, 23λ, 36λ, 49λ, 62λ, and 75λ.
Fig. 13.
Four cuts at the focal planes (a) x = 60λ, (b) x = 20λ,(c) y = 45λ, and (d) y = 50λ.
Acknowledgments
This work was supported in part under a grant from the Office of Vice President for Research at the University of Michigan and in part by the National Institutes of Health under Grants CA44124 and CA66602.
Biographies
Youssry Y. Botros (S’97) was born in Alexandria, Egypt, on May 1, 1968. He graduated from the Electrical Engineering Department, Alexandria University, at the top of his class as well as the whole Engineering School in June 1990. From 1990–1994, he worked as a Teaching and Research Assistant with the electrical engineering department, Alexandria University where he pursued his master degree in the area of “Inverse Scattering of Waves From Inhomogeneous Media.” Since January 1995, he has been studying for the Ph.D. degree in the Electrical Engineering and Computer Science (EECS) Department of the University of Michigan at Ann Arbor. During this period, he has also held a teaching and research assistant positions in the department.
His research interests are in noninvasive surgery using ultrasonic phased arrays and the applications of the finite element method for microwave circuits and filters. He has published more than 17 articles in journals and conferences.
John L. Volakis (S’77–A’79–M’82–SM’88–F’96) was born on May 13, 1956 in Chios, Greece. He received the B.E. degree, summa cum laude, from Youngstown State University, Youngstown, OH, in 1978 and the M.Sc. and Ph.D. degrees in 1979 from the Ohio State University, Columbus in 1979 and 1982, respectively.
He has been with the University of Michigan, Ann Arbor, since 1984 where he is now a Professor in the Department of Electrical Engineering and Computer Science (EECS). From 1982–1984 he was with Rockwell International, Aircraft Division, Lakewood, CA, and during 1978–1982 he was a Graduate Research Associate at the Ohio State University ElectroScience Laboratory. His current research activity deals with the development and application of analytical and numerical techniques to large-scale scattering, printed antennas, microwave-guided structures, bioelectromagnetics, and bioacoustics. His work has emphasized both numerical and diffraction methods and he has published over 120 refereed journal articles. He has also written ten book chapters on analytical and numerical methods, and co-authored the book Approximate Boundary Conditions in Electromagnetics (London, U.K.: IEE Press, 1995).
Philip VanBaren (S’94–M’95) was born in Grand Rapids, MI, on July 19, 1968. He received the B.S. degree in engineering from Calvin College, Grand Rapids, MI, in 1990 and the M.S. degree in electrical engineering from the University of Michigan, Ann Arbor, in 1991. He is currently working toward the Ph.D. degree in electrical engineering at the University of Michigan.
His research interests are in biomedical ultrasound, signal processing, and control systems.
Emad S. Ebbini (S’84–M’85) was born in Karak, Jordan, in December 1961. He received the B.Sc. degree in electrical engineering/communications from the University of Jordan, Amman, Jordan in 1985. He received the M.S. and Ph.D. degrees in electrical engineering from the University of Illinois, Urbana–Champaign, in 1987 and 1990, respectively.
From 1985–1986, he was a Graduate Assistant with the Electrical Engineering Department at the Yarmouk University (currently the Jordan University for Science and Technology), Irbid, Jordan. From 1986–1989, he was a Graduate Research Assistant in the ECE Department at the University of Illinois. Since 1990, he has been with the EECS Department at the University of Michigan, Ann Arbor.
In 1993, Dr. Ebbini received the NSF Young Investigator Award for his work on ultrasound phased arrays for imaging and therapy. His current research interests are in real-time 3-D imaging, inverse scattering, image reconstruction, focusing through inhomogeneities, therapeutic ultrasound, and ultrasound signal processing.
References
- 1.Lele P. Effect of U-sound on solid mammalian tissues and tumors in vivo. In: Rapacholi M, Grandolfo M, Rindi A, editors. U-sound. New York: Plenum, Corp; 1987. [Google Scholar]
- 2.Sanghvi NT, Fry FJ, Foster R, Chua R, Chua G. System design considerations for high-intensity focused ultrasound device for the treatment of tissue in-vivo. Med Biol Eng, Comput. 1991;29(supp):748. [Google Scholar]
- 3.Driller J, Lizzi FL. Therapeutic applications of ultrasound: A review. IEEE EMB Mag. 1987;6(4):33–40. doi: 10.1109/MEMB.1987.5006466. [DOI] [PubMed] [Google Scholar]
- 4.Cline H, Hynynen K, Watkins R, Souza S, Jolesz F. MRI-guided focused ultrasound surgery. J Comput Assist Tomogr. 1992;16(6) doi: 10.1097/00004728-199211000-00024. [DOI] [PubMed] [Google Scholar]
- 5.Seip R, Ebbini ES, Mo JH, Robinson AL. Characterization of a needle hydrophone array for acoustic feedback during ultrasound hyperthermia treatments. Proc Ultrasonics Symp. 1992;2:1265–1269. [Google Scholar]
- 6.Wang H, Ebbini ES, Cain CA. Computationally efficient algorithms for control of ultrasound phased-array hyperthermia applicators based on a pseudo inverse method. IEEETrans Ultrason, Ferroelect, Freq Contr. 1990;37:274–277. doi: 10.1109/58.55318. [DOI] [PubMed] [Google Scholar]
- 7.Ebbini ES. PhD dissertation. Univ. Illinois; Urbana-Champaign, IL: 1990. Deep localized hyperthermia with ultrasound phased arrays using the pseudo inverse pattern synthesis method. [Google Scholar]
- 8.Ebbini ES, Cain CA. Multiple-focus ultrasound phased-array pattern synthesis: Optimal driving-signal distributions for hyperthermia. IEEE Trans Ultrason, Ferroelect, Freq Contr. 1989;36:540–548. doi: 10.1109/58.31798. [DOI] [PubMed] [Google Scholar]
- 9.Cory P, Jabboury K, Armour E, Kong J. Human cancer treatment with ultrasound. IEEE Trans Sonics Ultrason. 1984;SU-31(5):444–456. [Google Scholar]
- 10.Ocheltree K. MS thesis. Univ. Illinois; Urbana-Champaign, IL: 1984. Theoretical analysis of ultrasonic linear phased array for hyperthermia treatment. [Google Scholar]
- 11.Ziomek L. Acoustical Field Theory and Space-Time Signal Processing. Boca Raton, FL: CRC; 1995. [Google Scholar]
- 12.Senior TBA, Volakis JL. Approximate Boundary Conditions in Electromagnetics. London, U.K: Inst. Elect. Eng (IEE); 1995. [Google Scholar]
- 13.Leon S. Linear Algebra with Applications. 2. New York: Macmillan; 1980. [Google Scholar]
- 14.McNamara DA, Pistorius CWI, Malherbe JAG. The Uniform Geometrical Theory of Diffraction. Boston, MA: Artech House; 1990. [Google Scholar]
- 15.Kluiwstra JU, Zhang Y, VanBaren P, Strickbereger SA, Ebbini ES, Cain CA. Ultrasound phased array for noninvasive myocardial ablation: Initial studies. Proc IEEE 1995 Ultrasonics Symp. 2:1605–1608. [Google Scholar]
- 16.Wang H, Ebbini ES, O’Donnell M, Cain C. Phase aberration correction and motion compensation for ultrasonic hyperthermia phased arrays: Experimental results. IEEE Trans Ultrason, Ferroelect, Freq Contr. 1994;41(1):34–43. [Google Scholar]
- 17.Botros YY, Volakis JL, Ebbini ES. Analysis and synthesis of multiple-focus phased array heating patterns through the rib cage: A simulation model. presented at the 13th National Radio Science Conf; Mar. 19–21, 1996; Cairo, Egypt. invited paper. [Google Scholar]
- 18.Botros YY, Volakis JL, Ebbini ES, VanBaren PD. Deep localized hyperthermia through the rib cage using ultrasound heating patterns. presented at the Joint 3rd Meeting between the Acoustical Society of America and the Acoustical Society of Japan; Honolulu, HI. Dec. 2–6, 1996. [Google Scholar]
- 19.Botros YY, Ebbini ES, Volakis JL. Phased-array pattern synthesis for hyperthermia treatment of liver cancers. presented at 45th Annu. Meeting of the Radiation Research Society; Providence, RI. May 1997. [Google Scholar]


