Abstract
Near-infrared (NIR) approaches is considered one of the most well-studied process analyzers evolving from the process analytical technology initiatives. The objective of this study was to evaluate NIR spectroscopy and imaging to assess individual components within a novel tenofovir liposomal formulation. By varying stearylamine, as a positive charge imparting agent, five batches were prepared by the thin film method. Each formulation was characterized in terms of drug entrapment efficiency, release characteristics, particle sizing, and zeta potential. Drug excipients compatibility was tested using Fourier transform infrared spectroscopy, differential scanning calorimetry, and X-ray diffraction. The obtained results showed an increase in drug entrapment and a slower drug release by increasing the incorporated percentage of stearylamine. The compatibility testing revealed a significant interaction between the drug and some of the investigated excipients. The developed NIR calibration model was able to assess drug, phospholipid, and stearylamine levels along the batches. The calibration and prediction plots were linear with correlation coefficients of more than 0.9. The root square standard errors of calibration and prediction did not attain 5% of the measured values confirming the accuracy of the model. In contrast, NIR spectral imaging was capable of clearly distinguishing the different batches, both qualitatively and quantitatively. A linear relationship was obtained correlating the actual drug entrapped and the predicted values obtained from the partial least squares images.
Key words: characterization, chemical imaging, liposomes, near infrared, tenofovir
INTRODUCTION
Tenofovir is an acyclic nucleotide analog with potent in vitro and in vivo antiretroviral activity and as such can be considered a unique type of nucleoside reverse transcriptase inhibitors (1–4). Several clinical studies with the prodrug of tenofovir, tenofovir disoproxil fumarate, have demonstrated that it requires intracellular activation through phosphorylation, which is not required for tenofovir because it is already monophosphorylated (5–7). No research dealing with the relatively low bioavailability of the parent drug (25–30%) has been reported up to date (8). Liposomal drug delivery is one of the most important approaches to improve the cellular uptake and subsequent bioavailability of drugs. Following its administration, liposomes are recognized and taken up by cells of the mononuclear phagocytic system. Since the HIV virus localizes in these cells, liposomes therefore represent a suitable drug delivery system for targeting antiretroviral agents into infected cells, and thus have the potential of improving the efficacy of drugs and reducing side effects (9–12).
Near-infrared spectroscopy (NIRS) is considered as a quantitative, fast, and nondestructive method used for routine identification and quality testing of incoming raw materials (13) and content determination of active compounds in pharmaceutical preparations (14). In this context, NIRS is described as a process analytical tool, perfectly integrated into the notion of process analytical technology (15,16), a concept oriented toward industrial production for designing, analyzing, and controlling manufacturing through timely measurement of critical quality steps with the goal of ensuring final product quality (17). NIRS has already proved its efficiency in the understanding of a manufacturing problem (18), in improving the control laboratory quality, and in allowing nondestructive dissolution analysis during formulation (19), or hardness testing of solid formulations. Focal plane array (FPA) detectors that can acquire multiple spatially located NIR spectra simultaneously have recently been developed to visualize compound distribution. They are combined with tunable filters for wavelength selection and microscopes with different objectives for varying spatial resolution and scanning area. The combination of spectroscopy for compound characterization and imaging for spatial localization in NIR chemical imaging (NIR-CI) has had pharmaceutical applications such as mapping compound distribution to test for homogeneity or to detect counterfeits (20). In order to extend these concepts to novel tenofovir liposomal systems, the aim of this study was to broaden the understanding of tenofovir liposomes characteristics by applying the NIRS techniques in its evaluation.
MATERIALS AND METHODS
Materials
Hydrogenated phosphatidylcholine (batch no. SA368111, 95% hydrogenated phosphatidylcholine, 0.5% hydrogenated lysophophatidylcholine) was supplied from American Lecithin (Oxford, CT, USA). Tenofovir (batch no. 080401) was purchased from Hangzhou Starshine Pharmaceutical Company (Hangzhou, China). Cholesterol (batch no. JTF676-7), stearylamine (batch no. 200058-156), and HPLC grade phosphoric acid (batch no. EM-PX0996-6) were purchased from VWR Scientific (Bridgeport, NJ, USA). Sodium phosphate dibasic (batch no. S7907) was purchased from Sigma Aldrich (St. Louis, MO, USA). Phosphate buffer solution pH 6.8 (batch no. BP-399-1), sodium chloride (batch no. S271-1), sucrose (batch no. S5-500), sodium phosphate, chloroform (batch no. C607-4), and HPLC grade acetonitrile were purchased from Fisher Scientific (Pittsburgh, PA, USA).
Liposome Preparation
Tenofovir incorporating multilamellar liposomes were prepared by the thin film method as described by Saarinen-Savolainen et al. (21). Five liposomal formulations were prepared using 50 mg cholesterol and 100 mg of variable amounts of phospholipon 100H and stearylamine as a positive charge imparting agent (Table I). In a round-bottomed flask, cholesterol and the specified amounts of phospholipon and stearylamine were dissolved in 10 mL of chloroform. The organic solvent was removed under reduced pressure using rotary evaporator (Rotavapor® R-210/215, BÜCHI Labortechnik AG, Postfach, Switzerland), at the temperature above the transition temperature (Tc) of the lipids used (63°C), to deposit a thin film of dry lipid on the walls of the flask. Evaporation was continued for 15 min after the dry residue appeared. The film was then purged with nitrogen for 5 min followed by overnight vacuum drying at room temperature for complete solvent evaporation. To each flask, 5 mL of isotonic tenofovir solution (5 mg/mL) containing 300 mg sucrose as a cryoprotectant and four glass beads was then added (22). The flask was attached to a rotary evaporator and shaken at 63°C for 30 min. Excess unencapsulated drug was separated from the liposomes by ultracentrifugation (Eppendorf Centrifuge, Model 5415 C, Eppendorf-Netheler-Hinz GmbH 2000, Hamburg, Germany) at 65,000 rpm for 2 h. The resulting supernatant was used for indirect estimation of the entrapment efficiency using a validated in-house developed analytical method for tenofovir. The resultant residue was reconstituted with 2 mL of distilled water followed by freeze drying using Freeze-Dry/Shell Freeze System (Labconco Corp., MI, USA). All freeze-dried liposomal powders were stored in a sealed glass vials at −4°C for further analysis.
Table I.
Composition and Entrapment Parameters of Tenofovir Loaded Phospholipon 100H Liposomes
| Batch no. | Formulation variablesa | Entrapment parameters | |||
|---|---|---|---|---|---|
| Phospholipon 100H (mg) | SA (mg) | Targeted drug loading (mg) | Actual drug loading (mg) | Entrapment efficiency (%) | |
| 1 | 92.5 | 7.5 | 25 | 6.33 ± 2.44 | 25.3 ± 9.09 |
| 2 | 88.75 | 11.25 | 25 | 9.94 ± 3.09 | 39.8 ± 8.09 |
| 3 | 85 | 15 | 25 | 11.8 ± 2.64 | 47.4 ± 5.25 |
| 4 | 81.25 | 18.75 | 25 | 14.5 ± 3.48 | 57.8 ± 5.77 |
| 5 | 77.5 | 22.5 | 25 | 17.7 ± 1.77 | 70.8 ± 2.55 |
SA stearylamine
aAll formulations were prepared with 50 mg cholesterol
Determination of Entrapment Efficiency
Determination of entrapment efficiency (EEF) of tenofovir was determined by measuring the total amount of the drug loaded in liposomal samples (i.e., experimental loading) and comparing this value with the expected amount of the drug in each of the samples based on the drug loading during the preparation (i.e., theoretical loading). The EEF was calculated using the following equation:
 |
1 |
where Dt is the total amount of tenofovir used in the hydration medium, and Dm equals (Dt − amount free drug in supernatant). After suitable dilutions, drug quantitation in the supernatant was done using a Hewlett Packard (HP) HPLC instrument (Agilent Technologies, CA, USA) that consisted of a quaternary HP 1050 pump, HP 1050 autosampler, and 1100 HP UV detector set at a wavelength of 270 nm. The built-in HP thermostatted column compartment was set at 26°C. The HPLC stationary phases was composed of a C8, 4.6 × 250 mm (5 µm packing) reverse phase chromatography Waters Symmetry column, and a Symmetry C8 guard column (5 µm packing) (Waters, MA, USA). The mobile phase consisted of acetonitrile/sodium phosphate buffer dibasic (95:5) and was pumped isocratically at a flow rate of 1.0 mL/min.
Release Study
After ultracentrifugation to remove the unencapsulated drug, the resultant cake was reconstituted with a suitable amount of phosphate buffer pH 7.4 to have a drug concentration of 2.5 mg/mL in liposomal suspension. Float-A-Lyzer tubes (cellulose ester dialysis tubes, 5 mL, MWCO 10 kDa, Spectrum Laboratories, Los Angeles, CA, USA) were used for the dialysis process. Five milliliters of the drug-loaded liposomes in phosphate buffer pH 7.4 was transferred to the tubes, which were then transferred into 40 mL of phosphate buffer pH 7.4. All the system was stirred at 120 rpm at 37°C with a water bath shaker (shallow form shaking bath, Precision Scientific Inc., Chicago, IL, USA). Samples of 100 µL were withdrawn at fixed time intervals (1, 2, 3, 4, 6, 8, and 24 h) from outside of the tubes and replaced with equal volumes of phosphate buffer pH 7.4. After suitable dilutions, samples were analyzed for tenofovir by the developed HPLC analytical method. All experiments were done in triplicate.
Particle Sizing and Zeta-Potential Measurements
For the liposomal suspension, vesicular size was determined after appropriate sample dilution with distilled water by photon correlation spectroscopy using a Submicron Particle-Sizer (Model 380, Nicomp Instruments Corp., Santa Barbara, CA, USA). The average vesicle size distribution was determined either by volume or number-based Gaussian or so-called Nicomp (non-Gaussian) fit to raw data, which were collected over 10 min at 23°C at an angle of 90°. Zeta potential of liposomes was measured at 23°C using a zetasizer (NICOMP 380ZLS, Nicomp Instruments Corp.), which is a laser Doppler electrophoresis apparatus. A He–Ne laser (λ = 632.8 nm, 15 mW) was applied during electrophoresis. The ionic strength was 0.16 M.
Compatibility Studies
The compatibility of the drug with the investigated lipid mixture in their freeze-dried liposomal powder was further studied using Fourier transform infrared spectroscopy (FTIR), differential scanning calorimetry (DSC), and powder X-ray diffraction (XRD). FTIR analysis was performed using Nicolet Impact 410 (Thermo Electron Co, Newington, NH, USA) attached to an attenuated total reflectance accessory. A small amount of the freeze-dried liposomes was directly placed on the diamond disk and scanned for absorbance over the wave number range from 4,000 to 500 cm−1 at a resolution of 1 cm−1. DSC thermograms were taken using TA Thermogravimetrical Analyzer (SDT 2960 simultaneous DSC-TGA, TA Instruments Co, New Castle, DE, USA) in a standard aluminum pan. Nitrogen was the sweeping gas, and the heating rate was 10°C/min. Samples (∼2 mg) were loaded in a pan without further treatment. The initial and end temperatures were 25°C and 300°C, respectively. Indium was used as the standard reference material to calibrate the temperature and energy scales of the DSC instrument. XRD analysis was performed on X-ray diffractometer (MD-10 mini diffractometer, MTI Corporation, Richmond, CA, USA) using Cu K 2α rays (λ = 1.54056 Å) with a voltage of 25 kV and a current of 30 mA, in flat plate θ/2θ geometry, over the 2θ ranges 25–70°, with a step width 0.05° and a scan time of 2.0 s per step.
NIR Spectroscopy
For the five freeze-dried liposomal formulations, NIR spectra were collected using a Foss NIR systems spectrometer equipped with Rapid Content™ Analyser (AP-2020, Model 5000, Foss NIR Systems Co., MN, USA) and a diffuse reflectance apparatus over the range 1,100–2,500 nm. Sample analysis occurred by scanning directly through the base of the sample vials. In order to exclude any source of variability due to the vials used for collecting NIR spectra, borosilicate glass vials from the same batch were used for spectra acquisition for all samples. Cho et al. (23) reported that glass vials are transparent to NIR beam and do not affect the obtained spectra. Spectra were collected in quartet to include any intra-sample variation, with rotation of the vials among scans to ensure representative spectra. Using ceramic standard, internal software evaluated the spectrum of the apparent reflectance. Spectral acquisition configuration for the reflectance mode involved using a tungsten–halogen lamp, quartz beam splitter, and a room temperature lead sulfide (PbS) detector. Spectral processing and chemometric analysis were performed using Unscrambler v9.2 software (CAMO, Trondheim, Norway). Reflectance values were converted to absorbance values by a log (1/R) transformation. To minimize baseline shifting due to sample positioning or intensity, all spectra were preprocessed with the third-order polynomial Savitzky–Golay second-derivative treatment with a filter width of 11 data points (24). Partial least squares (PLS) regression was used to develop the calibration model for predicting the individual components loading percentage as well as the release characteristics. Full cross-validation was applied to assess the predictive performance of the model. The optimum number of PLS factors for calibration was that which gave a minimum validation error. Calibration and validation performances were evaluated as the multiple coefficient of determination (R2) and root mean square standard error of calibration and validation (RMSEC and RMSEP).
Near-Infrared Chemical Imaging
NIR chemical imaging is similar to traditional single point spectroscopy in that the sample is illuminated with NIR radiation, and the resulting reflected radiation is directed toward a sensitive detector. The major difference is the simultaneous acquisition of tens of thousands of spatially resolved spectra versus a single spectrum. This is enabled by the use of a two-dimensional NIR detector, the FPA. The image data sets for the five freeze-dried liposomal powders were collected by the Sapphire™ NIR Spectral Imaging System (Spectral Dimensions, Inc, MD, USA). No sample preparation was required. The imaging system consists of a liquid crystal tunable filter (LCTF) coupled with a NIR-sensitive FPA detector. The diffuse reflectance image of the sample is passed through the LCTF. The tunable filter element rapidly selects wavelengths over a spectral range of 1,200–2,450 nm. A series of images are then captured by the indium–gallium–arsenide near-infrared FPA detector with a total acquisition time of ∼2 min per sample. Each pixel in the detector array corresponds to ∼1,600 µm2 (40 × 40 µm) area of the powder surface, and the resulting data set contains 125 wavelength increment scans per spectrum. The data sets are generally referred to as image cubes or hyperspectral image cubes.
Data were analyzed using ISys™ 5.0 software (Spectral Dimensions Inc., MD, USA). Spectral data were converted to absorbance according to the following equation:
 |
2 |
where A is the absorbance, and R is the reflectance, obtained by processing the sample (S), dark (D), and background (B) image cubes as follows:
 |
3 |
The dark cube (D), collected with camera looking at a mirror (no reflectance), represents primarily the dark current. The background cube (B) or 99% reflectance reference cube, is acquired with camera looking at a reflectance reference (Spectralon 99), and represents maximum signal collected from a uniform, highly reflecting body. Finally, the sample cube contains raw images of sample, which are converted to reflectance data using the above calculation. The pixels with the very high reflectance corresponding to the aluminum slides holding the powders were masked from the images. A partial least squares regression was performed on a data set containing in each row the spectral mean vector of all pixels spectra in each formulation’s image. Several preprocessing methods such as multiplicative scatter correction, standard normal variate, and derivatives were compared to treat the spectral data. The best performance in visualizing groups in the data was found with third-order polynomial Savitzky–Golay derivative with a filter width of 11 data points, which is in accordance with the preprocessing treatment used for conventional NIR spectroscopic analysis. In order to visualize the differences between and within the formulations’ images (e.g., different spatial distributions of components within a liposomal powder), a library was built from the pure component spectra representing tenofovir, phospholipon 100H, cholesterol, and stearylamine. The spectral absorbance for each pixel was decomposed into score values associated with each component. The intensity values for the responses of the PLS calibration/prediction represent the score values for class 1, the drug. The discrimination among the different formulation based on the drug loading could be seen qualitatively from the NIR images by visual inspection. Moreover, a quantitative measure of the percentage drug loading was established by calculating the percentage of the drug distribution intensities over a fixed number of pixels as represented by the histograms of the PLS score images.
RESULTS AND DISCUSSION
Entrapment Efficiency, Particle Sizing, and Zeta Potential
It has been shown that the affinity and the interaction of liposomes with cells depend on the composition, the charge, and the fluidity of the liposome. However, encapsulating a sufficient amount of the therapeutic agent is considered one of the most desirable properties for liposomes usage (25,26). The therapeutic activity of many liposomal formulations of membrane-permeant drugs will likely depend on the success of efforts to design liposomes having enhanced drug retention characteristics. In an attempt to enhance the retention and to improve the cellular uptake and subsequent bioavailability enhancement of tenofovir, its liposomal formulations were prepared in five batches with varying amounts of phospholipon 100H and stearylamine as a positive charge imparting agents at constant cholesterol to lipid ratio of 0.5:1 (w/w). The entrapment characteristics of the five formulations are presented in Table I. It is important to note that tenofovir entrapment was very low in the absence of stearylamine due to the leakage of the drug through the lipid bilayers during the hydration step. Increasing the percentage incorporated of stearylamine was accompanied by an increase in EFF. For example, 25.32% and 70.84% were the resulted EEFs for batches 1 and 5, which were prepared with 5% and 15% (w/w) stearylamine, respectively (Table I). This result could be attributed to the ionization of tenofovir into its negatively charged conjugated acid that may interact with the positive stearylamine component of the lipid bilayers (27). Deleers et al. (28) stated a rigidization of the liposome bilayers by the addition of stearylamine to the lipid pool, and hence, higher EEF was observed. This result was attributed to the long stearyl chain inserted into the lipid bilayers that led to a lower permeability to the entrapped drug (29).
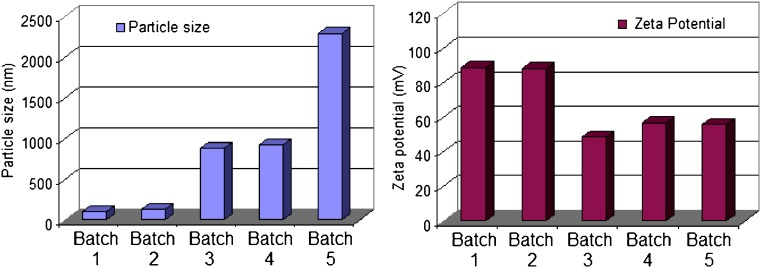
Mean particle size and distribution was determined, immediately after hydration, using dynamic light scattering principle. The Nicomp volume weighting size of the liposome MLV ranged from 100 nm to 2.29 µm (Fig. 1). It is shown that the increased amount of stearylamine resulted in an increase in the mean liposomal size. Deleers et al. (28) explained this phenomena on the basis of the tendency of the small unilamellar vesicles to be converted rapidly to multilamellar vesicles as the function of increasing the stearylamine percentage in the lipid bilayers. The authors ascribed this behavior to the effect of stearylamine to accelerate the fusion of unilamellar vesicles and the formation of new liposomal structures. This point is of primary importance in the use of liposomes as pharmacological capsules for tenofovir delivery. A change in size of vesicle could have dangerous mechanical effect by plugging the microvasculature. Moreover, the mechanisms of liposome–cell interaction could be dependent on the mode of organization of the lipid matrix. For these reasons, the percentage employed of stearylamine is considered a critical factor that could affect not only the percentage of the drug entrapped but also the biological fate of tenofovir incorporated liposomes.
Fig. 1.
Particle size and zeta potential data of tenofovir loaded phospholipon 100H liposomes as a function of stearylamine percentage (SD did not exceed 5% of the recorded values)
The zeta potential of the five liposomal preparations was measured using Nicomp 380 ZLS. All the formulations exhibited a positive charge, indicating the association of stearylamine molecules at the liposomal surface in regard to the absence of negatively charged drug molecules at the surface. Zschörnig et al. (30) explains the binding of a macromolecule dextran sulfate to the liposomal surface by the change of the sign of the surface potential of the stearylamine-containing liposomes to positive. It was shown that higher stearylamine percentage in the lipid bilayers was accompanied by a decrease in the surface charge. This result could be attributed to the neutralization of the positively charged stearylamine molecules by increasing the percentage of the entrapped drug.
Release Study
The rationale for the experiments described here was that the permeability of anionic drugs could be significantly reduced if the lipid bilayers of the liposome possessed a positive surface potential. In the current study, the surface charge on the liposome bilayers was created by the presence of the cationic lipid stearylamine since it is known to distribute uniformly within the hydrophobic pool of the liposome (31,32). The leakage of tenofovir from phospholipon 100H/cholesterol/stearylamine liposomes during dialysis at 37°C as a function of stearylamine percentage is shown in Fig. 2a. Tenofovir leakage followed first-order release kinetics under the experimental conditions used as shown by the linear relationship of plotting the natural logarithmic of the percentage drug remaining versus time (Fig. 2b). Tenofovir release for 8 h decreased as the percentage incorporated of stearylamine increased. For example, 66.5% and 29.9% were the percentages of the drug released after 8 h from batches 1 and 5, which were prepared with 5% and 15% (w/w) stearylamine in the lipid pool, respectively. Previous studies have suggested that drug encapsulation and release properties can be explained entirely on the basis of the permeation of the neutral form of the drug (33). If this was also the case with tenofovir, then the presence of a cationic lipid in the membrane would not be expected to affect drug release, since there should be negligible effect of a surface charge on neutral drugs (34). However, the data presented in Fig. 2 clearly indicate a dependence effect of the cationic lipid on drug permeability. It is likely that the reduced drug leakage observed by increasing stearylamine contents might be a consequence of the reduction of the permeability coefficients for the charged form of the drug.
Fig. 2.
Release data of tenofovir from multilamellar phospholipon 100H liposomes as a function of stearylamine weight ratio during dialysis at 37°C (part A) and fitting the release data to first-order release kinetic model (part B). The standard deviations for these samples were typically <4%. Linear regressions of the lines presented in B had R 2 values of at least 0.93
Compatibility Studies
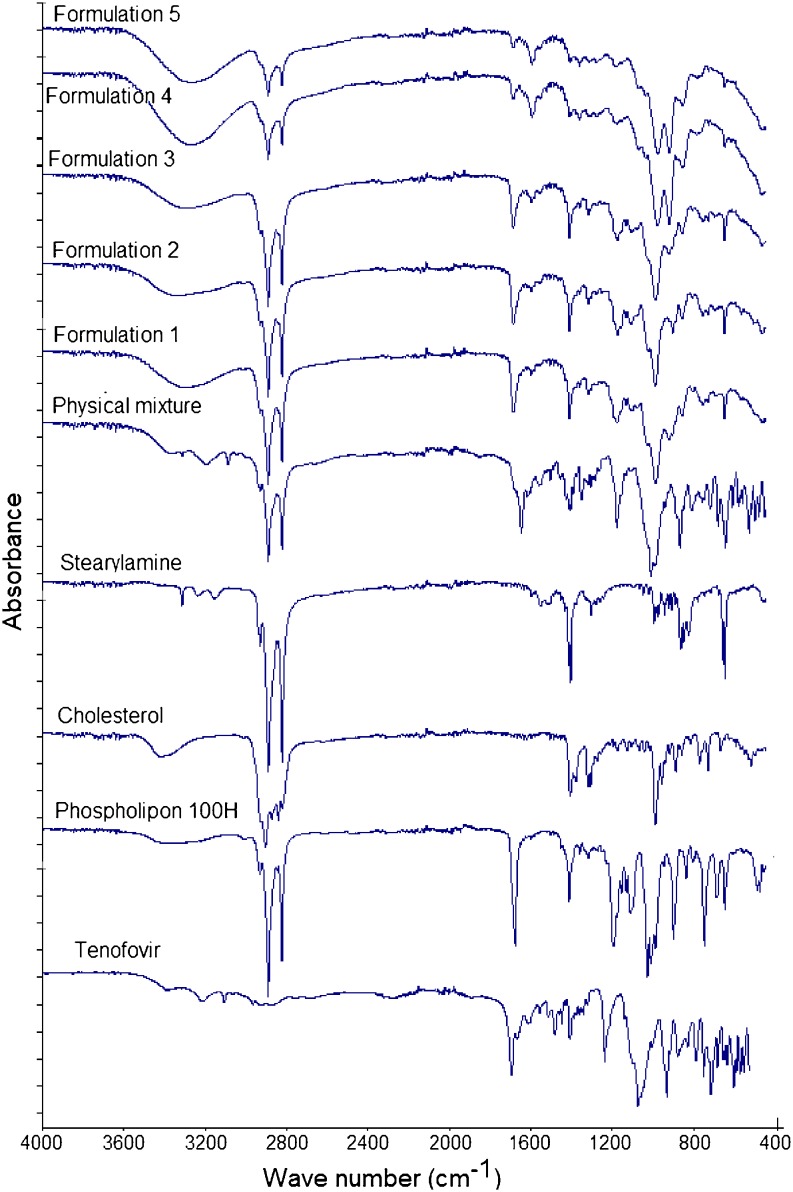
In order to further explore any source of interaction or incompatibility that may exist between the drug and any of the investigated excipients, FTIR, DSC, and XRD analysis of the freeze-dried liposomal powder were conducted. Figure 3 shows that the main absorbance bands in the spectrum of raw tenofovir correspond to the following functional groups: aromatic C–H stretch at 3,110 cm−1, two weak intensity broad O–H bands at 3,200 and 3,300 cm−1, P═O stretch at 1,680 cm−1, aromatic C═N stretch in pairs at 1,410 and 1,450 cm−1, medium stretch of C–N deformation at 1,250 cm−1, medium stretch of the NH2-scissoring band at 1,550 and 1,570 cm−1, various N–H wagging bands at 660–900 cm−1, and various C–H out of plan deformation at 900–600 cm−1. The spectrum of phospholipon showed that the characteristic band at 1,630 cm−1 corresponds to C═O stretching vibration and absorbance maxima around 2,925 and 2,855 cm−1 due to the C–H bands. Cholesterol spectrum displayed a characteristic weak broad band at 3,180–3,450 cm−1 that corresponds to OH stretch. Stearylamine spectrum was simply displaying absorbance maxima around 2,925 and 2,855 cm−1 due to the C–H bands, a sharp medium intensity peak at 1,300 cm−1 due to C–N stretch, and NH2 wagging vibration at 600 cm−1. The FTIR spectrum of the physical mixture, which was prepared by mixing the four individual excipients at equal weight ratios using mortar and pestle, showed no change in the positions of the absorption bands of the four components ,indicating that there are no chemical interactions in the solid state between the drug and the used excipients. The spectra of the five freeze-dried liposomal formulations showed a disappearance of the two tenofovir OH stretches, and a new significant broad stretch of O–H group appeared at 3,050–3,500 cm−1 that increased in intensity as the stearylamine percentage (w/w) increased. In addition, the stearylamine NH2 wagging vibration at 600 cm−1 and the C–N stretch at 1,300 cm−1 decreased in intensity and completely disappeared in formulation 5. If no interaction existed, it would be expected that increasing the stearylamine percentage would increase its contribution through the spectra of the five formulations. However, increasing stearylamine loading led to increasing the drug encapsulation, and further interaction might result. In this prospect, these observations could be ascribed to the significant interaction that existed between stearylamine and tenofovir, which increased in magnitude as the percentage of stearylamine increases in the lipid pool during liposome preparation.
Fig. 3.
FTIR spectra of raw tenofovir, phospholipon 100H, cholesterol, stearylamine, physical mixture, and formulations 1–5
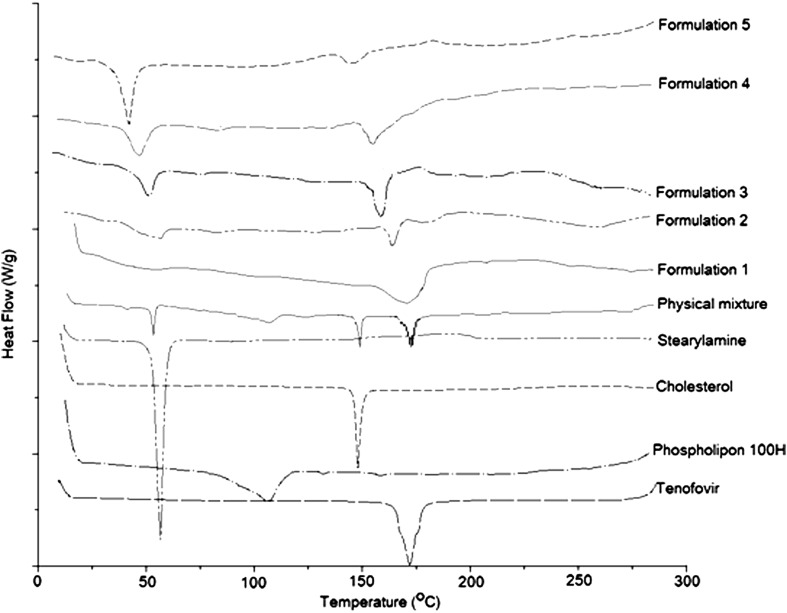
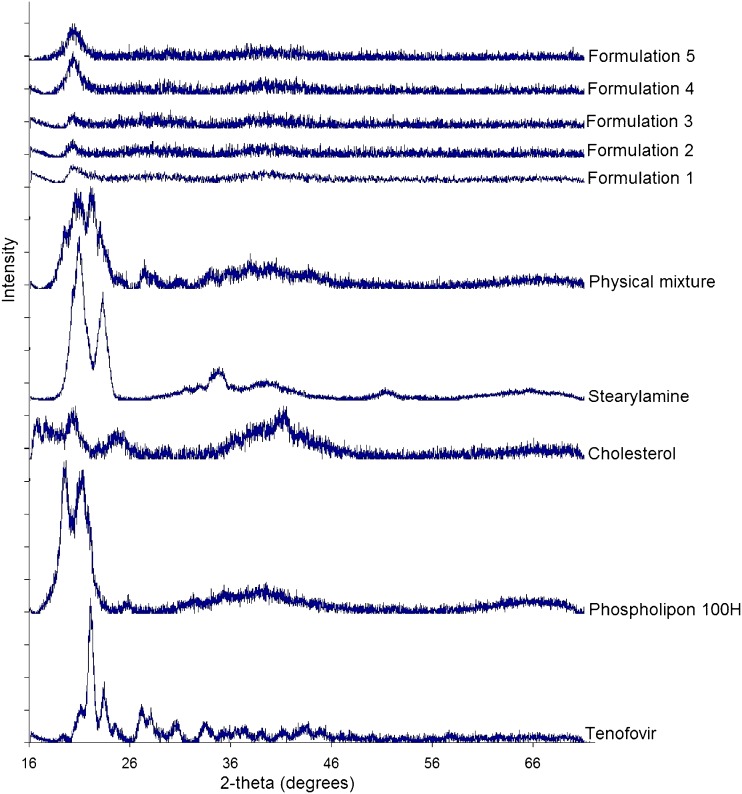
DSC studies were performed to detect any possible thermal transition as a result of tenofovir entrapment within the phospholipon liposomes (Fig. 4). Tenofovir and stearylamine thermograms showed a strong endotherm at 172°C and 55°C corresponding to their melting points, respectively. A change in the peaks’ shape with further shift to lower temperatures was observed in the thermograms of the five formulations. Cholesterol thermogram showed a sharp endothermic peak at 150°C, indicating its melting point that disappeared from the thermograms of the five formulations. This result could be attributed to its fusion with the phospholipid bilayers in an amorphous state. Phospholipon 100H thermogram showed a weak broad transition at 105°C that was shown in the thermogram of the physical mixture, while it disappeared in the thermograms of the freeze-dried liposomal formulations. Increasing stearylamine percentage from 5% w/w (batch 1) to 15% w/w (batch 5) resulted in a reduction in the melting point of tenofovir from 172°C to 150°C and that of stearylamine from 55°C to 40°C, respectively. Those results show that the incorporation of stearylamine in phospholipon liposomes markedly interacts with the incorporated tenofovir as well as modify the fluidity of the liposomal bilayers. These results are in a good agreement with those reported by Deleers et al. (28) that suggest that stearylamine induces the formation of a new liposomal structure. The XRD analysis data are shown in Fig. 5. The obtained results augment the DSC observations to indicate the crystallinity of the individual excipients as well as their physical mixture. On the other hand, the XRD patterns of the five formulations showed a hallow patterns that are typical to amorphous characteristics, indicating the diminished crystallinity of the drug as well as the investigated excipients by the formulation procedure. In summary, the compatibility studies explored a significant interaction that existed between the drug and stearylamine that was responsible for increasing the entrapment efficiency as a function of the percentage incorporated of stearylamine.
Fig. 4.
DSC thermograms of raw tenofovir, phospholipon 100H, cholesterol, stearylamine, physical mixture, and formulations 1–5
Fig. 5.
XRD patterns of raw tenofovir, phospholipon 100H, cholesterol, stearylamine, physical mixture, and formulations 1–5
NIR Spectroscopy
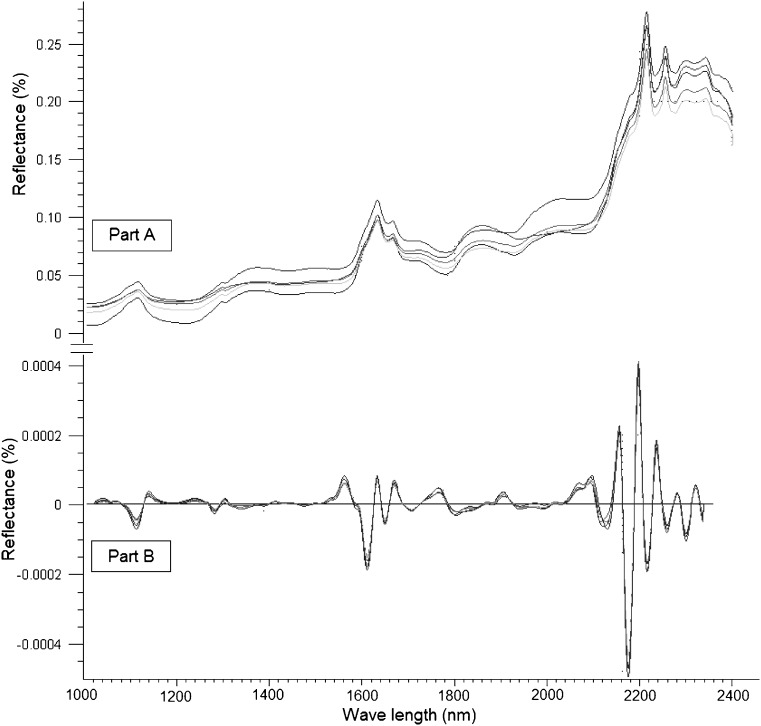
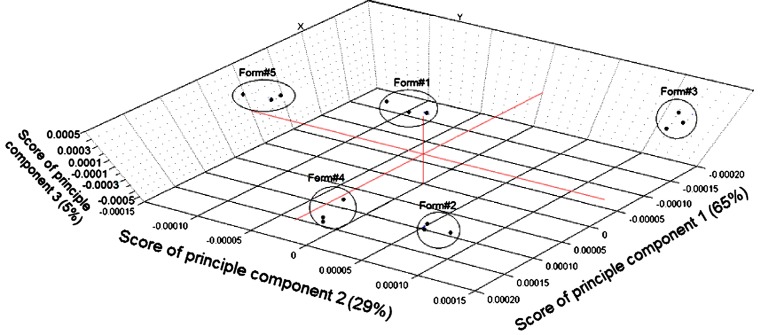
No information was found in the literature for monitoring the percentages of the drug entrapped as well as different excipients employed for the preparation of phospholipon 100H-based liposomes by NIR tools. Therefore, the study included a nondestructive investigation of the ability of NIR spectral features to detect the actual tenofovir entrapped within the five liposomal formulations as well as other chemical variability due to the employed excipients. Figure 6 (part A) illustrates the influence of changing the weight percentage of stearylamine on the spectral raw data of the five formulations between 1,000 and 2,300 nm. It is a fact that dissimilar packing densities of freeze-dried powders cause variations in the recorded reflectance spectra due to scattering and thus differences in the light path length (35). Smith et al. (36) states that the baseline shift of the spectrum is the main source of error in NIR calibration models. In order to develop a robust calibration and enhance the small reflectance differences that exist among the spectra, the variability due to baseline shifting should be reduced. To achieve this goal and to improve the peaks’ resolution, second derivative spectrum for assessment of actual drug loading within the samples was used by means of a Savitzky–Golay filter using 11 data points filter and a third-order polynomial (Fig. 6, part B). Principal component analysis (PCA) was applied using three principal components to perform a preliminary study of the structure of the data (Fig. 7). Full cross-validation method as specified by Droge (37) was applied to assess the predictive performance of the model while minimizing the number of principle components as possible. Droge (38) has compared the different cross-validation criteria as estimates of the mean-squared error of prediction, concluding that full cross-validation outperforms the traditional leave one out cross-validation. More precisely, it has been shown that the absolute value of the bias of full cross-validation is smaller than that of cross-validation, and under the assumption of normally distributed errors, full cross-validation has a smaller variance than cross-validation. Figure 7 shows the 3D plot for the scores of the first (PC1), second (PC2), and third principal component (PC3) of the calibration and validation data. It is shown that PC1, PC2, and PC3 explained 65%, 29%, and 5% of the total variance among the data. The model shows a clustering of the spectra of five formulations into five groups; however, no trends were found depending on the scores of any of the three PCs. Classification of the formulations based on spectral data is not a trivial task. One single data set can reveal several distinct group structures, and geometrical exploration based on score plots of PCA does not necessarily show the clusterings we seek. Even if the amount of variance accounted for by the difference in drug percentage in the freeze-dried powder is small compared to the total variance of the data, additional data were required to filter it out and hence to obtain successful classification.
Fig. 6.
Raw NIR reflectance (part A) and second derivative (part B) spectra of the five tenofovir-loaded liposomal formulations
Fig. 7.
NIR spectra of the five liposomal formulations data projected onto PC1, PC2, and PC3 computed by principal component analysis
PLS regression is a full spectrum method that extracts PLS factors from whole wavelength regions and correlates the spectral data in these regions with the property of interest (39). In this study, PLS was adopted for the model development using four spectra for each formulation and a full cross-validation method. Table II shows regression data for the model prediction of tenofovir, phospholipon 100H, and stearylamine weight percentages of the freeze-dried liposomal powder. In an attempt to correlate the drug release characteristics from the prepared formulations to the NIR spectral data, the release data were fitted to the chemometric model. The predicted values were reproducible and had a reasonable standard deviation. Using three PLS factors, linear relationships were obtained by regressing the experimental data versus the predicted values using the developed PLS model (Table II). For example, correlation coefficients of 0.9910, 0.9979, 0.9979, 0.9866, and 0.9959 were obtained for the calibration models of predicting tenofovir, phospholipon 100H, stearylamine percentages, Q 1hour, and Q 8hours, respectively. On the other hand, validation coefficients of 0.9870, 0.9965, 0.9964, 0.9808, and 0.9936 were obtained for the same parameters, respectively. In order to assess the accuracy of the PLS method to predict these parameters, the mean bias was determined by the following equations (40):
 |
4 |
where Bm is the percentage mean bias, Xc is the predicted value, Xt is the actual experimental value, and n is the number of experiments. The mean bias for tenofovir, phospholipon 100H, stearylamine percentages, Q 1hour, and Q 8hours evaluation were calculated to be 1.4 e−7, −1.5 e−6, −4.3 e−7, −7.15 e−8, and 0.027, respectively. The obtained values were so small compared to the actual data, suggesting the accuracy of the developed model to predict the investigated parameters from the NIR spectral data. Moreover, the obtained relative error values, root mean square errors as well as standard errors of calibration and validation were small compared to the original values, suggesting that the accurate nature of the calibrations is evident.
Table II.
Results of Partial Least Square Regression Analysis for Predicting the Drug, Phospholipid, and Stearylamine Percentages as well as Percentages of Drug Released After 1 and 8 h Using Three PLS Factors
| Tenofovir (%) | Phospholipon (%) | Stearylamine (%) | Q 1hour (%) | Q 8hours (%) | ||||||
|---|---|---|---|---|---|---|---|---|---|---|
| Cal. | Val. | Cal. | Val. | Cal. | Val. | Cal. | Val. | Cal. | Val. | |
| Slope | 0.9822 | 0.9633 | 0.9959 | 0.9851 | 0.9958 | 0.9886 | 0.9734 | 0.9681 | 0.9918 | 0.9854 |
| Offset | 0.0987 | 0.2026 | 0.2145 | 0.7898 | 0.0385 | 0.1112 | 0.2769 | 0.3181 | 0.3244 | 0.5552 |
| Correlation (R 2) | 0.9910 | 0.9870 | 0.9979 | 0.9965 | 0.9979 | 0.9964 | 0.9866 | 0.9808 | 0.9959 | 0.9936 |
| RMSE | 0.3691 | 0.4448 | 0.3077 | 0.4046 | 0.1967 | 0.2569 | 0.7679 | 0.9186 | 1.2359 | 1.5477 |
| SE | 0.3787 | 0.4563 | 0.3157 | 0.4151 | 0.2018 | 0.2635 | 0.7879 | 0.9423 | 1.2680 | 1.5877 |
| Bias | 1.4e−7 | −0.001 | 21.5e−6 | −0.004 | −4.3e−7 | 0.005 | −7.15e−8 | −0.014 | 9.5e−7 | −0.027 |
Cal. calibration, Val. validation, Q 1hour and Q 8hours percentages of drug released after 1 and 8 h, respectively, RMSE root mean square error, SE standard error
Each PLS factor explains a certain portion of the overall spectral and chemical information in the model. This information is given as percent explained variance for the spectral and chemical part of the model. In order to understand the model structure and find wavelength regions relevant to the variability among the spectra, the loading vectors were analyzed for these three PLS factors and compared to the second derivative spectra of the individual components of the systems. Figure 8 shows the loading vector corresponded to PLS1, PLS2, or PLS3. PLS1 loading vector showed a plateau with positive peaks at 1,688, 1,754, 1,792, 2,196, 2,290, 2,332, and 2,370 nm and negative peaks at 1,730, 2,245, 2,306, and 2,352 nm, which are attributed to phospholipon component of the liposomal powder. The positive peaks at 1,678, 1,746, 1,792, 1,906, 2,032, 2,240, and 2,310 nm and negative peaks at 1,214, 1,384, 1,592, 1,726, 2,126, and 2,372 nm were the characteristic peaks for PLS2, which is attributable to stearylamine. PLS3 loading vector showed positive peaks at 1,440, 2,072, 2,202, 2,266, and 2,366 nm and negative peaks at 1,676, 2,038, 2,246, and 2,338 nm, which can explain the variability due to tenofovir entrapment along the different liposomal formulations. These results showed that the NIR spectral characteristics are useful tool for real time monitoring and control of tenofovir loaded phospholipon 100H-based freeze-dried liposomal powders. Moreover, this operational procedure, involved in NIR, is simple and nondestructive, while the time required for measurement is only a few minutes.
Fig. 8.
Loading vectors of the three PLS factors and second derivative spectra of the individual components
Near-Infrared Imaging
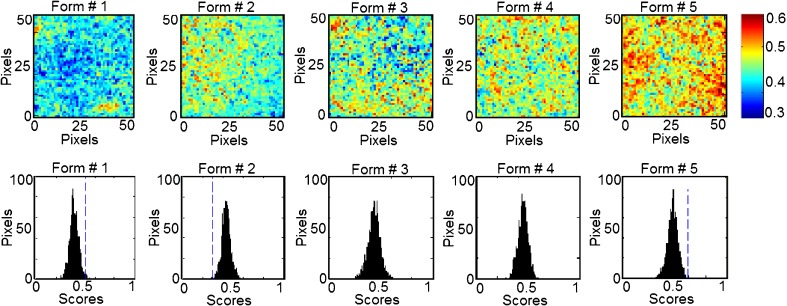
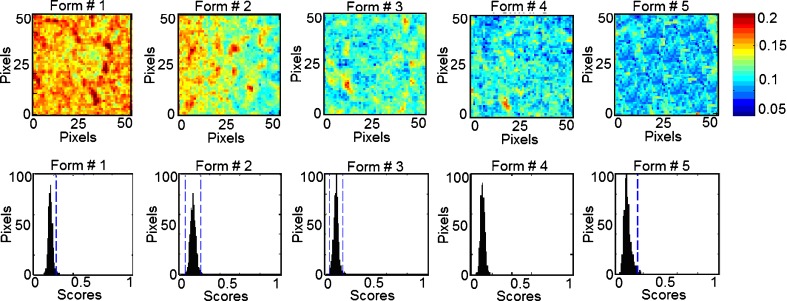
In classical NIR spectroscopy, a spectrum reflects the integrated spectral information of the sample surface, which depends on the spot size generated by the beam of light. Recently, NIR imaging systems became available for acquiring spectral and spatial information simultaneously. The spatial locations of the spectra identify chemical species inside the samples and map their distributions. In order to expand this concept to phospholipon 100H-based liposomes, the current study characterizes quantitatively the spatial distribution of the chemical species within the prepared five formulations for the prediction of their drug and phospholipid loadings. This technique effectively probes the chemical heterogeneity of different species with the freeze-dried liposomal powder by generating image contrast based on the absorbance at a particular wavelength for all pixels in the image. PLS score images of the five formulations concatenated according to classes 1 and 2 in the prebuilt PLS library are shown in Figs. 9 and 10, respectively. Classes 1, 2, 3, and 4 were assigned for tenofovir, phospholipon 100H, cholesterol, and stearylamine components, respectively. No specific trends were found for changing either the cholesterol or stearylamine contents within PLS images of the five freeze-dried powders. The structural similarities among cholesterol, stearylamine, and phospholipon 100H might be responsible for this observation (Fig. 8). In addition, the employed weight ratios of stearylamine to phospholipon 100H were so small so that it had been masked by the high percentage of phospholipon 100H. An improved design to discriminate the stearylamine contents would be to have some experiments with higher stearylamine percentage but full load of the drug in the lipid compartment of the liposome would be expected. The corresponding histograms represent distribution of pixel values about a mean value based on each class (41). These PLS score images were processed together and were normalized to the same contrast scale. As a result, the spatial distribution of the drug and phospholipid are visualized. This is a remarkable procedure to “mine” both spatial and chemical variance within the samples. PLS images and the localized histograms of all the formulations show a uniform distribution of components and a minimum of contrast. Moreover, the five histograms for either the drug or phospholipid classes exhibit symmetric distributions. The obtained result indicates the efficiency of the method used to prepare spatially homogenous freeze-dried powders.
Fig. 9.
NIR PLS images and associated PLS histograms of the five formulations. The same scale is used for all the images, with the highest intensity representing pixels rich in tenofovir (class 1)
Fig. 10.
NIR PLS images and associated PLS histograms of the five formulations. The same scale is used for all the images; with the highest intensity representing pixels rich in phospholipon 100H (class 2)
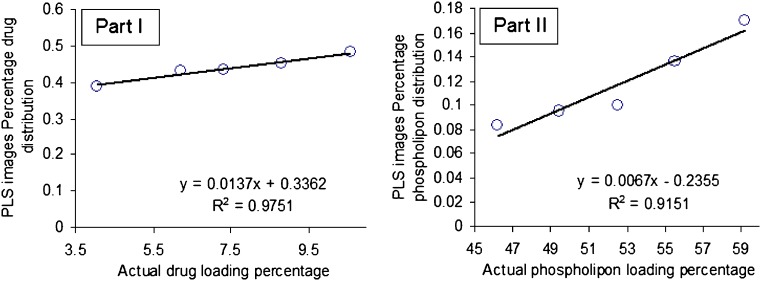
The width of the distribution shown in each histogram is a quantitative indicator of the heterogeneous spatial distribution of either tenofovir or phospholipid within each sample. The percentage distribution with a standard deviation of the population was used as a quantitative measure of the actual loadings of either of the classes within each sample. Therefore, a statistical evaluation of the percentage distribution with standard deviations relative to the mean and the skewness of the histograms generated by the PLS score images are shown in Table III. The five histograms associated with each class series exhibit low skewness values and hence symmetric distributions. It could be shown that the formulations can be arranged according to their percentage distribution values generated from the corresponding PLS images according to their tenofovir or phospholipid contents. The same arrangement could be observed by the visual examination of the five PLS images of each class. Quantile–quantile plots were constructed for the actual drug and phospholipid loading percentage and the percentage distributions obtained for either the drug or phospholipid loadings prediction using the PLS score images (Fig. 11). Good correlations with coefficients of 0.9751 and 0.9151 were obtained for either tenofovir or phospholipon predictions explaining the validity of the model for the nondestructive drug and phospholipid assessments within their liposomal freeze-dried powders. Traditional NIR spectroscopy was limited in its ability to evaluate powdered drug product homogeneity. The qualitative aspect associated with mapping the spatial distribution is lacking with this approach. However, it was able to monitor the percentage incorporated of all the chemical species within the prepared liposomal powder. Compared to traditional NIR spectroscopy, NIR spectral imaging provided the opportunity to investigate localized microdomains within liposomal freeze-dried powders. However, NIR imaging was limited in their ability to discriminate among all the species included.
Table III.
Variability of PLS Histogram Distributions from PLS Score Images of the Five Formulations
| Formulation number | Number of pixels in each image | Class 1 (tenofovir) | Class 2 (Phospholipon) | ||
|---|---|---|---|---|---|
| Percentage distribution | Skewness | Percentage distribution | Skewness | ||
| 1 | 2,476 | 0.388 ± 0.04 | 0.055 | 0.1701 ± 0.01 | 0.0941 |
| 2 | 2,494 | 0.430 ± 0.04 | 0.168 | 0.1362 ± 0.02 | 0.0126 |
| 3 | 2,482 | 0.434 ± 0.05 | -0.123 | 0.1004 ± 0.02 | -0.0045 |
| 4 | 2,485 | 0.452 ± 0.04 | -0.089 | 0.0954 ± 0.01 | 0.1466 |
| 5 | 2,477 | 0.482 ± 0.04 | -0.150 | 0.0836 ± 0.03 | 0.6401 |
Fig. 11.
Quantile–quantile plots for the prediction of either drug loading percentage (part I) or phospholipon 100H loading percentage (part II) using PLS score images’ pixels intensities
CONCLUSION
An integrated multivariate approach was developed to determine tenofovir loading as well as different excipients within a freeze-dried phospholipon 100H- liposomal powders using NIR spectroscopy and imaging. The obtained results showed the formation of a new liposomal structure as the percentage incorporated of stearylamine increased. Drug entrapment efficiency, vesicular size, zeta potential, and release characteristics were dependent on stearylamine loading within the prepared systems. As explained by the FTIR, DSC, and XRD analysis, a significant interaction existed between the drug and stearylamine. Traditional NIR was able to monitor the percentage incorporated of all the chemical species within the prepared liposomal powder. On the other hand, NIR imaging was only able to monitor the drug and phospholipid loading with a supportive data of the homogeneity of their distributions within the prepared batches. In summary, both NIR techniques were complementary in their assessments to provide a rapid approach for acquiring high-resolution spatial and spectral information on tenofovir-loaded phospholipon 100H liposomes.
Footnotes
This scientific contribution is intended to support regulatory policy development. The views presented in this article have not been adopted as regulatory policies by the Food and Drug Administration at this time.
References
- 1.Clumeck N, De Wit S. Update on highly active antiretroviral therapy: progress and strategies. Biomed Pharmacother. 2000;54:7–12. doi: 10.1016/S0753-3322(00)88634-5. [DOI] [PubMed] [Google Scholar]
- 2.Kaufmann GR, Cooper GA. Antiretroviral therapy of HIV-1 infection: established treatment strategies and new therapeutic options. Curr Opin Microbiol. 2000;3:508–514. doi: 10.1016/S1369-5274(00)00131-4. [DOI] [PubMed] [Google Scholar]
- 3.Cihlar T, Birkus G, Greenwalt DE, Hitchcock MJM. Tenofovir exhibits low cytotoxicity in various human cell types: comparison with other nucleoside reverse transcriptase inhibitors. Antiviral Res. 2002;54(1):37–45. doi: 10.1016/S0166-3542(01)00210-8. [DOI] [PubMed] [Google Scholar]
- 4.Cihlar T, Bischofberger N. PMEA and PMPA: acyclic nucleoside phosphonates with potent anti-HIV activity. In: Van der Goot H, editor. Trends in drug research II. Amsterdam: Elsevier; 1998. pp. 105–116. [Google Scholar]
- 5.Schooley R, Myers R, Ruane P, Beall G, Lampiris H, Miller M, Mills R, McGowan I. Tenofovir disoproxil fumarate (TDF) for the treatment of antiretroviral experienced patients. A double-blind placebo-controlled study. 40th International Conference on Antimicrobial Agents and Chemotherapy, Toronto, Canada; 2000.
- 6.Barditch-Crovo P, Deeks S, Collier A, Safrin S, Coakley D, Miller MD, Kearney BP, Coleman RL, Lamy PD, Kahn JO, McGowan I, Lietman PS. Phase I/II trial of the pharmacokinetics, safety, and antiretroviral activity of tenofovir disoproxil fumarate in HIV-1 infected adults. Antimicrob Agents Chemother. 2001;45:2733–2739. doi: 10.1128/AAC.45.10.2733-2739.2001. [DOI] [PMC free article] [PubMed] [Google Scholar]
- 7.Pozniak A. Tenofovir: what have over 1 million years of patient experience taught us? Int J Clin Practice. 2008;62:1285–1293. doi: 10.1111/j.1742-1241.2008.01817.x. [DOI] [PubMed] [Google Scholar]
- 8.Sosnik A, Chiappetta DA, Carcaboso ÁM. Drug delivery systems in HIV pharmacotherapy: what has been done and the challenges standing ahead. J Control Release. 2009;138(1):2–15. doi: 10.1016/j.jconrel.2009.05.007. [DOI] [PubMed] [Google Scholar]
- 9.Sharma A, Sharma US. Liposomes in drug delivery: progress and limitations. Int J Pharm. 1997;154:123–140. doi: 10.1016/S0378-5173(97)00135-X. [DOI] [Google Scholar]
- 10.Desormeaux A, Bergeron MG. Liposomes as drug delivery system: a strategic approach for the treatment of HIV infection. J Drug Target. 1998;6:1–15. doi: 10.3109/10611869808997877. [DOI] [PubMed] [Google Scholar]
- 11.Jin SX, Bi DZ, Wang J, Wang YZ, Hu HG, Deng YH. Pharmacokinetics and tissue distribution of zidovudine in rats following intravenous administration of zidovudine myristate loaded liposomes. Pharmazie. 2005;60:840–843. [PubMed] [Google Scholar]
- 12.Ojewole E, Mackraj I, Naidoo P, Govender T. Exploring the use of novel drug delivery systems for antiretroviral drugs. Eur J Pharm Biopharm. 2008;70(3):697–710. doi: 10.1016/j.ejpb.2008.06.020. [DOI] [PubMed] [Google Scholar]
- 13.Vredenbregt M, Caspers P, Hoogerbrugge R, Barends D. Choice and validation of a near infrared spectroscopic application for the identity control of starting materials. Practical experience with the EU draft Note for Guidance on the use of near infrared spectroscopy by the pharmaceutical industry and the data to be forwarded in part II of the dossier for a marketing authorization. Eur J Pharm Biopharm. 2003;56:489–499. doi: 10.1016/S0939-6411(03)00119-X. [DOI] [PubMed] [Google Scholar]
- 14.Trafford AD, Jee RD, Moffat AC, Graham P. A rapid quantitative assay of intact paracetamol tablets by reflectance near-infrared spectroscopy. Analyst. 1999;124:163–167. doi: 10.1039/a806629i. [DOI] [PubMed] [Google Scholar]
- 15.Bakeev K. Near-infrared spectroscopy as a process analytical tool—part I: laboratory applications. Spectroscopy. 2003;18:32–35. [Google Scholar]
- 16.Bakeev K. Near-infrared spectroscopy as a process analytical tool: part II: at-line and on-line applications and implementation strategies. Spectroscopy. 2004;19:39–42. [Google Scholar]
- 17.Guidance for industry, “PAT-A Framework for Innovative Pharmaceutical Manufacturing and Quality Assurance” (2003). http://www.fda.gov/downloads/Drugs/GuidanceComplianceRegulatoryInformation/Guidances/UCM070305.pdf.
- 18.Roggo Y, Roeseler C, Ulmschneider M. Near infrared spectroscopy for qualitative comparison of pharmaceutical batches. J Pharm Biomed Anal. 2004;36:777–786. doi: 10.1016/j.jpba.2004.08.009. [DOI] [PubMed] [Google Scholar]
- 19.Kuny T, Schatz C, Ulmschneider M, Marrer S, Leuenberger H. Non-destructive dissolution testing correlation. Dissolution Technol. 2003;10:22–28. [Google Scholar]
- 20.Gendrin C, Roggo Y, Collet C. Content uniformity of pharmaceutical solid dosage forms by near infrared hyperspectral imaging: a feasibility study. Talanta. 2007;73(4):733–741. doi: 10.1016/j.talanta.2007.04.054. [DOI] [PubMed] [Google Scholar]
- 21.Saarinen-Savolainen P, Järvinen T, Taipale H, Urtti A. Method for evaluating drug release from liposomes in sink conditions. Int J Pharm. 1997;159:27–33. doi: 10.1016/S0378-5173(97)00264-0. [DOI] [Google Scholar]
- 22.Ausborn M, Schreier H, Brezesinski G, Fabian H, Meyer HW, Nuhn P. The protective effect of free and membrane-bound cryoprotectants during freezing and freeze-drying of liposomes. J Control Release. 1994;30(2):105–116. doi: 10.1016/0168-3659(94)90257-7. [DOI] [Google Scholar]
- 23.Cho S, Chung H, Lee Y. Simple and fast near-infrared spectroscopic analysis of hydroxyl number of polyol using a disposable glass vial. Microchem J. 2005;80:189–193. doi: 10.1016/j.microc.2004.07.013. [DOI] [Google Scholar]
- 24.Savitzky A, Golay MJE. Smoothing and differentiation of data by simplified least squares procedures. Anal Chem. 1964;36:1627–1639. doi: 10.1021/ac60214a047. [DOI] [Google Scholar]
- 25.Mainardes RM, Silva LP. Drug delivery systems: past, present, and future. Curr Drug Targets. 2004;5:449–455. doi: 10.2174/1389450043345407. [DOI] [PubMed] [Google Scholar]
- 26.Heurtault B, Saulnier P, Pech B, Proust J, Benoit J. Physico-chemical stability of colloidal lipid particles. Biomaterials. 2003;24:4283–4300. doi: 10.1016/S0142-9612(03)00331-4. [DOI] [PubMed] [Google Scholar]
- 27.Kulkarni SB, Betageri GV, Singh M. Factors affecting microencapsulation of drugs in liposomes. J Microencapsul. 1995;12:229–246. doi: 10.3109/02652049509010292. [DOI] [PubMed] [Google Scholar]
- 28.Deleers M, Guilmin T, Vandenbranden M, Ruysschaert JM. Thermotropic properties of dipalmitoyl phosphatidyl choline stearylamine liposomes. Pharmacol Res Commun. 1982;14(4):333–339. doi: 10.1016/S0031-6989(82)80103-3. [DOI] [Google Scholar]
- 29.Deleers M, Malaisse WJ. Ionophore-mediated calcium exchange diffusion in liposomes. Biochem Biophys Res Commun. 1980;95(2):650–657. doi: 10.1016/0006-291X(80)90835-9. [DOI] [PubMed] [Google Scholar]
- 30.Zschörnig O, Arnold K, Richter W, Ohki S. Dextran sulfate-dependent fusion of liposomes containing cationic stearylamine. Chem Phys Lipids. 1992;63(1–2):15–22. doi: 10.1016/0009-3084(92)90016-I. [DOI] [PubMed] [Google Scholar]
- 31.Hope MJ, Cullis PR. Lipid asymmetry induced by transmembrane pH gradients in large unilamellar vesicles. J Biol Chem. 1987;262:4360–4366. [PubMed] [Google Scholar]
- 32.Hope MJ, Redelmeier TE, Wong KF, Rodrigueza W, Cullis PR. Phospholipid asymmetry in large unilamellar vesicles induced by transmembrane pH gradients. Biochemistry. 1989;28:4181–4187. doi: 10.1021/bi00436a009. [DOI] [PubMed] [Google Scholar]
- 33.Harrigan PR, Wong KF, Redelmeier TE, Wheeler JJ, Cullis PR. Accumulation of doxorubicin and other lipophilic amines into large unilamellar vesicles in response to transmembrane pH gradients. Biochim Biophys Acta. 1993;1149:329–338. doi: 10.1016/0005-2736(93)90218-O. [DOI] [PubMed] [Google Scholar]
- 34.Murray SW, Jeffery JW, Marcel BB, Lawrence DM. The cationic lipid stearylamine reduces the permeability of the cationic drugs verapamil and prochlorperazine to lipid bilayers: implications for drug delivery. Biochimica et Biophysica Acta (BBA)—Biomembranes. 1995;1238(2):147–155. doi: 10.1016/0005-2736(95)00121-I. [DOI] [PubMed] [Google Scholar]
- 35.Heigl N, Petter CH, Lieb M, Bonn GK, Huck CW. Near-infrared reflection spectroscopy and partial least squares regression for determining the total carbon coverage of silica packings for liquid chromatography. Vibr Spectrosc. 2009;49(2):155–161. doi: 10.1016/j.vibspec.2008.06.003. [DOI] [Google Scholar]
- 36.Smith RC, Baker KS. Optical properties of the clearest natural waters (200–800 nm) Appl Opt. 1981;20:177–184. doi: 10.1364/AO.20.000177. [DOI] [PubMed] [Google Scholar]
- 37.Droge B. Asymptotic optimality of full cross-validation for selecting linear regression models. Statistics and Probability Letters. 1999;44(4):351–357. doi: 10.1016/S0167-7152(99)00026-7. [DOI] [Google Scholar]
- 38.Droge B. Some comments on cross-validation. In: Härdle W, Schimek MG, editors. Statistical theory and computational aspects of smoothing. Heidelberg: Physica; 1996. pp. 178–199. [Google Scholar]
- 39.Shenk J, Workman S, Westerhaus JJ. Application of NIR spectroscopy to agricultural products. In: Burns DA, Ciurczak EW, editors. Handbook of near infrared-analysis. New York: Marcel Dekker; 1992. pp. 383–431. [Google Scholar]
- 40.Otsuka M. Comparative particle size determination of phenacetin bulk powder by using Kubelka–Munk theory and principal component regression analysis based on near-infrared spectroscopy. Powder Technol. 2004;141(3):244–250. doi: 10.1016/j.powtec.2004.01.025. [DOI] [Google Scholar]
- 41.Lyon RC, Lester DS, Lewis EN, Lee E, Yu LX, Jefferson EH, Hussain AS. Near-infrared spectral imaging for quality assurance of pharmaceutical products: analysis of tablets to assess powder blend homogeneity. AAPS PharmSciTech. 2002;3(3):E17. doi: 10.1208/pt030317. [DOI] [PMC free article] [PubMed] [Google Scholar]


