Abstract
Central pattern generators (CPGs) consisting of interacting groups of neurons drive a variety of repetitive, rhythmic behaviors in invertebrates and vertebrates, such as arise in locomotion, respiration, mastication, scratching, and so on. These CPGs are able to generate rhythmic activity in the absence of afferent feedback or rhythmic inputs. However, functionally relevant CPGs must adaptively respond to changing demands, manifested as changes in oscillation period or in relative phase durations in response to variations in non-patterned inputs or drives. Although many half-center CPG models, composed of symmetric units linked by reciprocal inhibition yet varying in their intrinsic cellular properties, have been proposed, the precise oscillatory mechanisms operating in most biological CPGs remain unknown. Using numerical simulations and phase-plane analysis, we comparatively investigated how the intrinsic cellular features incorporated in different CPG models, such as sub-threshold activation based on a slowly inactivating persistent sodium current, adaptation based on slowly activating calcium-dependent potassium current, or post-inhibitory rebound excitation, can contribute to the control of oscillation period and phase durations in response to changes in excitatory external drive to one or both half-centers. Our analysis shows that both the sensitivity of oscillation period to alterations of excitatory drive and the degree to which the duration of each phase can be separately controlled depend strongly on the intrinsic cellular mechanisms involved in rhythm generation and phase transitions. In particular, the CPG formed from units incorporating a slowly inactivating persistent sodium current shows the greatest range of oscillation periods and the greatest degree of independence in phase duration control by asymmetric inputs. These results are explained based on geometric analysis of the phase plane structures corresponding to the dynamics for each CPG type, which in particular helps pinpoint the roles of escape and release from synaptic inhibition in the effects we find.
Keywords: Central pattern generators, Half-center oscillations, Persistent sodium current, Postinhibitory rebound, Adaptation, Geometric singular perturbation analysis
1 Introduction
Animal interactions with the environment include various repetitive movements (breathing, walking, swimming, flapping, scratching, chewing, and so on) that are produced by coordinated rhythmic activities of different neural populations. As shown in many studies, these rhythmic activities are generated by central pattern generators (CPGs), which are special neural networks located in the central nervous system and able to generate rhythmic neural activities in the absence of afferent feedback and rhythmic inputs from other structures (Brown 1911, 1914; Calabrese 1995; Grillner 1985, 2006; Harris-Warrick 1993; Marder 2000; Marder and Calabrese 1996; Marder and Bucher 2001; Marder et al. 2005; Orlovskiĭ et al. 1999; Selverston and Moulins 1985). The bipartite (or half-center) model of the spinal locomotor CPG proposed by Brown (1911), Brown (1914) and refined by Lundberg (1981) provided an important conceptual and theoretical basis for the studies of neural control of locomotion. According to this concept, the rhythmic pattern of alternating bursts of flexor and extensor activities is produced by two symmetrically organized excitatory neural populations that drive alternating activity of flexor and extensor motoneurons and reciprocally inhibit each other via inhibitory interneurons. Recent studies of fictive locomotion in decerebrate, immobilized cat preparations provided additional evidence for a symmetrical, half-center organization of the spinal locomotor CPG as well as for a critical role of reciprocal inhibition for generation and shaping of the locomotor pattern (Lafreniere-Roula and McCrea 2005; McCrea and Rybak 2007; Rybak et al. 2006; Yakovenko et al. 2005). At the same time, the specific intrinsic neural mechanisms involved in the generation of locomotor oscillations remain largely unknown.
The important features of CPGs are their flexibility and their ability to adaptively adjust the oscillatory patterns they generate, including oscillation frequency and phase durations, to organismal demands and current motor tasks under the control of inputs from higher centers, sensory signals, and afferent feedback. For example, oscillation periods observed during fictive locomotion in the decerebrate, immobilized cat evoked by sustained midbrain stimulation range from approximately 0.4–0.5 s to 1.5–1.6 s (McCrea and Rybak 2007; Yakovenko et al. 2005), due perhaps to changes in the descending excitatory drive (Sirota and Shik 1973). During both fictive and real locomotion, changes in the locomotor period usually involve a disproportionate change in the duration of one of the phases. For example, during normal or treadmill locomotion in cats, the shortening of the step cycle (faster walking) is provided primarily by shortening the extensor phase, whereas the flexor phase remains relatively constant (Halbertsma 1983). During fictive locomotion in the immobilized cat (in the absence of sensory feedback), changes in cycle period are usually associated with dominant changes in either extensor or flexor phase, but not in both (Yakovenko et al. 2005), which suggests that even in the absence of afferent feedback each locomotor phase can be independently regulated by the descending supraspinal drive.
Theoretical investigations have shown that similar half-center oscillations may be produced by many different intrinsic and network mechanisms and their combinations (e.g., Calabrese 1995; Harris-Warrick 1993; Marder and Calabrese 1996; Matsuoka 1987; Rowat and Selverston 1993; Skinner et al. 1993, 1994; Wang and Rinzel 1992). For example, half-center oscillations may emerge from two half-centers (neurons or neural populations) coupled with mutual reciprocal inhibition if the activity of each half-center undergoes some form of adaptation allowing the currently suppressed half-center to escape from inhibition at a particular moment of time, become active, and inhibit the currently active half-center, or if each half-center includes some specific features producing hyperpolarization-induced rebound activity that allows the half-centers to release from inhibition and become active after a period of suppression (Skinner et al. 1994). Alternatively, each half-center may be able to generate an intrinsic bursting activity itself, which then becomes alternating and coupled because of reciprocal inhibition between the half-centers.
Rybak et al. (2006) proposed a half-center model of the spinal CPG in which locomotor oscillations were produced by an escape mechanism emerging from a combination of the dynamics of persistent sodium current (INaP) in each half-center and the reciprocal inhibition between the half-centers. With changing descending excitatory drives to each half-center, the model could reproduce the full range of locomotor periods and phase durations observed during fictive and treadmill locomotion. This computational model, however, has not been theoretically investigated in detail. Moreover, although an involvement of INaP in locomotor rhythm generation has received some experimental support (Tazerart et al. 2007; Zhong et al. 2007), the proposed INaP-dependent mechanism remains hypothetical. Other oscillatory mechanisms, such as those described above, can be involved in CPG operation. Since the exact intrinsic mechanisms operating in the CPG remain unknown, we aimed to comparatively investigate the ability of several CPG models to reproduce the key features of the locomotor CPG, namely its capacity to undergo changes in oscillation frequency with change of excitatory drive and its ability to operate in asymmetrical regimes, with different phase durations produced by changing drive to one half-center.
In this paper, we focus on several reduced CPG models, including a simplified version of the INaP-based Rybak et al. (2006) model. Each of these models consists of two neurons with mutually inhibitory synaptic connections, forming a half-center oscillator. The unique components of these reduced models are, respectively, a persistent (slowly inactivating) sodium current, neural adaptation based on calcium influx and calcium-dependent potassium current, and postinhibitory rebound based on low-threshold activated calcium current. In each model, we incorporate excitatory synaptic inputs from sources representing external drives to each neuron and consider the range of oscillation periods over which each CPG can maintain oscillations as the drives to both cells are varied. The resultant oscillations in all models are relaxation oscillations, consisting of two phases in which one neuron (half-center) is active and the other neuron is silent or suppressed with rapid transitions between these phases. The other major focus of our study was the impact of changing the drive to only one of the neurons, which was motivated by the idea that changing drives to each half-center allows the CPG to separately control the duration of each phase of the oscillations it generates. Interestingly, we find that the influence of asymmetric drive on CPG dynamics is highly sensitive to the intrinsic cellular mechanisms involved in rhythm generation in each CPG. We show that CPGs formed from units incorporating a slowly inactivating persistent sodium current show the greatest range of oscillation periods and the greatest degree of independence in phase duration control by asymmetric inputs.
The paper is organized as follows. Section 2 introduces the general form of the equations for the models we consider, along with some important structural aspects. These are followed by the equations for the three specific half-center oscillation mechanisms that we consider. Since each of these examples features fast and slow timescales, we present the idea of fast and slow subsystems, and we use a fast-slow decomposition to derive conditions for the existence of periodic half-center oscillations in the singular limit. Section 3 presents our results on the effects of varying the drives to both or one of the CPG units within each half-center oscillator, and comparative analysis of the effects of drive changes upon the oscillation period and phase durations. This analysis clearly lays out what essential dynamical features lead to each model’s behavior, including the roles of escape and release from synaptic inhibition. The paper concludes with a discussion, given in Section 4, and an Appendix specifying the functions and parameter values used for simulations of the models considered.
2 CPG models and half-center oscillations
2.1 Model equations
Consider, for i ∈ {1, 2}, a system of ordinary differential equations of the form
| (1) |
where 0 < ε ≪ 1, α, β > 0, and s∞(υ) is a monotone increasing function taking values in [0, 1]. For notational convenience, let
| (2) |
with a limiting case of s∞(υ) = H(υ), the Heaviside step function, as σs ↓ 0; however, the results here carry over to more general forms of s∞(υ). In the neuronal case, each υi(t) represents the membrane potential, or voltage, of a cell with capacitance Cm, each hi is an associated channel state variable, and each si modulates the strength of the synaptic coupling current from cell i to cell j. Note that gsynsj > 0, such that as long as υi > υ syn, the coupling term gives a negative contribution to . Coupling for which υ i > υsyn over most relevant values of υi is called inhibitory. Also note that the interval Is := [0, α/(α + β)] is positively invariant for s, and let
The final term of the voltage equation in system Eq. (1) is a cell-specific applied drive current gappi (υapp − υi). We take υ app = 0 mV for the remainder of the paper, corresponding to a typical reversal potential for an excitatory synaptic input. The notation most heavily used in this paper, most of which is associated with Eq. (1), is given in Table 4 in the Appendix.
Table 4.
Some notation used in the paper. Note that h is replaced by Ca for our adaptation model
| Notation | Mathematical definition or meaning |
|---|---|
| F(υ, h, s) | Cmdv/dt |
| υL(h, s) < υM(h, s) < υR(h, s) | Three branches of υ-nullcline |
| Is = [0, smax], smax = α/(α + β) | Interval of relevant values of synaptic variable s |
| pFP(s) = (υFP(s), hFP(s)) | Intersection points of υ- and h-nullclines |
| pLK(s) = (υLK(s), hLK(s)) | Left knees of υ-nullclines |
| pRK(s) = (υRK(s), hRK(s)) | Right knees of υ-nullclines |
| IR | Interval of h-values for points on right branch that jump down immediately upon receiving maximal inhibition |
| IL | Interval of h-values for points on left branch that jump up immediately upon removal of inhibition |
| RCa | IL × IR, defined for the adaptation model |
| TS(x) | Time spent in the silent phase from initial condition h(0) = x |
| TA(x) | Time spent in the active phase from initial condition h(0) = x |
| h̄i | Initial h-coordinate of cell i in a half-center oscillation with balanced drive |
| σ |
s-value at which the curves of critical points and left knees intersect for the adaptation model |
| Λ | Labels structures defined for a cell that receives extra drive |
The following assumptions will be made on system (1):
-
(H1)
For i ∈ {1, 2} and fixed sj ∈ Is, the υ-nullcline, {(υi, hi) : Fi(υi, hi, sj) = 0}, defines a cubic-shaped curve, composed of left, middle, and right branches, in the (υi, hi) phase plane.
Dropping the subscript j from sj, denote the branches of Fi = 0 by for each (h, s) on which all three functions are defined. It is important to remember, with this notation, that the variable s corresponds to the synaptic input received by the cell, driven by the voltage of the other cell. The drive current to each cell, gappi (υapp − υi), is also treated as synaptic but is independent of the other cell in the network. For the analysis, in some cases, we will increase the drive to one cell only. When both cells receive the same drive, we refer to this as baseline drive. When the drive to one cell is increased, we refer to its drive level as extra drive and we mark all variables describing this cell with the Λ symbol.
-
(H2)
For i ∈ {1, 2}, the h-nullcline, {(υi, hi) : gi(υi, hi) = 0}, is a monotone curve in the (υi, hi) plane. For fixed s ∈ Is, the h-nullcline intersects Fi = 0 at a unique point pFP(s) = (υFP(s), hFP(s)).
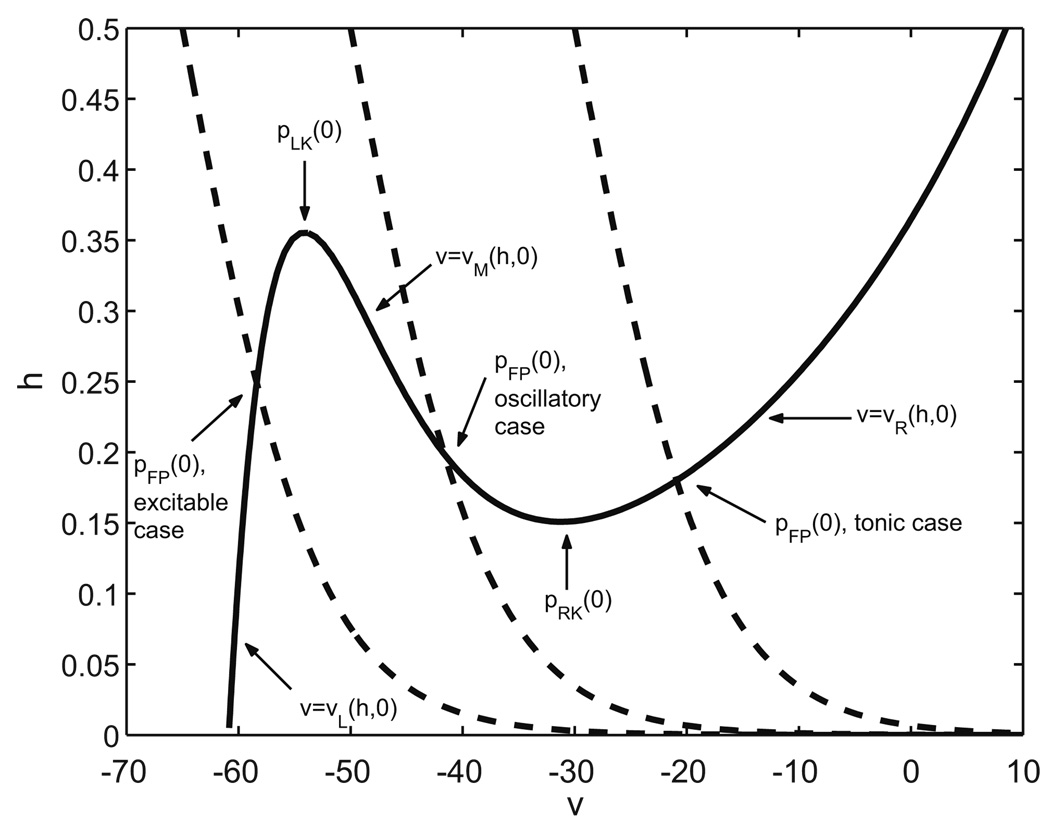
We define a cell as excitable if pFP(0) lies on the left branch of the υ-nullcline, {(υ, h) : υ = υL(h, 0)}. Alternatively, we say that a cell is oscillatory if pFP(0) lies on the middle branch of the υ–nullcline, {(υ, h) : υ = υm(h, 0)}; in this case, the cell will intrinsically oscillate, yielding a reduced representation of bursting activity. Finally, a cell is tonic if pFP(0) lies on the right, most depolarized branch of the υ–nullcline, {(υ, h) : υ = υR(h, 0)}, yielding a reduced representation of tonic spiking. These cases are illustrated in Fig. 1. We assume in this study that the two neurons we are going to couple are either both excitable, both oscillatory, or both tonic.
Fig. 1.
Nullcline configurations and relevant structures illustrated in the persistent sodium model. Three different h-nullclines (dashed) are shown, corresponding to θh = −65 (excitable case), θh = −50 (oscillatory case), and θh = −30 (tonic case), respectively
In a neuron, a bursting solution alternates repeatedly between silent phases of relatively constant, low voltage and active phases featuring voltage spikes, which are rapid voltage oscillations of significant amplitude. A model of the form (1) can be obtained from a model bursting neuron by omitting some spike-generating currents but maintaining a current that allows for transitions to an elevated voltage state. In this model, a bursting solution consists of an oscillation composed of silent phases, with , alternating with active phases, with .
2.2 Specific cases
Here we specify the differential equations for the three classes of dynamics that we consider as building blocks for a half-center oscillator. For each case, the forms of auxiliary functions and the values of parameters incorporated are given in Appendix A, and these are chosen such that assumptions (H1) − (H2) hold.
2.2.1 Half-center CPG based on persistent sodium current (Butera et al. 1999)
For each i ∈ {1, 2} and j ≠ i, take
| (3) |
where INaP(υ, h)=gnapm∞(υ)h(υ−ena), IL(υ)=gl(υ − el), and where h∞(υ), m∞(υ), s∞(υ) are monotone, sigmoidal functions, with h∞(υ) decreasing and the others increasing with υ. The first equation in Eq. (3) describes the evolution of the voltage across the cell’s membrane, with capacitance Cm, in terms of a persistent sodium current (INaP), a leak current (IL), and network (Isyn) and drive (Iapp) synaptic currents.
We set Isyn(υi, s j) = gsynsj(υi − esyn), such that the conductance of the synaptic current for cell i depends on the activity of cell j. The current Iapp is described by Iapp = gappυ, where gapp > 0 is a constant. The second equation in Eq. (3) describes the slow inactivation of the persistent sodium current. Parameters are set such that for each s, the critical point pFP(s) lies on the right branch {υ = υR(h, s)}. Thus, each cell is intrinsically tonic. Moreover, when a cell is in the silent phase, it will eventually jump up to the active phase, even if the level of inhibition it receives does not change. This form of transition is called escape.
2.2.2 Half-center CPG based on postinhibitory rebound (Rubin and Terman 2004; Sohal and Huguenard 2002)
The equations in this case are
| (4) |
As in Eq. (3), the first equation in Eq. (4) is the voltage equation, with voltage dynamics here incorporating a low-threshold or T-type calcium current, IT(υ, h) = gTm∞(υ)h(υ − υca), in addition to a leak current (IL), and network (Isyn) and drive (Iapp) synaptic currents, which take the same forms as in Eq. (3). The second equation in Eq. (4) describes the slow inactivation of the calcium current; h∞(υ), τh(υ) are different functions here than in Eq. (3), as indicated in the Appendix. Parameters are set such that pFP(0) lies on the left branch {υ = υL(h, 0)} and each cell is intrinsically excitable. Since there is no critical point in the active phase for an uninhibited cell, each active cell will eventually jump down and release the other cell from inhibition.
2.2.3 Half-center CPG based on neuronal adaptation (modified from Izhikevich (2006))
In this case, we take
| (5) |
The voltage dynamics, described in the first equation of Eq. (5), depend here on a calcium current, ICa(υ) = ḡCa(Ca∞(υ))2(υ − υCa), and a calcium-dependent potassium after-hyperpolarization (AHP) current, , in addition to the leak and synaptic currents as previously described. The second equation in Eq. (5) describes the slow evolution of the intracellular calcium concentration, based on the inward calcium current and the deviation from a baseline calcium level, cabase; the parameter gCa converts units of current to units of moles/time. Note that Ca here plays the role of the variable h in system Eq. (1).
A key component of the adaptation case is that in the absence of coupling, each cell has a unique stable critical point pFP(0) on the right branch of its υ-nullcline, {υ = υR(h, 0)}. What distinguishes this case from the persistent sodium example described earlier is that here, υR (h, s) varies much more strongly with h, leading to a much more significant decline in voltage during the active phase, instantiating the adaptation. Moreover, the location of pFP(0) is at a sufficiently low voltage, relative to the synaptic threshold θs in Eq. (2), that the synaptic current generated by an active cell diminishes as the cell approaches pFP(0). Transitions in the model will occur in part through release, due to this synaptic adaptation. Since pFP(0) is on the right branch, however, an active cell cannot jump down on its own, and hence transitions must feature an escape component as well.
We consider two parameter sets for this model (see Appendix), which we call case 1 and case 2. These cases represent different balances of effects that result from increasing drive, as we detail further below, but in both, adaptation is a crucial component of phase transitions. Case 2 is more similar to what has previously been considered in models featuring half-center oscillations with mutual inhibition and adaptation (e.g. Shpiro et al. 2007; Skinner et al. 1993, 1994), but we include both to emphasize that the adaptation mechanism supports more than one type of behavior in response to drive modulation.
2.3 Fast and slow subsystems
We will seek to establish conditions under which periodically oscillating solutions can be constructed for systems (3), (4), and (5) under the structural hypotheses (H1) – (H2) and the parameter choices mentioned in Section 2.2, in the singular limit of ε ↓ 0. Results on geometric singular perturbation theory suggest that this construction will yield the existence of nearby oscillating solutions for ε > 0 sufficiently small (Mischenko et al. 1994), although checking the details rigorously may be technically involved.
To begin the analysis, let us call the points in (υ, h) space where any two branches of a cubic-shaped υ-nullcline meet the knees of this nullcline. Specifically, under (H1), for fixed s ∈ Is, the left branch (υL(h, s), h) meets the middle branch (υm(h, s), h) in the left knee of the υ-nullcline, while the middle branch meets the right branch (υR (h, s), h) in the right knee. For each s ε Is, let pLK(s) = (υLK (s), hLK(s)) denote the left knee of the υ-nullcline and, similarly, let pRK(s) = (υRK (s), hRK(s)) denote the right knee of the υ-nullcline; see Fig. 1.
For system (1), there are associated fast and slow subsystems. The fast subsystem is obtained by setting ε = 0 directly and thus takes the form
| (6) |
Recall that i ∈ {1, 2}, so Eq. (6) is a system of six equations.
To define various slow subsystems, set τ = εt and let “dot” denote differentiation with respect to τ. Under this rescaling of time, system (1) becomes, with i ∈ {1, 2},
| (7) |
The slow subsystems are obtained from system (7) by setting ε = 0, solving the algebraic equations, and inserting the results into the h-equation. This process yields, for each i ε {1, 2},
| (8) |
for X ∈ {L,M, R}. In Eq. (8), sj depends on υj and hence is a function of hj.
Consider the limit of σs ↓ 0 in Eq. (2). Since the branch υm(h, s) is unstable with respect to the fast subsystem, there are four distinct slow subsystems (8) that could theoretically be relevant. Two of these are obtained when cell i is silent and cell j active for i = 1 or i = 2, and each of these takes the form
| (9) |
| (10) |
The other two subsystems involve the cases that both cells are silent or active, but we will not write these explicitly as it turns out that they will not be needed here.
A key point is that the singular solution consists of a concatenation of solutions of systems (6) and (9)–(10) for i = 1, 2. Projected to each (υ, h)-plane, the solutions to system (6) consist of jumps between branches of υ-nullclines for different values of s, while the solutions to the slow subsystems take the form of pieces of these nullclines. Although the slow subsystems above correspond to σs ↓ 0, solutions obtained in this limit persist for small σs > 0 for the persistent sodium and postinhibitory rebound models. In the case of adaptation, the smooth form of s∞(υ) in Eq. (2) becomes more important. We will address this in Subsection 2.4.3.
2.4 Half-center oscillation mechanisms
In this section we present the construction of periodic singular solutions for pairs of identical cells mutually coupled with synaptic inhibition, each with dynamics governed by one of the systems given in Section 2.2, under assumptions (H1)–(H2). This construction will include the derivation of conditions for each of the three cases that are sufficient to guarantee existence of such a solution. The conditions that we obtain, namely Eqs. (11), (12), and (15)–(16), respectively, for the three cases, ensure that whenever one cell manages to initiate a transition between the silent and active phases, the other cell will respond by making a transition as well. Conditions (11), (12), and (16) relate the times of evolution between certain points in the silent and active phases, while condition (15) amounts to a guarantee that the adaptation of each cell while it is active weakens its inhibitory signal to the other cell sufficiently that the other cell can eventually become active. Note that in this section we will focus on the case that both cells have the same drive.
2.4.1 Oscillations based on persistent sodium current
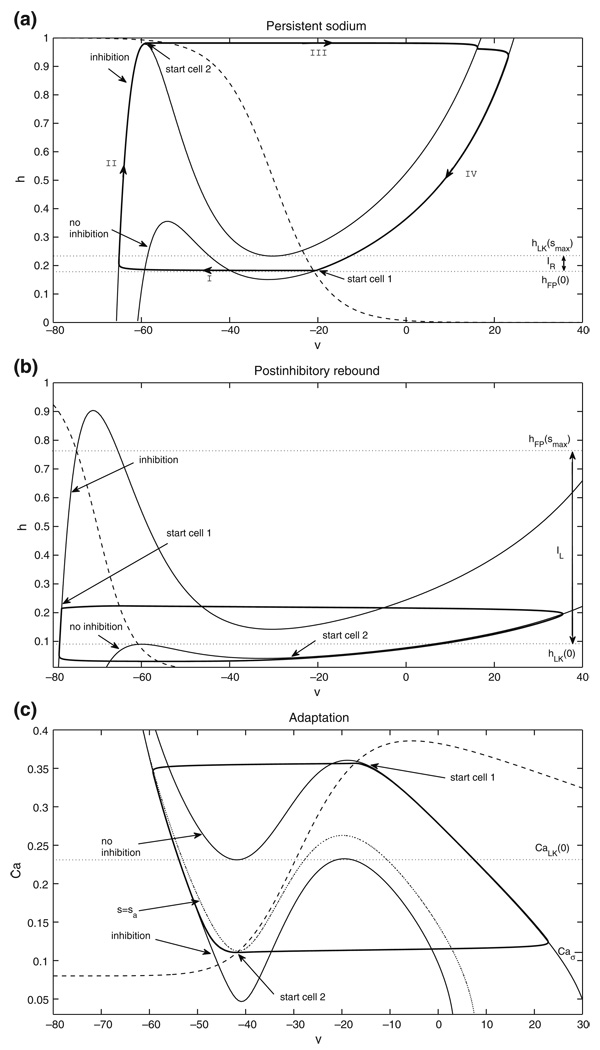
Figure 2(a) shows the nullcline configuration for baseline drive and the basic periodic orbit for two neurons with persistent sodium current tuned such that, in the absence of coupling, each is tonically active. The bottom υ-nullcline corresponds to no inhibition, while the top one corresponds to maximal inhibition. To simplify the argument for the existence of a singular periodic orbit, consider the limit as σs ↓ 0 in Eq. (2). An example of how to deal with σs > 0 is given in Subsection 2.4.3, where its positivity is important, but taking σs > 0 does not affect the qualitative outcome of the arguments given here. Suppose cell 1 starts in the active phase, say at (υR(h1, 0), h1), and cell 2 starts at the left knee pLK(smax). Cell 2 jumps up immediately and inhibits cell 1. Cell 1 will jump down to the silent phase if and only if it is below the right knee of the inhibited nullcline, or more precisely if and only if h1 < hRK(smax). We note that trajectories that jump up to the active phase from the left knee of the inhibited nullcline and descend toward a fixed point will remain above hFP(0), such that h-values below hFP(0) are not accessible to such trajectories. Thus, we define the interval IR = [hFP(0), hRK(smax)] and assume h1 ∈ IR, which ensures that cell 1 jumps to the silent phase (segment I in Fig. 2(a)). Subsequently, we track cells 1 and 2 under the flow of Eqs. (9)–(10) until the first time that cell 2 returns to pLK(smax), say at t = tf > 0. Let h̃1 denote the h-coordinate of cell 1 at t = tf. The existence of a periodic oscillation is guaranteed if for all h1 ∈ IR, h̃1 ∈ int(IR), the interior of IR.
Fig. 2.
Basic nullcline configurations and periodic orbits for the three half-center oscillation mechanisms (see Sections 2.2 and 2.4). Thin solid lines are υ-nullclines, dashed lines are slow variable nullclines, and thick solid lines are trajectories, corresponding to half-center oscillations based on (a) persistent sodium, (b) postinhibitory rebound, and (c) adaptation
To establish this condition, let TS(h1) be the time cell 1 spends in the silent phase, on {υ = υL(h, smax)}, until it jumps up, at pLK(smax); see II,III in Fig. 2(a). When cell 1 jumps up, cell 2 will jump down if its h–coordinate lies in IR. This will occur if TS(h1) > TA, where TA is defined as the time of evolution on the right branch from (υR(hLK(smax), 0), hLK(smax)) to (υR(hRK(smax), 0), hRK(smax)), determined by the dynamics of Eq. (10). Cell 1 spends the shortest possible time in the silent phase if it jumps up from the highest possible h-value in the active phase, namely if h1 = hRK(smax). In this case, TS(h1) = TS(hRK(smax)). Thus, if
| (11) |
then cell 2 jumps down when cell 1 jumps up. Similarly, since at that moment the h–coordinate of cell 2 lies in the interior of IR, it follows that during the time it takes for cell 2 to evolve back to pLK(smax) in the silent phase under Eq. (9), the h–coordinate of cell 1 will return to the interior of IR under Eq. (10); see IV in Fig. 2(a). We can view the above process as a map that takes the initial h–coordinate for cell 1 to its h–coordinate the next time that cell 2 reaches a left knee. Condition (11) shows that for the set IR of attainable h–coordinates from which cell 1 can jump down, this map contracts IR into its own interior. Hence, a fixed point, corresponding to a singular periodic solution, exists. Moreover, there must be at least one stable fixed point of the map, and hence a stable singular periodic solution, by this contraction result.
Finally, let (υR(h̄1, 0), h̄1) denote the position of cell 1 when cell 2 is at pLK(smax) along this periodic solution. By symmetry, which can be proved easily, the period of the oscillation is 2TS(h̄1).
2.4.2 Oscillations based on postinhibitory rebound
The nullcline configuration and the basic periodic orbit for two neurons with low–threshold calcium current, tuned such that in the absence of coupling each is excitable, are shown in Fig. 2(b). We again want to construct a periodic singular solution under the assumption that both cells receive the same, baseline drive and again, for simplicity, consider σs ↓ 0. Suppose cell 1 starts at the right knee pRK(0), ready to jump down, and cell 2 starts in the silent phase at (υL(h2, smax), h2) for some h2 ∈ IL := [hLK(0), hFP(smax)]. Analogously to IR, the interval IL is defined such that the fast decay of inhibition resulting from the jump of cell 1 immediately releases cell 2 to jump up into the active phase.
Similarly to Subsection 2.4.1, we construct a map on the h-coordinate for cell 2 by following the flow of Eqs. (9)–(10) from time 0 until cell 1 returns to pRK(0). Define TS as the time of evolution in the silent phase from (υL(hRK(0), smax), hRK(0)) to (υL(hLK(0), smax), hLK(0)) under Eq. (9) and TA as the time of evolution in the active phase from (υR(h, 0), h) to pRK(0) under Eq. (10). An analogous argument to that from Subsection 2.4.1 implies that if the smallest possible value of TA, namely TA(hLK(0)), satisfies
| (12) |
then at least one stable, symmetric fixed point, corresponding to a stable singular periodic solution, exists. If we let (υL(h̄2, smax), h̄2) denote the position of cell 2 when cell 1 is at pRK(0) along this periodic solution, then the period of this oscillation is 2TA(h̄2).
2.4.3 Oscillations based on neuronal adaptation
We focus now on oscillations based on adaptation. We consider a single parameter set (case 1), since the arguments giving existence of half-center oscillations in both cases are identical. Figure 2(c) shows the nullcline configurations and the basic periodic orbit for two neurons with calcium and AHP currents tuned such that, in the absence of coupling, each cell settles to a tonically active state, as discussed in Subsection 2.2.3. The voltage nullcline is inverted relative to the earlier cases, since calcium accumulates during the active phase and decays in the silent phase. Note that there exists a critical point on the left branch of the inhibited nullcline. This means that an inhibited cell that evolves in the silent phase is not able to reach a left knee unless the level of inhibition to the cell changes, to s = sa < smax in the example in Fig. 2(c). That is, the cell will jump to the active phase only after it is at least partially released from inhibition by the cell that is currently evolving in the active phase, which represents a form of adaptation in the output of the active cell. Hence, choosing parameters that yield this nullcline configuration, positioned in such a way that the inhibitory signal from a cell decays while it is still active, ensures that the half-center oscillation in this case truly incorporates an adaptation-based mechanism.
As above, we now use a contraction argument to establish the existence of a periodic singular solution under the assumption that both cells receive the same, baseline drive. To do so, we need to consider the slow subsystem for the adaptation case. Suppose that cell i is silent, with υi = υL(Cai, s j), and cell j is active, with υj = υR(Caj, si). Assume that since cell i is silent, si = 0. From Eqs. (2), (7), with Ca in place of h, we have
| (13) |
in the singular limit. Thus, the slow subsystem becomes
| (14) |
for g given by the Ca-equation in system (5). Of course, to be precise, even if cell i is silent, si will be small but nonzero. In the rest of this subsection, we assume that the inhibition from a cell shuts off when it is silent, such that si = 0 here.
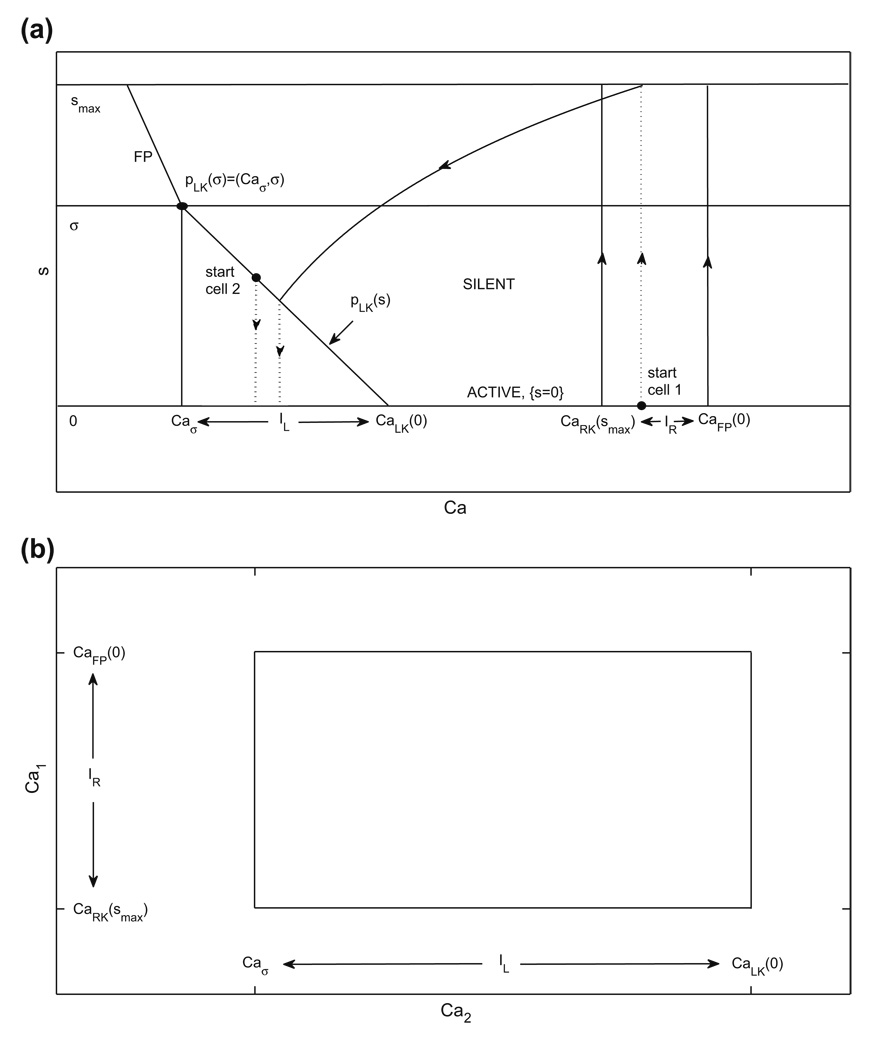
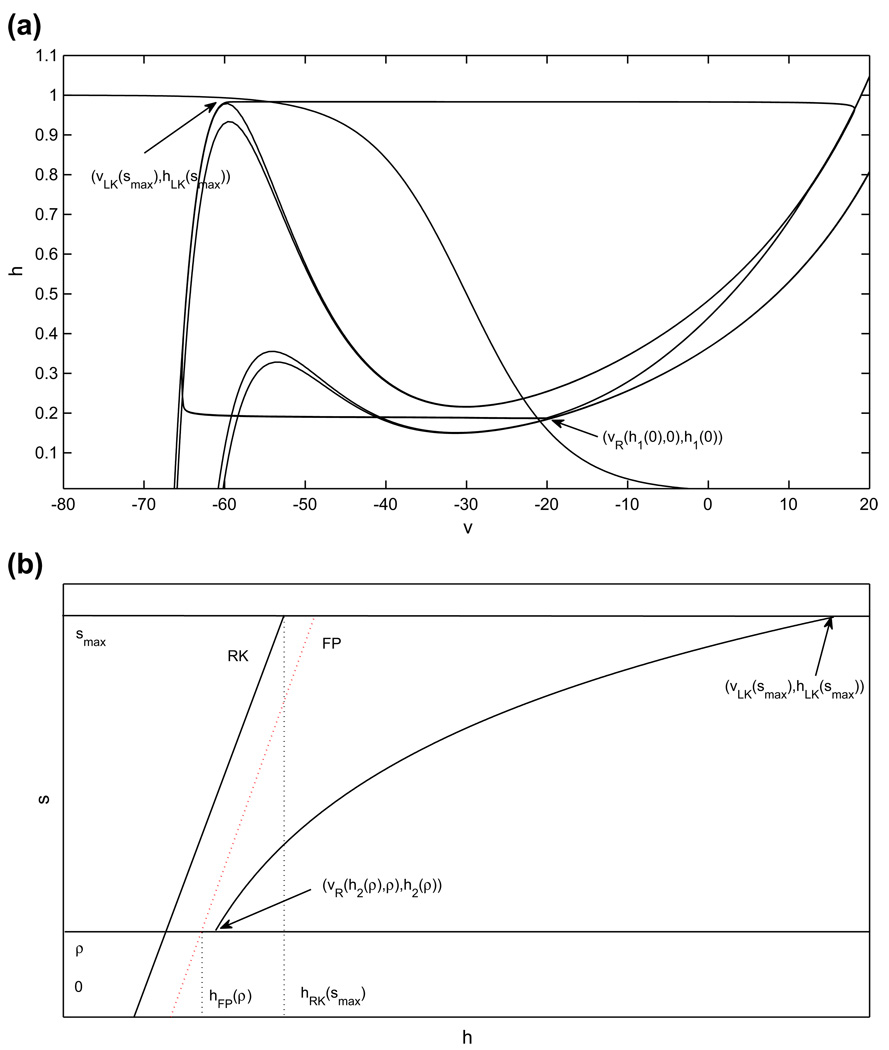
We will track the dynamics of a pair of cells using system (14). Even though each s is a fast variable slaved to the corresponding Ca, it is useful to visualize the cells’ trajectories in a common (Cai, sj) plane, shown in Fig. 3(a). We emphasize here that j ≠ i, which is appropriate since the term sj = s(Caj), but not the term si, appears in the differential equation for Cai. In this figure, a cell that is silent jumps to the active phase when it hits the curve of left knees, pLK(s) = {(υL(CaLK(s), s), CaLK(s)) : s ∈ [0, smax]}. If cell 2 jumps from the silent phase to the active phase and cell 1 jumps from the active phase to the silent phase at the same time, then the trajectory of cell 2 is a vertical segment down from a point on pLK(s) to {s = 0}, while the trajectory of cell 1 is a vertical segment up from {s = 0} to some {s = ŝ > 0}. If hLK(0) is not too large, then ŝ ≈ smax, and for simplicity we take ŝ = smax in Fig. 3 and below. After such a pair of jumps, cell 2 evolves along {s = 0} in the active phase while cell 1 evolves in the silent phase, under the dynamics of system (14).
Fig. 3.
Existence of a periodic oscillation for the adaptation model can be established using a contraction argument. (a) (Ca, s) phase plane. When a cell is in the active phase, it evolves in the direction of increasing Ca (i.e., to the right) along {s = 0}. When a cell is in the silent phase, it evolves in the region with s > 0, with the decay rate of s determined by the position of the other cell in the active phase. The vertical dotted lines indicate that, for the starting configurations shown, cells 1 and 2 switch phases immediately. Under the conditions given in Subsection 2.4.3, the trajectories of both cells converge to a periodic orbit (not shown), which they traverse in anti-phase. (b) The rectangle RCa. The existence of a periodic oscillation is guaranteed if for all (Ca2, Ca1) ∈ RCa, (C̃a2, C̃a1) ∈ int(RCa)
We define (Caσ, σ) as the point at which the curve of left knees intersects the Ca nullcline, such that the fixed point lies at the left knee for s = σ. Correspondingly, Caσ is the minimal Ca–value at which the cell in the silent phase is able to jump up (see Fig. 3(a)). Suppose that cell 2 starts in the silent phase on the curve of left knees, such that it will jump to the active phase and s2 will jump to ŝ. Suppose further that cell 1 starts in the active phase at a point from which it will jump down in response to the rise in s2. Mathematically, these initial conditions can be written as Ca1 ∈ IR := [CaRK(smax), CaFP(0)] (with υ1 = υR(Ca1, 0) and s1 = s(Ca1) correspondingly) and (Ca2, υ2) = pLK(s1), with Ca2 ∈ IL := [Caσ, CaLK(0)] (and with s2 = 0). We can represent our set of initial conditions as a rectangle in (Ca2, Ca1)-space, as shown in Fig. 3(b), since each point on pLK(s) has a unique Ca–coordinate. In analogy to the previous two subsections, we track cells 1 and 2 under the flow of Eq. (14) until the first time that cell 2 returns to the curve of left knees pLK(s), say at t=tf >0, if this return occurs. Let () denote the Ca– and s–coordinates of cell 1 at t = tf and the Ca–coordinate of cell 2 at that time. The existence of a periodic oscillation is guaranteed if tf exists and for all (Ca2, Ca1) ∈ RCa := IL × IR, ∈ int (RCa).
Suppose that cell i is active and cell j jumps up, such that the inhibitory variable sj jumps from sj = 0 to sj = smax. To ensure that tf exists, we need to make sure that when each cell jumps to the active phase, the other cell is in a position to jump to the silent phase. At the same time, a silent cell can only become active if the value of s for the active cell is less than σ, such that the silent cell can reach the curve of left knees. Moreover, as noted above, an active cell i must have Cai > CaRK(smax) to jump to the silent phase when sj jumps from 0 to smax. The condition Cai > CaRK(smax) implies that si < s(CaRK(smax)). Thus, our first existence condition is
| (15) |
for s(Ca) defined in Eq. (13), which ensures σ > si. This condition could be weakened by replacing CaRK(smax) with any value in int(IR), in which case this value would be substituted for CaRK(smax) in the arguments below, but we neglect this possibility here for clarity.
We have assumed that, in the (Cai, s j)–plane, cell 2 starts at pLK(s1) for s1 ∈ [0, σ], such that Ca2 ∈ IL, and cell 1 starts at (Ca1, 0) with Ca1 ∈ IR. From this configuration, cell 2 jumps up immediately and, because cell 1 is in IR, the resulting inhibition induces it to jump down into the silent phase. As long as Eq. (15) holds, cell 1 will eventually reach pLK(s) and jump up again. How long this takes to occur depends on Ca2 at time 0, since the time course of Ca2 controls the time course of s2 = s(Ca2), the inhibitory variable from cell 2 to cell 1, and on the value of Ca1. If we fix the initial Ca2 ∈ IL, then the amount of time it takes for cell 1 to reach pLK(s) is a monotonically increasing function of Ca1 ∈ IR, due to the slope of pLK(s). Define Φ(t; Ca) as the solution of the second equation of Eq. (14) with initial condition Ca. Define TA(Ca) by Φ(TA(Ca); Ca) = CaRK(smax). Define TS(Ca) as the time it takes to evolve system (14) with i=1, j=2 from initial condition (Ca1, Ca2) = (CaRK(smax), Ca) until cell 1 hits pLK(s). Given any initial condition in RCa, it follows that cell 2 will be in position to jump to the silent phase when cell 1 hits pLK(s) if
| (16) |
That is, condition (16) states that for the given Ca2, the shortest possible silent phase duration for cell 1 is long enough for cell 2 to reach a position from which it will jump to the silent phase upon receipt of maximal inhibition.
Note that cell 1 must jump up with Ca1 > CaLK(0), since s2 cannot actually reach 0 while cell 2 is active, and cell 2 must jump down with Ca2 < CaFP(0). Finally, given conditions (15), (16), repeating the argument one more time gives ∈ int(RCa), such that a singular periodic solution exists, and numerical simulations (e.g. Fig. 2(c)) indicate that this solution is symmetric.
3 Control of oscillation period and phase durations
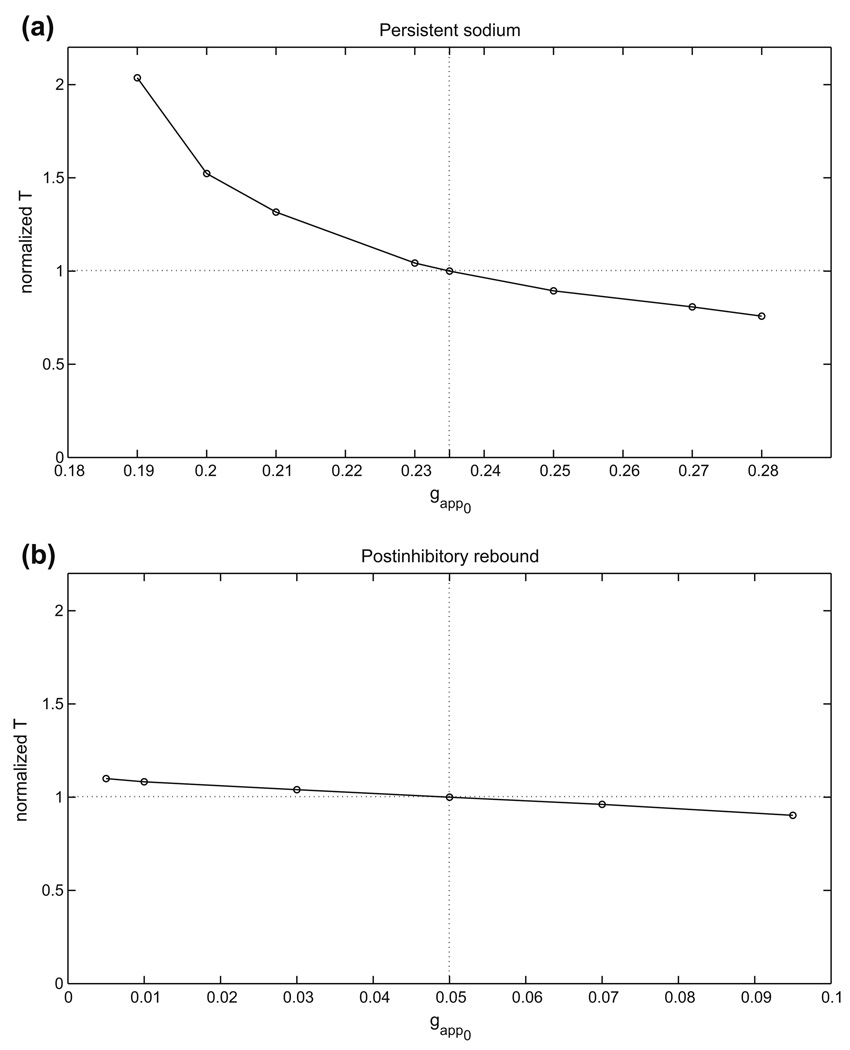
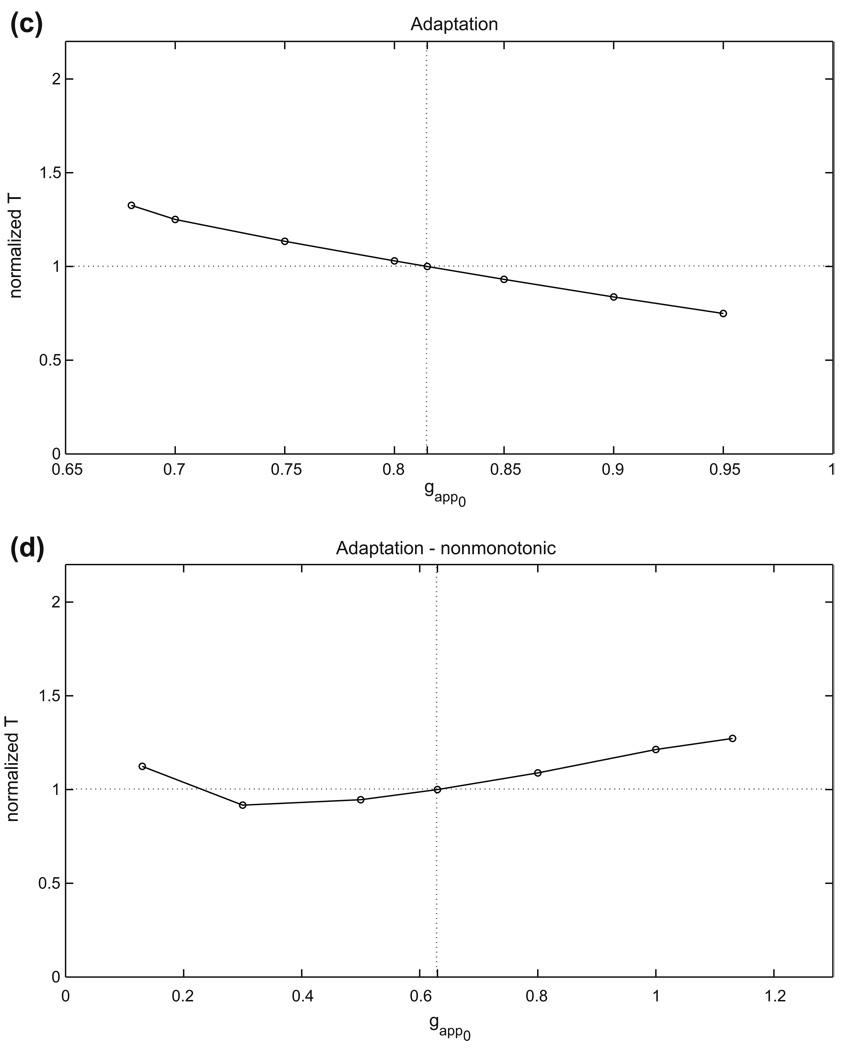
For each half-center oscillation mechanism, an example of the basic, or reference, periodic orbit that exists when both cells receive the same, baseline drive is shown in Fig. 2. We refer to this as the balanced case. When the conductance gapp of the baseline drive current to both cells is varied, by an amount that is not too great, each periodic half-center solution will persist, although the period will change. If the drive is changed enough, then the number of stable states may change, and the periodic oscillation itself may be lost. We did not explore additional branches of solutions, but rather focused on the single branch of oscillations that we followed from a baseline value of gapp. For this branch, we computed how the half-center oscillation period varies over a range of gapp for each case. We display the results in Fig. 4 and summarize them in Table 1. Here, gapp0 is defined as the midpoint of the range of gapp over which oscillations were observed, the relative gapp range is given by the total range divided by gapp0, the relative T range is given by the maximal period minus the minimal period, divided by the period T0 occurring at g = gapp0, and ΔT/Δgapp is the relative T range divided by the relative gapp range.
Fig. 4.
The periods of the basic periodic orbits shown in Fig. 2 change with changes in drive to both cells. Half-center oscillations based on (a) persistent sodium, (b) postinhibitory rebound, (c) adaptation, case 1, (d) adaptation, case 2
Table 1.
Changes in oscillation periods and drive conductances in the balanced case
| gapp0 | Relative gapp range | Relative T range | ΔT/Δgapp | |
|---|---|---|---|---|
| Persistent sodium | 0.235 | 0.383 | 1.28 | 3.34 |
| Postinhibitory rebound | 0.05 | 1.80 | 0.197 | 0.110 |
| Adaptation, case 1: | 0.815 | 0.331 | 0.576 | 1.74 |
| Adaptation, case 2: | 0.63 | 1.59 | 0.356 | 0.224 |
In brief, while the postinhibitory rebound mechanism yields oscillations over the greatest relative range of gapp values, the persistent sodium mechanism shows the greatest relative range of periods as well as the greatest sensitivity of period to changes in drive conductance. These characteristics are typical of half-center oscillator models exhibiting transitions due to release and escape, respectively.
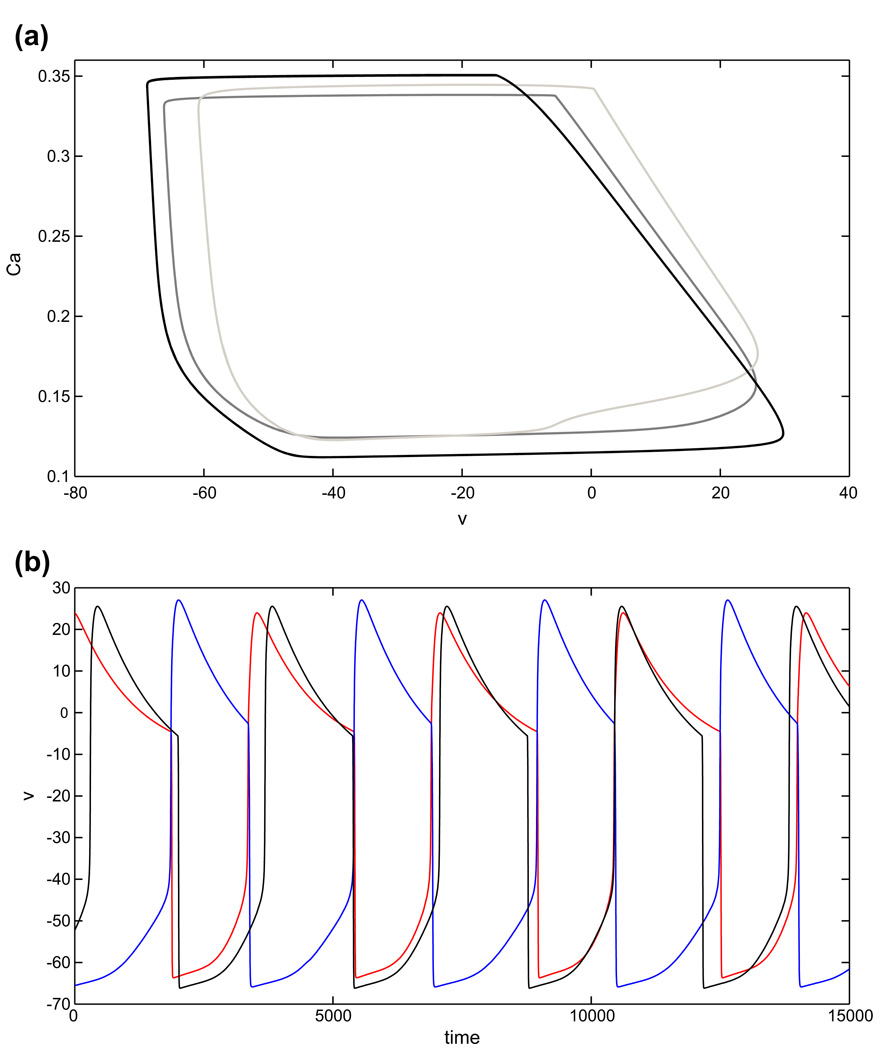
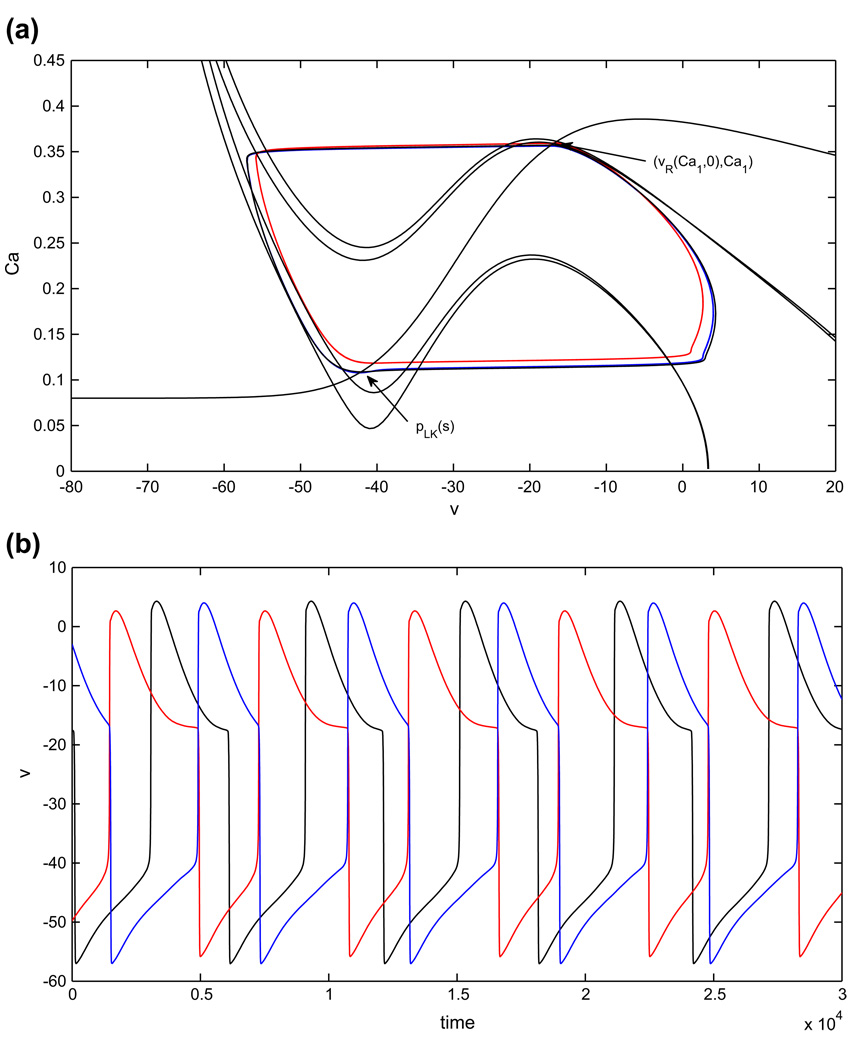
Note from Fig. 4 that the two different adaptation cases that we consider show monotone and non-monotone relationships of oscillation period to gapp, respectively. In case 1, the dominant effect of increasing gapp is that the left knee of each nullcline is raised, due to the fact that the silent phase, but not the active phase, lies far from the excitatory synaptic reversal potential. In case 2, we have changed the excitatory reversal potential as well as the synaptic threshold and maximal synaptic conductance smax. For relatively small gapp, phase transitions require substantial decay of the inhibitory conductance s. Thus, each cell jumps up to high υ, with small Ca, and periods are long (Fig. 5(a)). Increases in gapp induce two effects, both tied to the fact that the υ-nullcline shifts up for each fixed s. As in case 1, the rise in the left knee of the υ-nullcline promotes earlier phase transitions. Additionally, however, the new excitatory reversal potential allows a more significant change in the active phase, such that at each (Ca, s), the active cell has larger υ. Coupled with the voltage-dependence of s indicated in Eq. (2), this effect leads to stronger inhibition to the silent cell and also delays adaptation, thereby promoting longer active phase durations and period. As seen in Fig. 4, the former effect dominates for small increases in gapp, while the latter takes over as gapp increases further, leading to a non-monotone dependence of period on gapp.
Fig. 5.
Periodic oscillations in case 2 of the adaptation model. (a) Periodic orbits for gapp1 = gapp2 = 0.13 (black), gapp1 = gapp2 = 0.3 (dark grey), gapp1 = gapp2 = 0.7 (light grey), with balanced drive. (b) Time courses for periodic oscillations in the balanced (black) and asymmetric (cell 1 (red), with increased drive, and cell 2 (blue)) cases
In the subsequent subsections, we consider what happens if the drive to just one cell is increased, for each half-center oscillation mechanism. We refer to this situation as the asymmetric case. Without loss of generality, we assume that cell 1 receives the additional drive, corresponding to gapp1 > gapp2. Note that all variables that describe the dynamics of cell 1 are marked with the Λ–symbol to distinguish these variables from the ones describing the dynamics of cell 2, the cell receiving baseline drive. For each half-center oscillation mechanism introduced in Section 2, we assume that there exists a periodic half-center oscillation (in the singular limit, at least) and we establish sufficient conditions for this type of solution to persist as drives become asymmetric. First, we consider how the silent and active phase durations for each cell change as a result of the increase in drive to one cell.
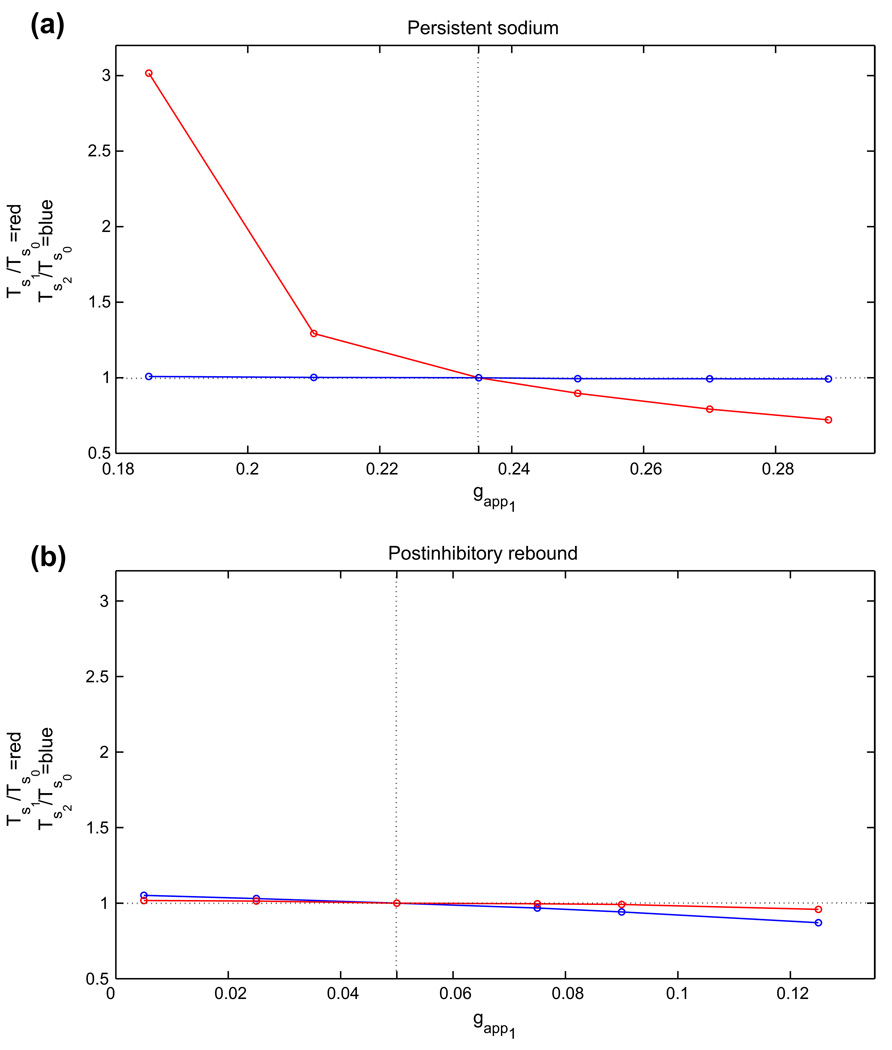
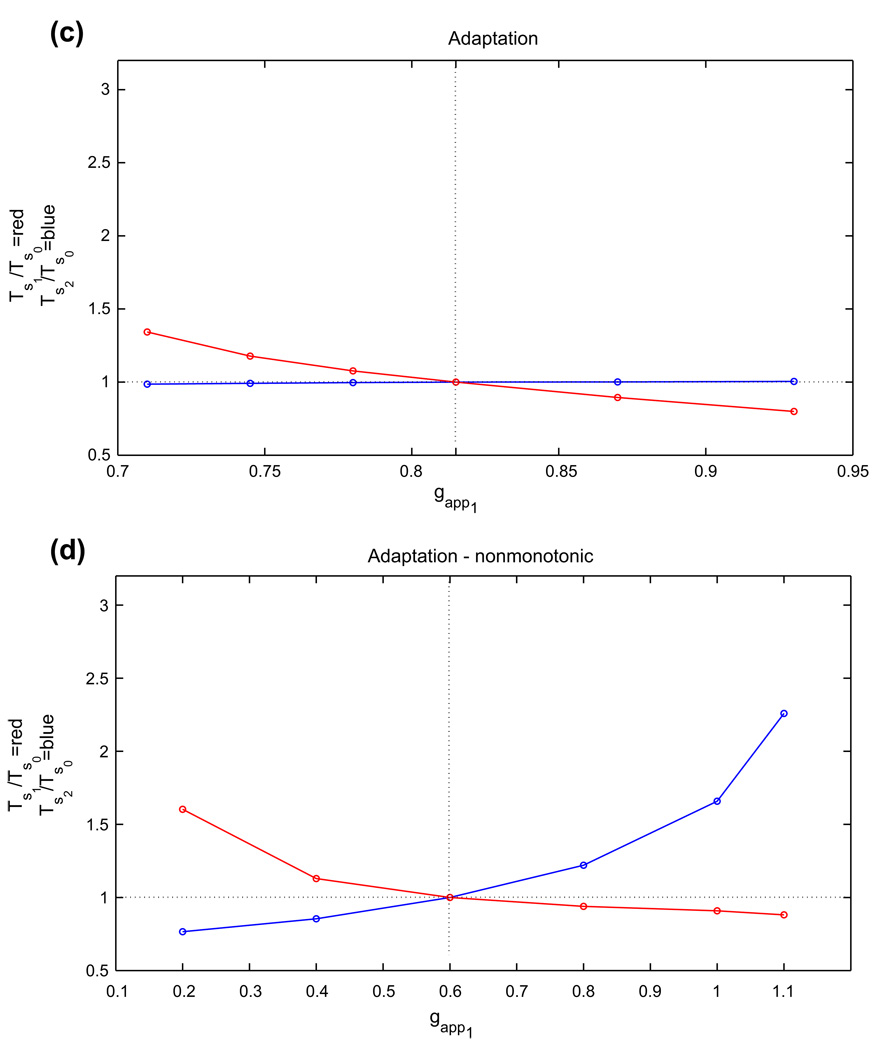
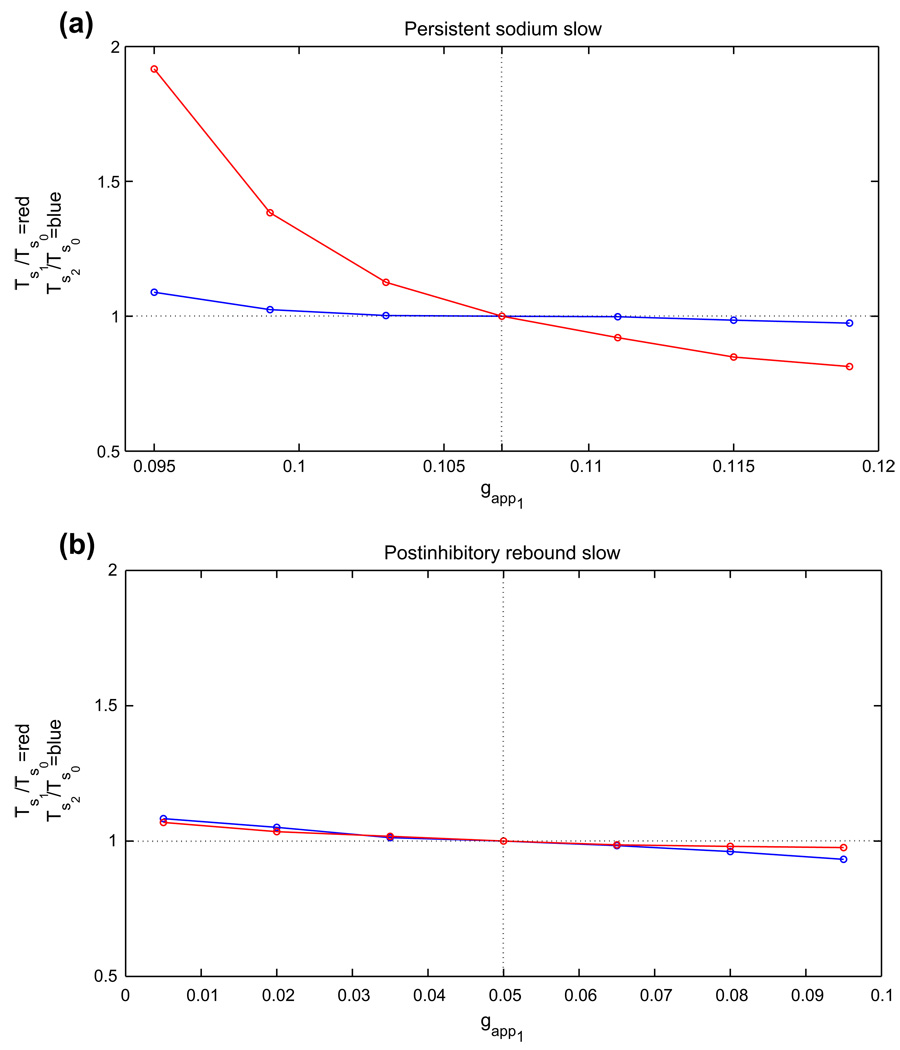
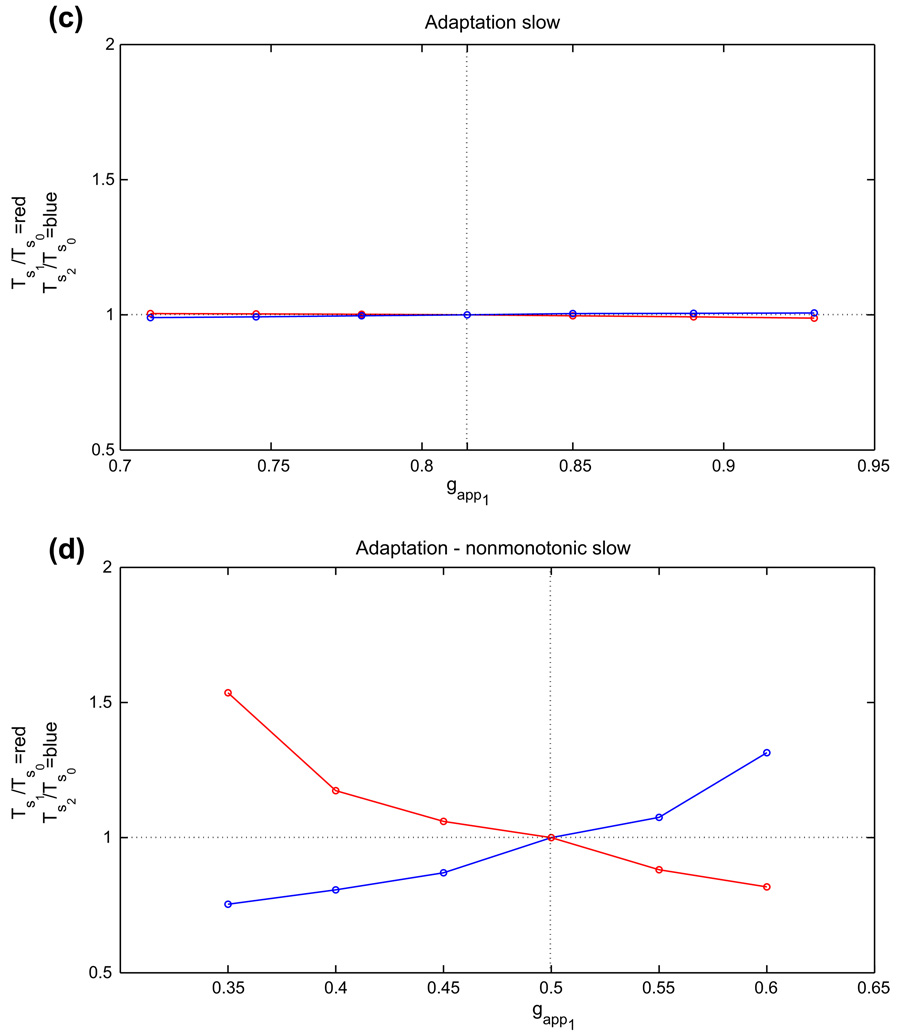
Figure 6 illustrates the changes in silent phase durations observed numerically for several values of gapp1 in the four analyzed cases. More specific quantitative findings are presented in Table 2. To generate this table, we defined the relative range of gapp1 as the range of gapp1 over which oscillations were maintained, divided by gapp0, the midpoint of the interval of gapp over which periodic oscillations exist in the balanced case (also equal to the drive to cell 2 here). Moreover, we defined the relative range of TS1 (TS2) as the range of silent phase durations for cell 1 (cell 2) divided by TS0, the silent phase duration for both cells with gapp1 = gapp2 = gapp0. Finally, ΔTS1/ΔT denotes the observed range of TS1 divided by the range of oscillation periods, which represents a measure of the phase independence, or degree to which changes in period are attributable to changes in silent phase duration for the oscillator receiving extra drive. Note that oscillations are maintained over the greatest relative range of drive asymmetries in the postinhibitory rebound model, while the greatest range of phase durations achieved by changes in drive to cell 1 is observed in the persistent sodium model, specifically in the silent phase duration for cell 1. Crucially, the persistent sodium model displays the greatest capacity for independent phase modulation, exhibiting strong changes in the silent phase duration of cell 1 and negligible changes in the silent phase duration of cell 2 when the drive to cell 1 alone is modulated; the adaptation model in case 1 displays a rather high degree of phase independence as well, although it achieves a more limited range of oscillation periods.
Fig. 6.
Changes in silent phase durations with changes in gapp1, the drive to cell 1. In each plot, gapp2 was held fixed at gapp0, the baseline drive for the corresponding model (dotted vertical line), and gapp1 was varied above and below that level. TS1 and Ts2 denote the resulting silent phase durations of cells 1 and 2, respectively, and Ts0 denotes the silent phase duration with gapp1 = gapp2 = gapp0. Half-center oscillations based on (a) persistent sodium, (b) postinhibitory rebound, and (c) adaptation, case 1, (d) adaptation, case 2
Table 2.
Changes in drive conductances and silent phase durations in the asymmetric case (rel abbreviates relative)
| gapp0 | Rel gapp1 range | Rel TS1 range | Rel TS2 range | ΔTS1/ΔT | |
|---|---|---|---|---|---|
| Persistent sodium | 0.235 | 0.438 | 2.30 | 0.0167 | 0.993 |
| Postinhibitory rebound | 0.05 | 2.40 | 0.0582 | 0.181 | 0.243 |
| Adaptation, case 1 | 0.815 | 0.270 | 0.544 | −0.0187 | 1.04 |
| Adaptation, case 2 | 0.63 | 1.43 | 0.722 | −1.49 | 0.624 |
Finally, Table 3 qualitatively summarizes the changes in silent and active phase durations for cells 1 and 2 shown in Fig. 6. In Table 3, the number of symbols in each entry in Table 1 corresponds to the relative strength of the effect. Note that, consistent with the results with balanced drive, case 1 of adaptation represents an intermediate case between the persistent sodium model and a strong adaptation regime, represented by case 2 (see also Subsection 3.3 and Section 4).
Table 3.
Qualitative summary of the observed changes in phase durations
| Cell 1 silent | Cell 2 silent | |
|---|---|---|
| Persistent sodium | − − − − − | − |
| Postinhibitory rebound | − | − − |
| Adaptation case 1 | − − − | + |
| Adaptation case 2 | − − − | ++++ |
In the subsequent subsections of Section 3, we analyze the mechanisms underlying the results in Table 2, Table 3 and Fig. 6. In the process, we list particular properties present in each case, which are sufficient to give qualitatively similar effects. Some of these properties depend on whether transitions between phases are initiated through escape, release, or some combination of these mechanisms, and we discuss these distinctions further in Section 4. Other properties relate to details of nullcline configurations and effects of parameter variations that exist in the models we consider.
3.1 Half-center CPG based on persistent sodium current
Recall that for the persistent sodium half-center oscillator, phase transitions occur when the cell from the silent phase reaches the appropriate left knee and escapes by jumping up to the active phase, inhibiting the cell that is already there. For the balanced case gapp1 = gapp2, the single condition (11) suffices to give the existence of a stable half-center oscillation. Condition (11) ensures that when the active cell becomes inhibited, it immediately jumps down to the silent phase.
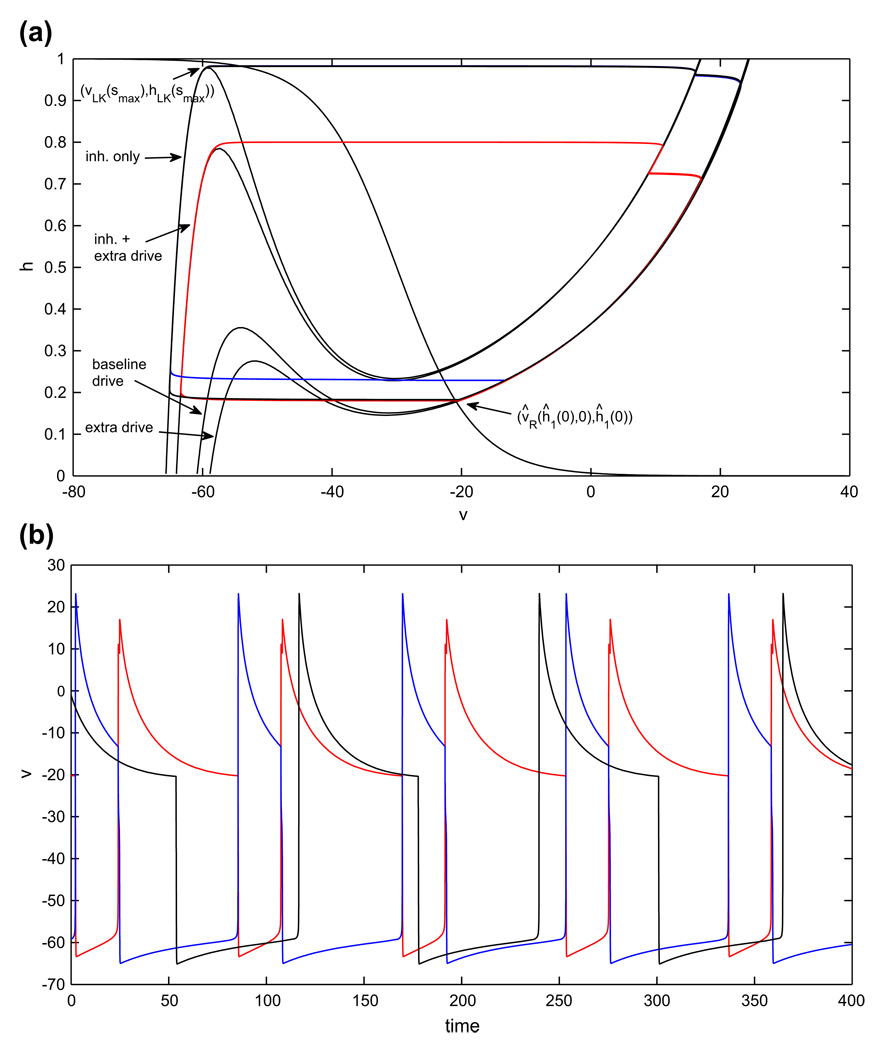
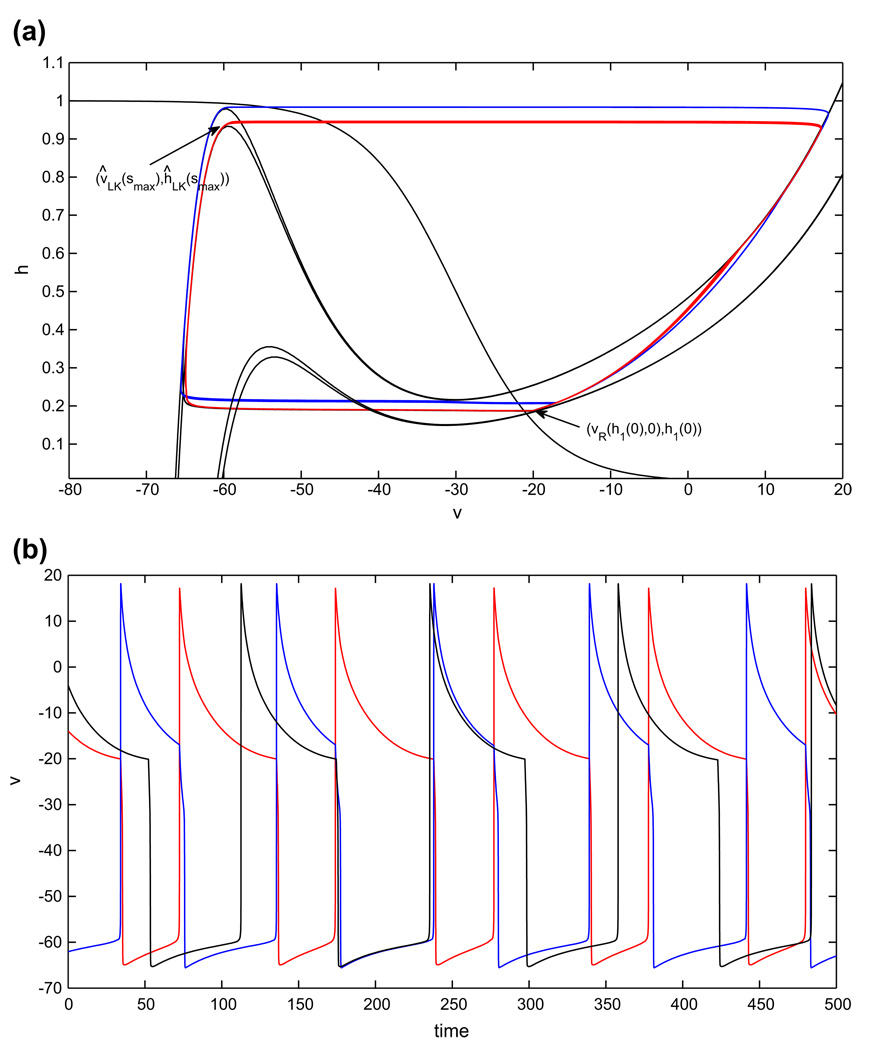
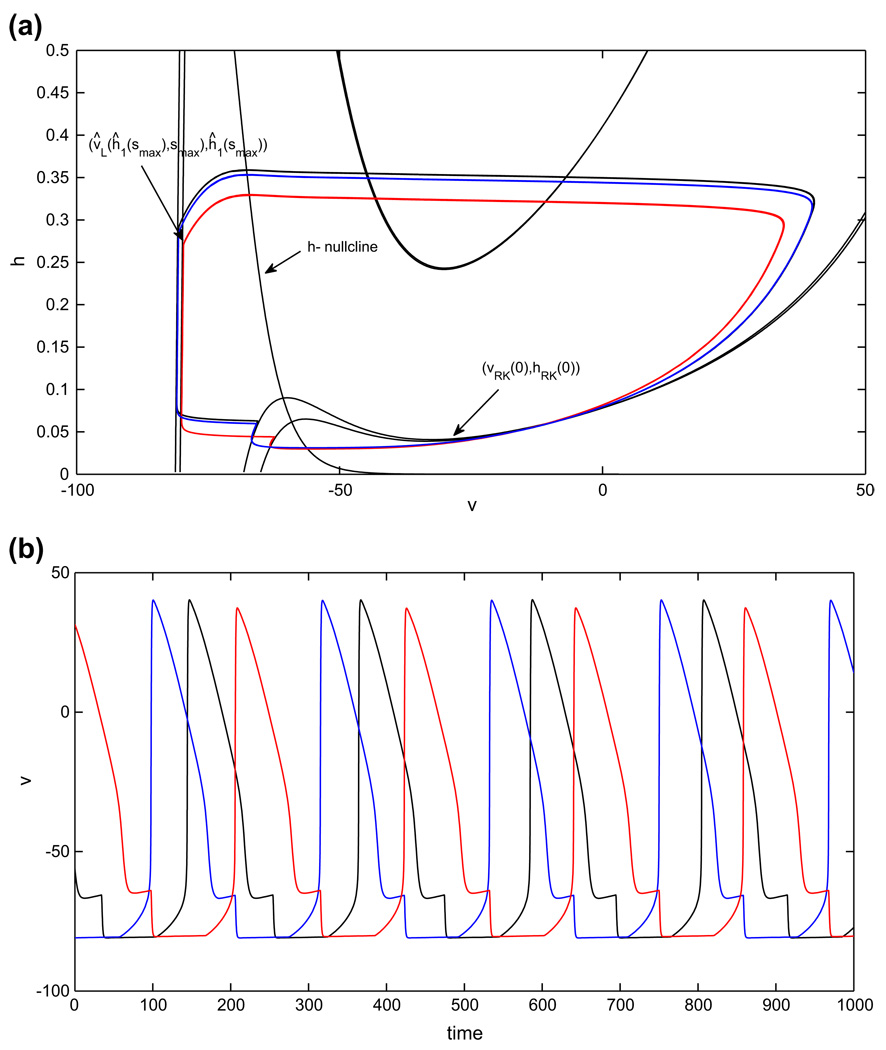
As shown in Fig. 7, once gapp1 > gapp2, there are four nullclines to consider for the coupled pair of cells. Nonetheless, if gapp1 is not increased too much, then both cells have critical points in the active phase in the absence of coupling (lower nullclines in Fig. 1), corresponding to sustained tonic spiking, and the phase switches still occur by escape, when each silent cell reaches its left knee and jumps up.
Fig. 7.
Periodic oscillations in the model with persistent sodium, in the asymmetric case. An increase in the drive to cell 1 (red) decreases the duration of its silent phase and therefore the duration of the active phase of cell 2 (blue). The duration of the active phase of cell 1, and therefore the duration of the silent phase of cell 2, is only slightly affected. (a) Phase plane orbits. (b) Voltage time courses. Note that inh. stands for inhibition
Recall that we will use the symbol Λ to label structures defined for extra drive and no extra symbol to label baseline drive structures. In tracking cells during time, note that ĥ1(0), h2(0) refer to the cells’ h–coordinates at time t = 0, while hx(0), ĥx(0) for x ∈ {LK, RK, FP} refer to the h–coordinates of various structures with inhibition s = 0. Suppose the cell with the extra drive (cell 1) starts in the active phase at (υ̂R(ĥ1(0), 0), ĥ1(0)) and the other cell (cell 2) starts in the silent phase at (υLK (smax), hLK(smax)), poised to jump up (see Fig. 7(a)). We can assume that ĥ1(0) > ĥFP(0), since (υ̂ FP(0), ĥFP(0)) is a fixed point on the right branch of the appropriate nullcline. Cell 1 will jump down when cell 2 jumps up as long as ĥ1(0) < ĥRK(smax). Thus, the minimum time that cell 1 spends in the silent phase is the time of evolution from {h = ĥRK(smax)} to {h = ĥLK(smax)} under the flow of Eq. (9), call it .
Similarly, when cell 1 jumps up, the relevant range of values for the h–coordinate of cell 2, call it , over which cell 2 can jump down is (hFP(0), hRK(smax)). Thus, one condition for the existence of a periodic half-center oscillation, in the singular limit, is is the time of evolution from {h = hLK(smax)} to {h = hRK(smax)} under the flow of Eq. (10). Further, the minimum time that cell 2 spends in the silent phase is the time of evolution from {h = hRK(smax)} to {h = hLK(smax)} under the flow of Eq. (9), call it . When cell 2 jumps up, cell 1 will be able to jump down as long as is the time of evolution from {h = ĥLK(smax)} to {h = ĥRK(smax)} under the flow of Eq. (10). In summary, the existence of a singular, periodic half-center oscillation when gapp1 > gapp2 follows from a pair of conditions, , that are the natural generalization of Eq. (11).
Next, we consider how the durations of various phases change as gapp1 is increased. First, note that in this half-center oscillation, the silent (active) phase of cell 1 coincides with the active (silent) phase of cell 2. Thus, there are really only two changes to consider. Second, note that the key to understanding these changes is understanding how changes in gapp affect the υ-nullcline. We now list several properties of the υ-nullcline, specifically some effects on the υ-nullcline achieved by varying gapp. To understand this discussion, recall from our original, general system of Eq. (1) that F(υ, h, s) denotes dυ/dt (without loss of generality, we set Cm = 1). We now refer to this quantity as F(υ, h, s, gapp), to make explicit the role of gapp. Similarly, the branches of the υ-nullcline can be expressed as υX (h, s, gapp) for X ∈ {L,M, R}.
-
(E1)An increase in gapp1 causes the υ-nullcline for cell 1 to shift to a lower h value for each fixed υ < 0, and to a higher h value for each fixed υ > 0, since we assume that the synaptic drive current reverses at υapp = 0. Importantly, the size of the shift is proportional to υ − υapp = υ. Thus, the greatest effects of the increase appear in the silent phase, where we also have
(17) -
(E2)
Implicit differentiation of F(υL(h, s, gapp), h, s, gapp) = 0 yields ∂υL/∂h = −(∂F/∂h)/(∂F/∂υ). Moreover, ∂F/∂h=−gNaPm∞(υL)(υL−υna) on the left branch, where m∞(υL) is small, due to the deactivation of INaP. Hence, away from the left knee, where ∂F/∂υ = 0, we have that |∂υL/∂h| is small. Correspondingly, large shifts in the υ-nullcline in the h direction due to changes in gapp are translated into much smaller changes in υL.
-
(E3)Instead of expressing the υ-nullcline as υL ∪ υm ∪ υR, we can instead express it as the graph of a function hn, where F(υ, hn(υ, s, gapp), s, gapp) = 0. The knees of the υ-nullcline satisfy
(18) In particular, the left knee is given by (υLK(s, gapp), hLK(s, gapp)), where υLK(s, gapp) is one solution of Eq. (18) and hLK(s, gapp) = hn(υLK(s, gapp), s, gapp). Thus,Since the knees are exactly the points where ∂hn/∂υ = 0 and ∂υLK/∂gapp is finite, this equation gives ∂hLK/∂gapp = ∂hn(υLK, s, gapp)/∂gapp. Direct calculation yields(19) Now, the numerator in Eq. (19) is bounded well above zero, since in the silent phase, including the left knee, υ is significantly below zero. The denominator, however, is negative and small, reflecting the deactivation of INaP in the silent phase. Hence, the h-coordinate of the left knee decreases significantly as gapp increases.
We also append one additional hypothesis to this list of effects.
-
(H3)
With baseline drive, hLK ≈ h∞(υLK).
Assuming (H1) – (H2), effects (E1) – (E3) follow for the half-center model based on persistent sodium current. Qualitatively similar properties would arise for any half-center model for which phase transitions occur by escape that is driven by the slow deinactivation of an inward current. From these effects and (H3), we can deduce the temporal impact of changing gapp1. Recall that we previously used h̄1 to denote the initial h-coordinate of cell 1, in the active phase in the half-center oscillation that we proved exists in the balanced drive case. Let h1(t) denote the h-coordinate of cell 1 along this balanced half-center oscillation, with h1(0) =h̄1. Suppose that in the asymmetric case, at time t = 0, the h-coordinate of cell 1 lies at h̄1 as well, and let ĥ1(t) denote the h-coordinate of cell 1 in the ensuing solution, also assuming, as previously, that at time 0, cell 2 lies at (υLK(smax), hLK(smax)). We will compare ĥ1(t) to h1(t). In a nutshell, we will note that when gapp1 is increased, one effect pushes h1(t) above ^h1(t) while another does the reverse, but these effects are weak. Beyond these, the dominant effect of increasing gapp1 is, as stated in (E3), that hLK is significantly decreased, which leads to a much shorter silent phase duration for cell 1 relative to the silent phase duration TS of both cells in the balanced case.
To establish all of these claims, we first note that if we let time flow in the asymmetric case from the initial configuration just described (Fig. 7(a)), then cell 1 jumps down immediately as long as gapp1 − gapp2 is not too large, since cell 2 instantly jumps up and inhibits cell 1. Cell 1 evolves on the left branch {υ = υ̂L(h, smax)} under Eq. (9), since it receives extra drive. Since Eq. (17) holds, υL(h, smax) < υ̂L(h, smax) for each fixed h, including h = h̄1. Hence, h∞(υL(h, smax)) > h∞(υ̂L(h, smax)) for fixed h. Thus, for small t > 0 at least, ḣ1(t) > ĥ̇1(t) and h1(t) > ĥ1(t) follows.
This initial calculation hints that increased drive may lead to a longer residence time in the silent phase. However, this effect is quite small. Indeed (E2) implies that large shifts in the υ-nullcline in the h direction, corresponding to the size of ∂hn/∂gapp = −υ/(gnapm∞(υ)(υ − υna)), are rescaled into much smaller shifts in υL for each fixed h away from the knee, including h = h̄1. Moreover, another small effect works to oppose this small one. Since ∂hn/∂gapp < 0 from the above expression, it follows that if h1(t) gets too far ahead of ĥ1(t), such that υ1(t) = υ̂1(t), then ĥ̇1(t) > ḣ1(t), and the lead of h1(t) over ĥ1(t) will decrease.
Because the total effect of these factors is weak, the dominant impact of increasing gapp1 is its effect on the left knee, presented in (E3). That is, since ∂hLK/∂gapp is negative and has large magnitude, the net effect of increasing gapp1 is that is significantly shorter than TS. This means that cell 1 spends a shorter time in the silent phase, and correspondingly cell 2 spends a shorter time in the active phase, in the asymmetric drive case.
The shorter active phase residence implies that cell 2 jumps down with . Thus, even though cell 2 evolves according to Eq. (9) in the silent phase, exactly as in the balanced drive case, its silent phase residence time satisfies . We note, however, that the difference between and TS is very small. The small size of this change follows from two effects. First, assume that the existence conditions for the periodic half-center oscillation hold, such that , and that hFP(0) is close to hRK(smax), as in Fig. 7. These assumptions constrain fairly tightly the position of h2 at jump-down. Second, assume that property (H3) holds, as also shown in Fig. 7. Under this assumption, the rate of change of h2 becomes quite slow when cell 2 is in the neighborhood of the left knee in the silent phase, and the time is dominated by the time spent in this neighborhood, which washes out small differences in jump up positions.
Finally, repeating the above arguments yields a sequence of successively shorter silent phase durations for each cell. Both sequences must converge, if the existence conditions for a half-center oscillation are satisfied. If (H1) – (H3) hold and these conditions are satisfied, then effects (E1) – (E3), which emerge without further assumptions in the escape-driven half-center oscillation mechanism, represented by the model featuring the persistent sodium current, imply that the silent phase duration for cell 1 (and active phase duration for cell 2) ends up much shorter than in the balanced drive case, due predominantly to the change in knee positions specified in (E3), while the silent phase duration for cell 2 (and active phase duration for cell 1) is only very slightly decreased (see Fig. 7(b)).
3.2 Half-center CPG based on postinhibitory rebound
For the postinhibitory rebound half-center oscillator, phase transitions occur when the cell from the active phase reaches the appropriate right knee and jumps down into the silent phase, releasing the cell that is already there to jump up into the active phase. For the balanced case gapp1 = gapp2, the single condition (12) suffices to give the existence of a stable half-center oscillation. Condition (12) ensures that when the silent cell becomes released, it immediately jumps up to the active phase.
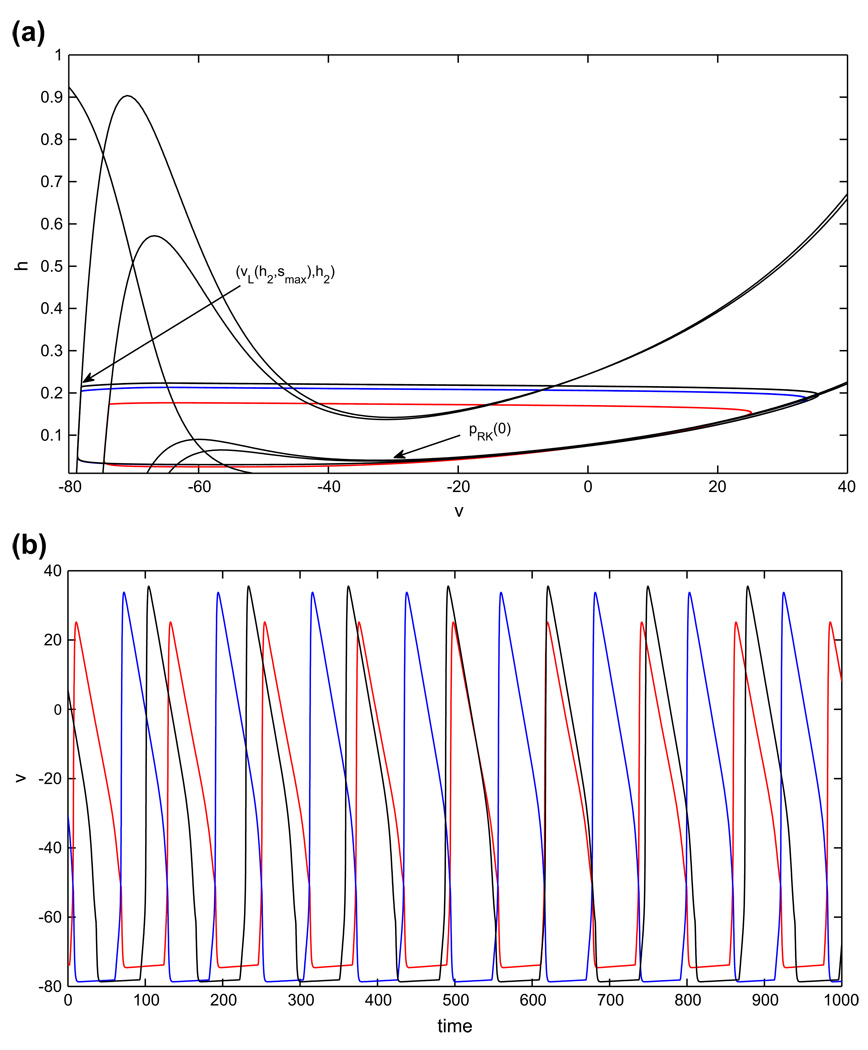
As shown in Fig. 8(a), once gapp1 > gapp2, there are four nullclines to consider for the coupled pair of cells. Nonetheless, if gapp1 is not increased too much, then both cells have critical points in the silent phase in the absence of coupling, and the phase switches still occur when each active cell reaches its right knee and jumps down, releasing the silent cell.
Fig. 8.
Periodic oscillations in the model with postinhibitory rebound, in the asymmetric case. Both cell 1, with increased drive (red), and cell 2 have shorter active phases and therefore also shorter silent phases than in the balanced case. (a) Phase plane orbits. (b) Voltage time courses
As in Section 3.1, the existence of a singular, periodic half-center oscillation when gapp1 > gapp2 follows from a pair of conditions, , that are the natural generalization of Eq. (12). Here, is the time of evolution from {h = hLK(0)} to {h = hRK(0)} under the flow of Eq. (10), is the time of evolution from {h = ĥRK(0)} to {h = ĥLK(0)} under the flow of Eq. (9), is the time of evolution from {h = ĥLK(0)} to {h = ĥRK(0)} under the flow of Eq. (10), and is the time of evolution from {h = hRK(0)} to {h = hLK(0)} under the flow of Eq. (9).
Next, we consider how the durations of various phases change as gapp1 is increased. We will explain why the silent and active phases of both cells become shorter, but not much shorter, for our biologically relevant parameter set, as seen in Fig. 8. As in Section 3.1, we list several properties of the υ–nullcline, including some effects on the υ–nullcline achieved by varying gapp. The postinhibitory rebound case differs from the persistent sodium case in that the persistent sodium current INaP=gNaPm∞(υ)h(υ−eNa) is replaced by a T–type calcium current IT =gTm∞(υ)h(υ−υCa). Therefore, analogously to Section 3.1, we have ∂F/∂h = −gTm∞(υL)(υL − υca) with small m∞(υ) over the silent phase, and the following effects arise.
-
(E1)An increase in gapp1 causes the υ–nullcline for cell 1 to shift to a lower h value for each fixed υ < 0, and to a higher h value for each fixed υ > 0, with
(20) The size of the shift in the υ-nullcline is proportional to υ, such that ∂υR(h, gapp)/∂gapp is quite small for all relevant h.
-
(E2)
Large shifts in the υ-nullcline in the h direction due to changes in gapp are translated into smaller changes in υL.
-
(E3)
Based on calculations analogous to the derivation of Eq. (19) and the small size of (−υRK)/gTm∞(υRK)(υRK − υna) for each υRK(0, gapp), the h-coordinate of the left knee decreases significantly as gapp increases, while the h-coordinate of the right knee changes negligibly.
Assuming (H1) − (H2), effects (E1) − (E3) follow for the half-center model based on postinhibitory rebound. Qualitatively similar properties would arise for any half-center model for which transitions occur by release that is driven by the slow inactivation of an inward current, and completely analogous effects would also arise if the release were due to the activation of a slow outward current. We also assume that one additional hypothesis is satisfied, since this arises for the parameter regime that we consider in the model based on postinhibitory rebound.
-
(H3)
The fixed points lie on the steep part of the h–nullcline.
Now, assuming (H1) – (H3), let h1(t) denote the h–coordinate of cell 1 along the balanced half-center oscillation described in Section 2.4.2, with h1(0) = hRK(0). Suppose that in the asymmetric case, at time t = 0, the h-coordinate of cell 1 lies at hRK(0) as well, and let ĥ1(t) denote the h-coordinate of cell 1 in the ensuing solution. Assume that at time 0, cell 2 is at the same starting position we used in the existence argument in the balanced case, namely (υL(h2, smax), h2) for h2 ∈ [hLK(0), hFP(smax)]. Cell 1 jumps down when it reaches {h = ĥRK(0)}, which occurs almost immediately since (E3) implies ĥRK(0) ≈ hRK(0). The location of cell 2 implies that it jumps up instantly in response to the associated release from inhibition. In the silent phase, we have h^1(t) < h1(t) due to (E1). Because cell 2 receives no extra drive, it jumps down after essentially the same active phase duration TA present in the balanced case, with ĥ1(TA) < h1(TA). Thus, cell 1 enters the active phase at a smaller h than in the balanced case. Cell 1 jumps down from the active phase when ĥ1 = ĥRK(0). As noted above, (E3) implies that ^hRK(0) ≈ hRK(0). Hence, the active phase duration satisfies . As a result, cell 2 jumps down from a smaller h value than in the balanced case. Repeating the above arguments yields a sequence of successively shorter silent phase durations for each cell. Moreover, both sequences must converge, if the existence conditions for a half-center oscillation are satisfied.
Now, we have established that the durations of all phases of the oscillation become shorter when extra drive is applied to one cell in the postinhibitory rebound case, based on properties that are generally present in half-center oscillations driven by release. We now explain why these changes are, in fact, quite small (e.g., see Fig. 8(b)). The changes observed are all linked to the fact that, given the same starting h–coordinate in the silent phase, a cell receiving extra drive reaches a smaller h before release from inhibition than a cell receiving baseline drive. There are four possible effects that could squelch this difference, and three of them are observed for our system. The first possibility is that the fixed point in the silent phase lies at similar h–values as gapp varies and jump up occurs near the fixed point. But this is not observed here, by (H3); indeed, (H3) helps ensure that the changes in phase durations are non-negligible. Given that the fixed points are at quite different values, the second and third possible effects both follow from the fact that the rate of change of h is sufficiently faster in the active phase than in the silent phase. This difference means that the cells jump up from positions far below their respective fixed points, before they have time to spread out substantially. It also implies that differences in h at jump up translate into very small differences in time spent in the following active phase. We observe both of these effects (see Fig. 8). Finally, (E2) helps bound the differences in rate of change of h in the silent phase between the cells with and without extra drive, although this is not a strong factor for our postinhibitory rebound model.
3.3 Half-center CPG based on neuronal adaptation
For the balanced half-center oscillator based on adaptation, phase transitions occur when the inhibition to the cell in the silent phase has decreased enough so that the cell reaches the appropriate left knee and jumps up to the active phase, inhibiting the cell that is already there. Note that such transitions rely on a combination of release, achieved by the decrease in inhibition before each transition, and escape, in that the immediate cause of each transition is that the silent cell reaches a left knee and jumps up to the active phase. For the balanced case gapp1 = gapp2 , the conditions (15), (16) suffice to give the existence of a stable half-center oscillation. These conditions ensure that the inhibition weakens sufficiently that the cell in the silent phase is able to reach the curve of left knees pLK(s) and that when the active cell becomes inhibited, it immediately jumps down to the silent phase. As in Subsection 2.4.3, we focus on case 1. This choice is motivated by the fact that the case 1 model is more similar to the persistent sodium model than is case 2. Hence, the differences between case 1 and persistent sodium that we illustrate will be even stronger between case 2 and persistent sodium (see Table 1), by completely analogous arguments.
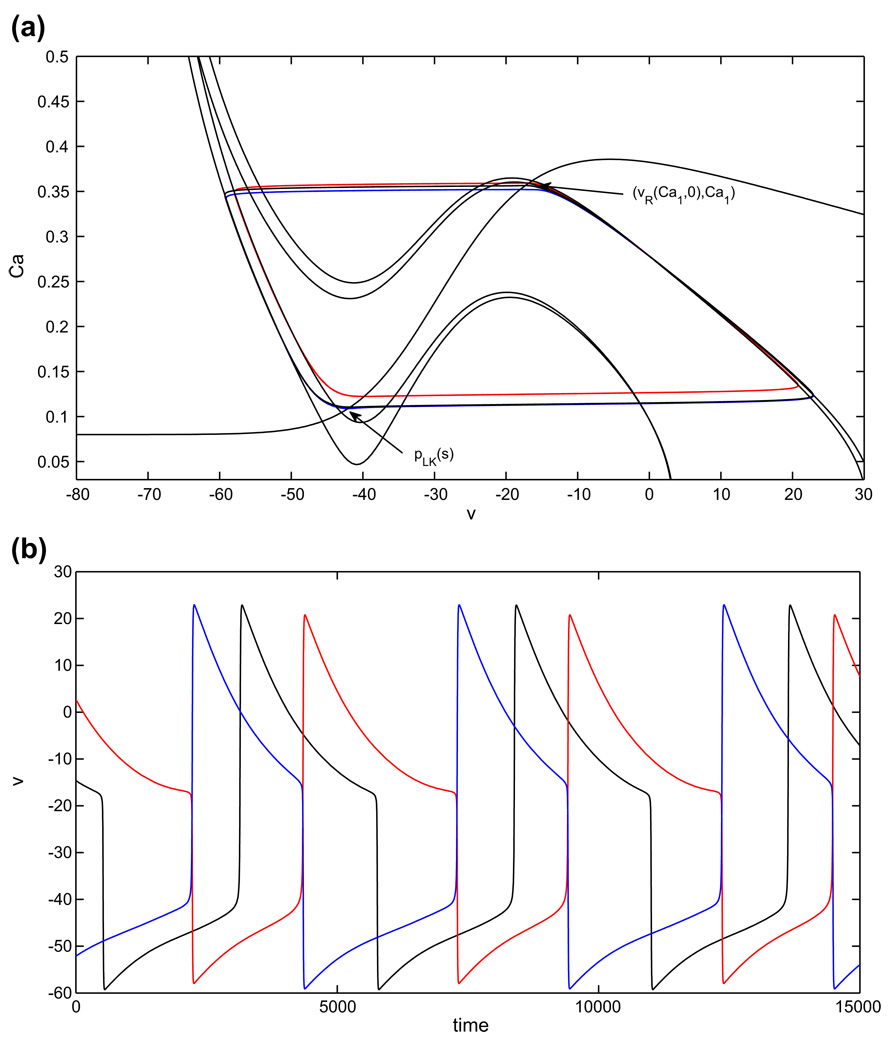
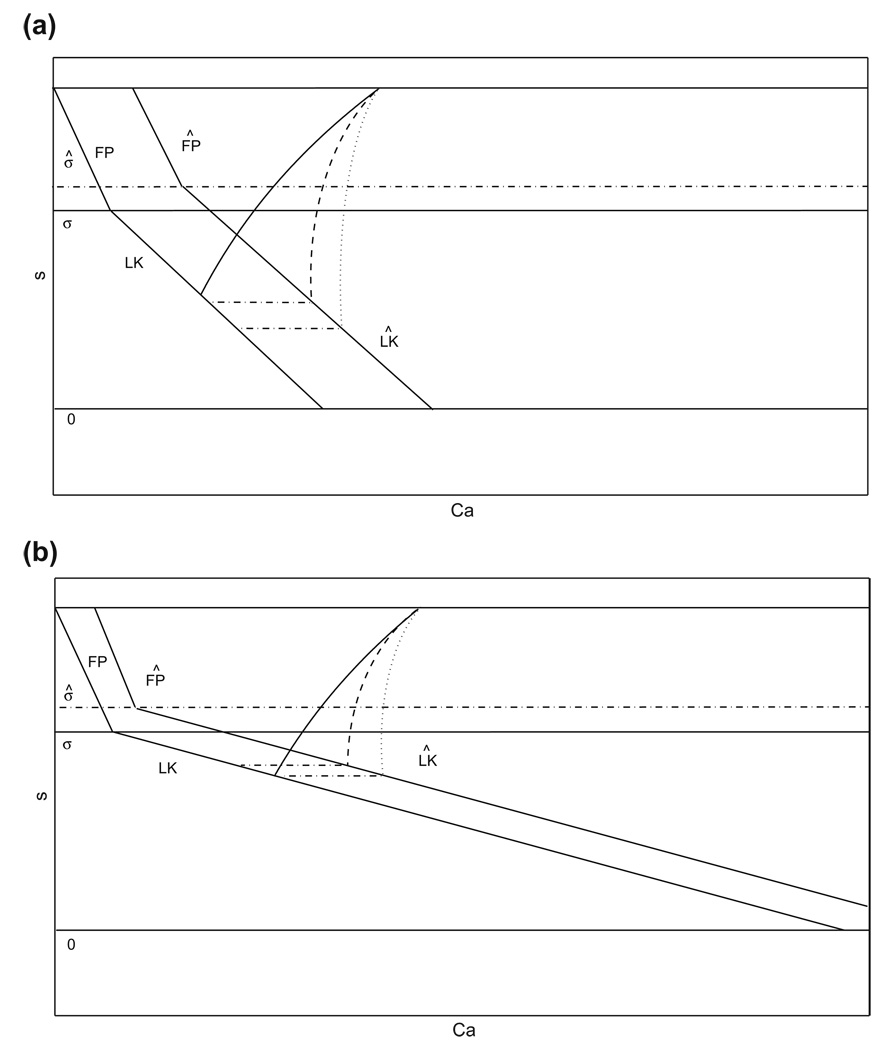
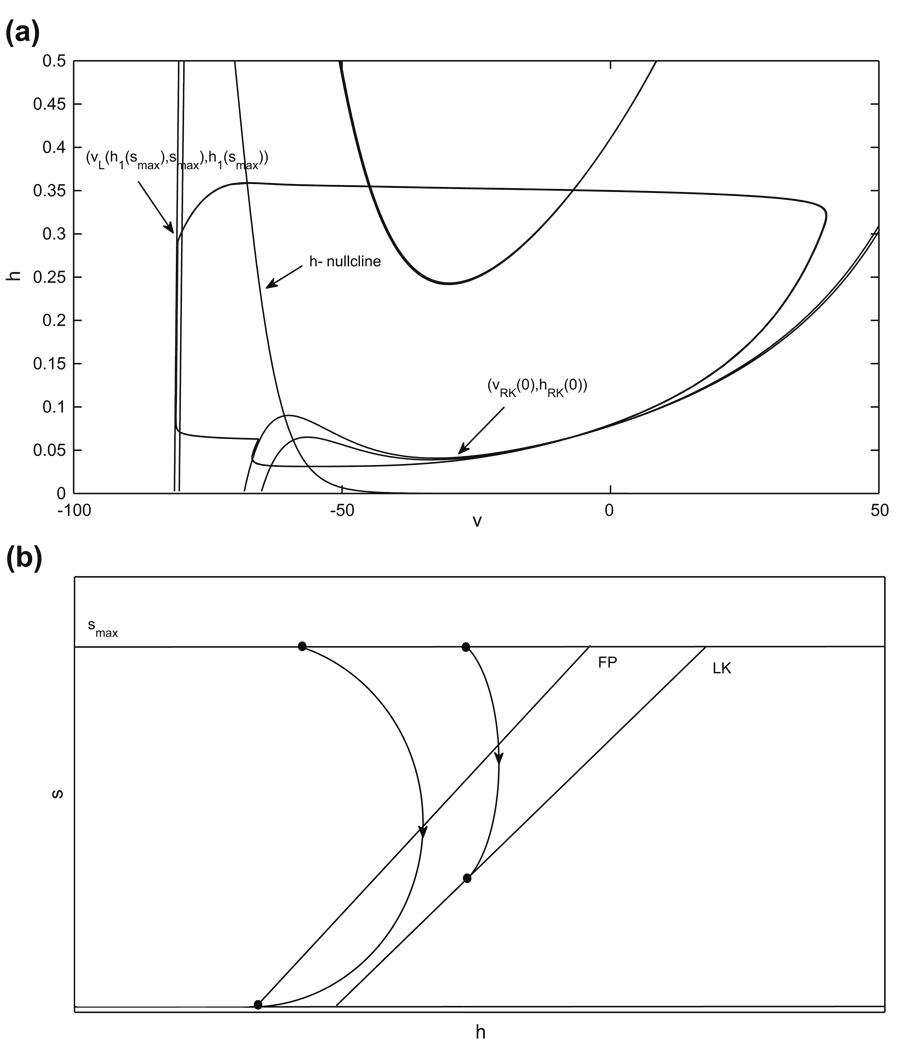
As shown in Fig. 10, once gapp1 > gapp2, there are four nullclines to consider for the pair of coupled cells. If gapp1 is not increased too much, then both cells have critical points in the silent phase in the absence of coupling, and the phase switches still occur when each cell reaches its left knee and escapes to the active phase. The shifts in the nullclines yield intervals of Ca values ÎL, from which jump up from the silent phase occurs immediately, and ÎR, from which jump down from the active phase occurs immediately upon the onset of sufficiently strong inhibition. These are analogous to IL, IR in Subsection 2.4.3 (see also Fig. 3). The shifts also imply that the s–value at which the curves of fixed points and left knees intersect switches from σ to a new value σ̂; see Fig. 9. In the case with gapp1 > gapp2, establishing the existence of a singular periodic solution requires that both of the jumping conditions are met both when cell 1 is silent and cell 2 is active and vice versa. The arguments in Subsection 2.4.3 generalize immediately to imply that the solution exists if two pairs of conditions are met. The first pair of conditions are
where s(Ca), are given by evaluating Eq. (13) at υR(Ca, 0) and , respectively. The second pair of conditions are
where T̂ terms denote evolution times for the cell with extra drive.
Fig. 10.
Periodic oscillations in the model with adaptation (case 1), with asymmetric drive. Extra drive to cell 1 (red) causes it to have a shorter silent phase and longer active phase, while cell 2 (blue), with baseline drive, has a shorter active phase and longer silent phase, correspondingly. (a) Phase plane orbits. (b) Voltage time courses
Fig. 9.
(Ca, s) phase plane for the adaptation model. The structures (curves of fixed points, FP, and left knees, LK) defined when drive is increased are labeled with the Λ symbol; σ, σ̂ denote the s values at which FP and LK intersect with baseline and increased drive, respectively. The duration of the silent phase is dependent on how Ċa and CaLK change with gapp, as well as on |∂CaLK/∂s|. (a) A small |∂CaLK/∂s| promotes a long silent phase, with relatively high sensitivity to changes in Ċa (dashed and dotted curves), seen as large changes in the s-value at which the trajectory reaches with changes in Ċa. (b) A large |∂CaLK/∂s| promotes a short silent phase, with relatively low sensitivity to changes in Ċa (dashed and dotted curves), seen as small changes in the s-value at which the trajectory reaches with changes in Ċa
Next, we consider how the durations of various phases change asgapp1 is increased. As in Sections 3.1 and 3.2 we want to understand how changes in gapp1 affect the υ–nullcline. Analogously to the previous sections, we catalog a set of effects that gapp has on the υ–nullcline. To do this, we now write dυ/dt = F(υ, Ca, s, gapp), to make explicit the role of gapp. Similarly, the branches of the υ–nullcline can be expressed as υX(Ca, s, gapp) and ^υX(Ca, s, gapp) for X ∈ {L, M, R}, depending on the level of drive.
-
(E1)
An increase in gapp1 causes the υ-nullcline for cell 1 to shift to a higher Ca value for each fixed υ < 0, and to a lower Ca value for each fixed υ > 0. The size of the shift is proportional to υ − υapp = υ. Thus, the greatest effects of the increase appear in the silent phase, where we also have ∂υL(Ca, s, gapp)/∂gapp > 0.
-
(E2)
Large shifts in the υ–nullcline in the Ca direction due to changes in gapp are translated into smaller changes in υ.
-
(E3)
The Ca–coordinate of the left knee increases significantly as gapp increases.
We append four additional hypotheses to this list of effects.
-
(H3)
The Ca–nullcline intersects the inhibited υ–nullclines on their left branches υL(Ca, s, gapp) for s sufficiently large. Therefore, the cell in the silent phase is not able the reach the left knee when it is maximally inhibited. Correspondingly, phase switching is not achieved purely by escape but rather by a mixture of escape and release, the latter of which occurs through a decay of synaptic strength due to the evolution of the cell in the active phase. Note that despite this second intersection, we use (υFP, CaFP), (υ̂FP, ĈaFP) to denote the fixed point on the right branch of the uninhibited nullcline for the baseline and extra drive cases, respectively.
-
(H4)
|∂CaLK/∂s| is sufficiently large.
-
(H5)
Adaptation of the active cell becomes significant only near its fixed points (i.e., θs in Eq. (2) is near υFP).
-
(H6)
The fixed points satisfy υFP < υapp, and the Ca–nullcline is not too steep where they occur.
Below, we clarify what is meant by (H4) and (H6).
Assuming (H1) – (H2), effects (E1) – (E3) follow. We now deduce the temporal effects of changing gapp1. Qualitatively, the cells still follow trajectories in the (Ca, s) plane that are similar to those in Fig. 3(a), although the relevant range of Ca for cell 1 shifts as discussed above. Assume that at time 0, cell 2 lies at its jump up point from the balanced case, (υLK (s), CaLK(s)) for some s ∈ (0, smax), and cell 1 lies at its jump down point from the balanced case, with . Cell 2 jumps up and evolves under Eq. (10) along the same path it followed in the balanced case until cell 1 jumps up again. We consider how the length of time needed for this to occur compares to the balanced silent phase duration TS. Since cell 2 follows the same path as in the balanced case, s2 behaves as previously, decaying by (H3). Thus, the relation of can be assessed by comparing the decay of s2 to that occurring in the balanced case.
The comparison depends on how Ċa and CaLK change with gapp as well as on |∂CaLK/∂s|, as illustrated in Fig. 9. By (E1) and the form of the equations in system (5), Ca1 evolves more slowly than in the balanced case, which promotes a long silent phase (e.g., dotted curves in Fig. 9). However, this is not a strong effect, by (E2). On the other hand, (E3) implies that CaLK increases significantly with gapp for each s, which prevents the silent phase from becoming too long and could potentially even shorten it. Finally, a large |∂CaLK/∂s|, as assumed in (H4), also promotes a shorter silent phase, as shown in Fig. 9. In sum, while the effect is weak due to the slower evolution of Ca1 in the silent phase relative to the balanced case, cell 1 will jump up from a larger Ca1, with s2 at a larger value as well, which implies that the silent phase will be shorter than TS under (H1) − (H4); see Fig. 9(b). We next show that cell 1 jumps down at similar Ca in both cases, such that these arguments persist beyond the first oscillation cycle. To do this, we continue to follow cell 1 beyond its jump up to the active phase. As we just showed, the jump up occurs at a larger Ca than in the balanced case, which could promote a shorter active phase. By (H3), however, the cell in the active phase must reach a sufficiently large Ca for adaptation to become significant and release the silent cell. Moreover, by (H5), this release requires the active cell in each case to reach a small neighborhood of its fixed point, which compresses the difference in Ca. Finally, a key point is that by (H6), and υ̂FP > υFP. The latter inequality implies that s1 will adapt more slowly in the asymmetric case than in the balanced case, causing cell 2 to spend a longer time in the silent phase. If the Ca–nullcline were very steep at the fixed point, then the difference υ̂FP − υFP would be very small in magnitude. Under (H6), this difference is more significant, although it may still be quantitatively small, ensuring that this is the dominant effect in determining the phase duration. Moreover, (H6) also implies that CâFP − CaFP is small and hence cell 1 jumps down from a similar Ca–value in both cases, as claimed
Figure 10 illustrates the adaptation case with increased gapp1 when (H1) − (H6), and hence (E1) − (E3), hold. The jump down point of the reference orbit (balanced case, black) is close to the critical point. Figure 10 shows that the duration of the silent phase of cell 1 and therefore the active phase of cell 2 is shorter compared to the asymmetric case. The duration of the active phase of cell 1 and therefore the duration of the silent phase of cell 2 is prolonged.
In case 2, stronger adaptation effects are needed for a phase transition to occur. Thus, the switch to case 2 corresponds to a boost in the importance of release, relative to escape, in transitions between phases. (H3), (H5), and (H6) ensure that these effects translate into an additional lengthening of the active phase of cell 1 (Table 2 and Table 3).
3.4 Slow synaptic decay
In the previous sections, we analyzed the effect of increasing gapp1 when synaptic decay occurs on the fast timescale. Our results carry over directly when synaptic decay occurs on the slow timescale. Slow synaptic decay is modelled by assuming β = O(ε) in systems Eq. (3) and Eq. (4). This assumption implies that smax = 1 in the singular limit, but we will continue to refer to smax for consistency with previous sections.
Figure 11 illustrates the changes in silent phase durations for cell 1 and 2 for several increased values of gapp1 in the model systems that we consider, with slow synaptic decay. The results are qualitatively identical to those in Fig. 6. In some cases, the effect of changing gapp is quantitatively weaker when the synaptic decay is slow, and the range of gapp1/gapp2 over which half-center oscillations exist may be reduced. In Fig. 13(a), Fig 14(a), and Fig 16(a) below, the baseline drive nullclines and the extra drive nullclines are closer together than in the fast synaptic decay cases due to correspondingly smaller choices of gapp.
Fig. 11.
Changes in silent phase durations dependent on increased drive to cell 1 (drive to cell 2 has not been changed) in the persistent sodium, postinhibitory rebound and the two adaptation cases with slow decay of inhibition. In each plot (a–d), gapp2 was held fixed at gapp0, the baseline drive for the corresponding model (dotted vertical line), and gapp1 was varied above and below that level. TS1 and Ts2 denote the silent phase durations of cell 1 and 2, respectively and Ts0 denotes the silent phase duration of the basic periodic orbits shown in Subsection 2.2
Fig. 13.
Periodic oscillations in the model with persistent sodium, with slow synaptic decay and asymmetric drive. An increase in the drive to cell 1 (red) decreases the duration of its silent phase and therefore of the active phase of cell 2 (blue). The silent phase of cell 2 and thus the active phase of cell 1 do not decrease significantly. (a) Phase plane orbits. (b) Voltage time courses
Fig. 14.
Periodic oscillations in the model with adaptation (case 1), with slow synaptic decay and asymmetric drive. As in the fast synaptic decay case, an increase in the drive to cell 1 (red) decreases its silent and increases its active phase duration, with corresponding changes in the phase durations of cell 2 (blue). (a) Phase plane orbits. (b) Voltage time courses
Fig. 16.
Periodic oscillations in the model with postinhibitory rebound, with slow synaptic decay and asymmetric drive. An increase in the drive to cell 1 (red) slightly decreases its silent and active phase durations and changes the phase durations of cell 2 (blue) correspondingly. (a) Phase plane orbits. (b) Voltage time courses
The mechanisms that contribute to the observed changes in phase durations are similar across synaptic decay rates. The analysis, however, becomes more complicated when synapses decay slowly. The simplest aspect to analyze is the existence of a periodic singular bursting solution with gapp1 = gapp2 in the persistent sodium model, which we consider here. Suppose cell 1 starts at (υR(h1(0), 0), h1(0)), with h1(0) ∈ [hFP(0), hRK(smax)], and cell 2 starts at (υLK(smax), hLK(smax)); see Fig. 12(a). Cell 2 jumps up to the right branch of the inhibited υ–nullcline, to (υR(hLK(smax), smax), hLK(smax)). Cell 1 is inhibited by cell 2 and jumps down to the silent phase, because h1(0) ∈ [hFP(0), hRK(smax)]. While cell 2 evolves in the active phase, the inhibition to cell 2 slowly decays to a value, say ρ, during the time, say Td, that cell 1 needs to reach the left knee and jump up into the active phase. Cell 2 is able to jump down to the silent phase if the inhibition decays fast enough so that its corresponding h–value, h2(ρ), lies in the interval [hFP(ρ), hRK(smax)]. Figure 12(b) illustrates the decay of inhibition to cell 2 in the slow phase plane.
Fig. 12.
Periodic oscillations in the model with persistent sodium, with slow synaptic decay and with balanced drive. (a) Basic period orbit. (b) Slow phase plane for the active phase
Although there are two slow variables in the active phase, both cells always jump up with h = hLK(smax) and s = smax. Thus, the cells always enter the active phase with the same initial conditions and correspondingly follow the same 1-d trajectory (h(t), s(t) = smaxe−βt) in the active phase. Since this trajectory is monotone in both components, we can express s = s(h) along it. The shortest possible time that a cell will spend in the silent phase is TS(hRK(smax)), the time of evolution of h from hRK(smax) to hLK(smax) under the flow of Eq. (9). Analogously to the previous sections, the existence of a periodic singular solution is guaranteed if
where the former is the evolution time from (hLK(smax), smax) to (hRK(smax), s(hRK(smax))) under the flow of
The above analysis shows that because the dynamics of the decay of s is independent of the evolution of h and the phase transition is governed by the cell in the silent phase, the slow decay of s has minimal impact on the half-center oscillation. Indeed, although we omit the details, the same factors as discussed in Subsection 3.1 yield a shorter silent phase of cell 1 and only a negligible change in the silent phase duration of cell 2 when gapp1 > gapp2, as shown in Fig. 13.
Analysis with slow synaptic decay in the other models is more complicated. In the adaptation model, recall from Subsection 3.3 that the jump up required crossing a curve of left knees, parameterized by s, in the silent phase. Slow synaptic decay introduces slow dynamics of s, which implies that the level of s is no longer strictly slaved to the voltage of the active cell. Slow synaptic decay continues in the active phase as well, introducing continuous variation of the position of the nullcline on which each cell evolves when active, but this is a more minor effect since s only weakly affects nullcline position in the active phase; see Fig. 14.
In the postinhibitory rebound case, the slow decay of inhibition also influences how cells jump up from the silent phase, as shown in Fig. 15. Moreover, as with adaptation, the decay of inhibition continues to be a factor while each cell is active. The existence of a periodic half-center oscillation in the balanced case with slow synaptic decay can be analyzed using a map approach as in previous sections, and in fact similar analysis has been done previously (e.g., Rubin and Terman 2000). Introducing extra drive, with gapp1 > gapp2, complicates the precise arguments, but again, the relevant mechanisms remain those discussed in Subsection 3.2, and the effects on oscillation period are qualitatively similar to those observed with fast decay; see Fig. 16.
Fig. 15.
Periodic oscillations in the model with postinhibitory rebound, with slow synaptic decay and balanced drive. (a) Basic period orbit in the (υ, h)phase plane. (b) Slow phase plane. Whether the cell in the silent phase is able to reach the curve of left knees depends on the relative rates of change of its h–coordinate and of the inhibition it receives
4 Discussion
We have considered the generation of oscillations in three reduced half-center CPG models with distinct intrinsic dynamics and phase transition mechanisms. One of these models features a persistent (slowly inactivating) sodium current, one is based on postinhibitory rebound, and one incorporates calcium-dependent adaptation. In the latter model, we considered two cases (case 1 and 2), the first of which is characterized by a decrease in oscillation period with an increase in drive to the CPG, and the second of which shows an increase in period with increase in drive. The objective of our study was to comparatively investigate the adaptability of each type of CPG in response to changes in drive and to establish how this adaptability depends on the intrinsic dynamical component incorporated in the CPG. Specifically, we have considered how the oscillation period in each model can be controlled by the external drives to both half-centers in the symmetrical regime (when these drives are equal) and how the duration of each phase of the oscillations can be controlled by changing the drive to one half-center (establishing an asymmetric regime). The mathematical analysis that we have given provides a specific accounting of the factors in the phase plane dynamics corresponding to each model that determine its responses to variations in drives, and how each factor contributes. The generality of this analysis ensures that any parameter set that maintains qualitatively similar dynamical features will yield similar outcomes, while more substantial parameter variations may change the structure of a model and alter the effects of drive modulation correspondingly.
As summarized in Table 1–Table 3, our results show that oscillations produced in the models based on postinhibitory rebound and on adaptation in case 2 share common traits. Both of these models show high stability, with half-center oscillations maintained over a large range of the drive conductance gapp when both cells receive the same drive and over a large ratio of the drive conductances to the two cells, defined by gapp1/gapp2, when drive levels differ. At the same time, both of these forms of intrinsic dynamics, and particularly postinhibitory rebound, yield insensitivity of period to gapp and an inability to independently tune the phase durations via asymmetric drive to the two half-centers, which would limit the adaptability of these CPG types. Importantly, in these two models, release from inhibition, in which the active cell initiates phase transitions, is either solely responsible for, or plays a key role in, phase transitions.
It may seem surprising that the CPG models based on persistent sodium current and postinhibitory rebound do not yield similar responses to drive modulation, since one cell is clearly in control of each switch between phases in each model, but in fact major differences arise between them. Phase transitions in the persistent sodium model occur through escape, rather than release. Escape arises when the silent cell reaches a point in phase space, namely the left knee of its υ-nullcline, from which it can jump to the active phase, whereas release occurs when the active cell reaches the right knee of its υ-nullcline and jumps to the silent phase (Skinner et al. 1994). In all models considered, these left and right knees lie at widely separated voltages. Since the effects of inhibitory coupling and of excitatory drive are scaled with postsynaptic voltage, and since current activation levels are also voltage-dependent in these models, changes in drive affect the locations of the two knees very differently. Thus, the different transition mechanisms they support, namely escape and release, lead to very different effects of drive modulation on phase durations and periods in these models. As is evident in Table 1–Table 3, oscillations based on persistent sodium exhibit the greatest sensitivity of period to gapp and achieve the largest range of periods, although they persist over a relatively small range of gapp. Moreover, with asymmetric drive, persistent sodium-based oscillations show the greatest range of phase durations and the highest independence in phase duration control.
Similar but weaker effects arise in case 1 of the adaptation model, where adaptation plays less of a role than in case 2. Indeed, since the models based on persistent sodium current and adaptation both feature fixed points in the active phase, it is appropriate to think of them as points on a continuum. That is, the persistent sodium-based model lies in an extreme position, with little or no change in the strength of the synaptic output from a cell while it is active, and with transitions occurring purely through escape. Moving along the continuum away from this extreme, by increasing the synaptic threshold for example, yields progressively more adaptation, or weakening of synaptic output during the latter stages of the active phase. This change corresponds to introducing a release component into phase transitions. Our case 2 of adaptation represents a point along this continuum that is farther away from the persistent sodium model than is our case 1, with release playing an important role in phase transitions. Case 2 yields a non-monotonic dependence of period on drive in the balanced drive regime, as observed by other authors (Shpiro et al. 2007; Skinner et al. 1993), reflecting a shift in the balance between escape and release as drive is varied (see also Curtu et al. 2008). The more extreme nature of case 2 is also evident in the stronger changes observed with asymmetric drives. More generally, different susceptibilities to drive modulation and different degrees of independent phase control would arise at different points along the continuum, interpolating between the cases that we have considered.
As noted in the Introduction, the specific intrinsic neural mechanisms involved in the generation of locomotor oscillations in most CPGs, especially in mammals, remain largely unknown. What is known is that these CPGs are extremely flexible and can adaptively adjust the oscillatory patterns they generate to the motor demands they face. This flexibility includes the ability to generate oscillations with a wide range of frequencies, combined with independent regulation of each phase duration under the control of descending drives, even in the absence of phasic afferent feed-back (e.g., as seen in fictive locomotion, McCrea and Rybak 2007; Yakovenko et al. 2005). If we assume that the structure and operation of at least some biological CPGs (e.g., the spinal locomotor CPG) can, in a simplified sense, be represented by a half-center model, then it is important to elucidate what dynamic mechanisms could potentially provide this flexibility. Since the precise features involved in the operation of most CPGs are unknown, we felt that it was reasonable to comparatively investigate different half-center models, incorporating different intrinsic dynamic mechanisms, with a particular focus on how different components yield different responses to changes in drive. In particular, previous numerical simulations (Rybak et al. 2006) have demonstrated that a half-center model of the spinal CPG based on the dynamics of the persistent sodium current can reproduce the full range of locomotor periods and phase durations observed during fictive and treadmill locomotion in cats. This computational model, however, has not been theoretically investigated in detail, and CPG models based on other intrinsic mechanisms have not been previously studied in the context considered here, namely their operation in regimes of asymmetric drive. Here we have shown that the persistent sodium current-based half-center CPG model achieves a greater range of oscillation periods with changes in the drives to both half-centers than other typical half-center models considered. Moreover, this model provides a unique possibility for the independent control of each phase duration in the asymmetric regime attained by changing drive to only one half-center. These findings provide additional support for the possibly important role of persistent sodium current-dependent mechanisms in the operation of biological CPGs, and especially in the operation of the spinal locomotor CPG.
One set of previous studies that have considered frequency control and asymmetry within a half-center CPG system has made use of dynamic clamp technology to generate hybrid systems composed of a biological neuron synaptically coupled to a simulated neuron (Olypher et al. 2006; Sorensen et al. 2004). In particular, it was recognized that independent phase regulation could be achieved by modulation of the time constant of a slow current or the conductance of a particular ionic current, in one cell within a half-center system with an adaptation-type phase transition mechanism (Olypher et al. 2006). We have considered a more natural form of modulation, namely variation of the external drive to one cell, rather than its internal parameters. Nonetheless, given the ubiquity of neuromodulators in neuronal systems, it is likely that multiple modulatory mechanisms exist, which together enable control of oscillatory properties through effects on multiple targets.
Our analysis focused on reduced models, with each cell’s intrinsic dynamics represented in a two-dimensional phase plane and with spike onset via an Andronov-Hopf (AH) bifurcation. Unlike previous reduced models for CPGs and other rhythmic systems based on firing rate formalisms (Matsuoka 1987; Shpiro et al. 2007; Tabak et al. 2006; Taylor et al. 2002), however, the reduced models we consider are conductancebased, such that transition mechanisms and model parameters are connected directly to particular biological components. Such reductions are known to capture fundamental effects present in higher-dimensional models (e.g., Rubin 2006; Rubin and Terman 2002, 2004; Skinner et al. 1994; Somers and Kopell 1993) while allowing for analytical tractability. In particular, the addition of fast sodium and potassium currents associated with spike generation would have little qualitative impact on our results. More generally, it would be expected that more complex systems featuring escape-dominated transitions would respond to drive modulation similarly to the persistent sodium-based model considered here, those with release-dominated transitions would respond similarly to the postinhibitory-based model, and systems blending escape and release would exhibit responses between the extremes, as we have observed in the adaptation-based model. Similarly, because we consider oscillations in which the movement of one oscillator is restricted by a fixed point at each transition, reduced models with spike onset through a SNIC bifurcation instead of via an AH bifurcation would yield qualitatively similar results. There would likely be detail-specific variations across models, however, and future theoretical studies should examine how the results observed here are affected by the presence of additional currents observed in specific biological CPGs, as well as synaptic effects such as short-term synaptic plasticity (Tabak et al. 2006; Taylor et al. 2002), and how these results scale up to larger networks incorporating biologically relevant connectivity architectures and neuromodulatory pathways. Such extensions will elucidate further details about the mechanisms through which particular CPG units subserve different behaviors.
Acknowledgements
S. Daun received support from NIH grant R01 HL76137. J.E. Rubin received support from NSF award DMS 0716936. I.A. Rybak was supported by NIH grants RO1 NS048844 and RO1 NS057815.
Appendix
We summarize some central notation used in this paper in Table 4. In the following subsections, we list the auxiliary functions and parameter values used in the three example systems that we consider, as introduced in Section 2.2. The XPPAUT code for these systems is available at www.math.pitt.edu/~rubin/pub/CPGFILES/.
A.1 Model featuring the persistent sodium current (Butera et al. 1999)
The ordinary differential equations for the model featuring the persistent sodium current are
| (21) |
with associated functions
where Cm = 0.21, gnap = 10, gl = 2.8, ena = 50, el = −65, esyn = −80, θm = −37, σm = −6, θh = −30, σh = 6, ε = 0.01, θsyn = −43, σsyn = −0.1, gsyn = 1, gapp = 0.19, α = 1, and β = 1 (fast decay) or β = 0.08 (slow decay).
A.2 Model featuring postinhibitory rebound (Rubin and Terman 2004; Sohal and Huguenard 2002)
For the model featuring postinhibitory rebound, the relevant differential equations are
with associated functions
| (22) |
where gT = 4, υca = 90, θm = −40, σm = 7.4, θh = −70, σh = −4, θht = −50, σht = −3, gl = 0.4, υl = −70, t0 = 30, t1 = 200, gsyn = 1.4, υsyn = −85, θsyn = −35, σsyn = −0.1, gapp = 0.01, α = 1, and β = 1 (fast decay) or β = 0.05 (slow decay).
A.3 Model featuring adaptation (modified from Izhikevich 2006)
The model featuring adaptation is given by the differential equations
with associated functions
| (23) |
In case 1, Cm=21, gsyn=2, gapp=0.7, el=−55, θm=−34, σm=−5, ek=−85, gl=1, esyn=−70, k=1, τs=1 (fast decay) or τs=400 (slow decay), σsyn=−5, θsyn=−20, θca=−34, σca=−8.0, kca=22.5, ε =5e−05, kahp=0.7, υca=140, gahp=7, gca=0.05, gca1=1, and cabase=0.08. In case 2, the same parameters are used except gsyn = 6 (fast decay) or gsyn = 4 (slow decay), esyn = 50, k = 0.02 (fast decay) or k = 0.002 (slow decay), σsyn = −4, and θsyn = 20.
Contributor Information
Silvia Daun, Department of Mathematics, University of Pittsburgh, Pittsburgh, PA 15260, USA, rubin@math.pitt.edu.
Jonathan E. Rubin, Department of Mathematics, University of Pittsburgh, Pittsburgh, PA 15260, USA rubin@math.pitt.edu
Ilya A. Rybak, Department of Neurobiology and Anatomy, Drexel University, College of Medicine, Philadelphia, PA 19129, USA
References
- Brown T. The intrinsic factors in the act of progression in the mammal. Proceedings of the Royal Society of London Series B. 1911;84:308–319. [Google Scholar]
- Brown T. On the nature of the fundamental activity of the nervous centres; together with an analysis of the conditioning of rhythmic activity in progression, and a theory of the evolution of function in the nervous system. Journal of Physiology. 1914;48:18. doi: 10.1113/jphysiol.1914.sp001646. [DOI] [PMC free article] [PubMed] [Google Scholar]
- Butera R, Rinzel J, Smith J. Models of respiratory rhythm generation in the pre-Bötzinger complex. I. Bursting pacemaker neurons. Journal of Neurophysiology. 1999;81:382–397. doi: 10.1152/jn.1999.82.1.382. [DOI] [PubMed] [Google Scholar]
- Calabrese R. Half-center oscillators underlying rhythmic movements. In: Arbib M, editor. The handbook of brain theory and neural networks. Cambridge: MIT; 1995. pp. 444–447. [Google Scholar]
- Curtu R, Shpiro A, Rubin N, Rinzel J. Mechanisms for frequency control in neuronal competition models. SIAM Journal on Applied Dynamical Systems. 2008;7:609–649. doi: 10.1137/070705842. [DOI] [PMC free article] [PubMed] [Google Scholar]
- Grillner S. Neurobiological bases of rhythmic motor acts in vertebrates. Science. 1985;228:143–149. doi: 10.1126/science.3975635. [DOI] [PubMed] [Google Scholar]
- Grillner S. Biological pattern generation: The cellular and computational logic of networks in motion. Neuron. 2006;52:751–766. doi: 10.1016/j.neuron.2006.11.008. [DOI] [PubMed] [Google Scholar]
- Halbertsma J. The stride cycle of the cat: The modelling of locomotion by computerized analysis of automatic recordings. Acta Physiologica Scandinavica Supplementum. 1983;521:1–75. [PubMed] [Google Scholar]
- Harris-Warrick R. Pattern generation. Current Opinion in Neurobiology. 1993;3:982–988. doi: 10.1016/0959-4388(93)90171-t. [DOI] [PubMed] [Google Scholar]
- Izhikevich E. Dynamical systems in neuroscience: The geometry of excitability and bursting. Cambridge: MIT; 2006. [Google Scholar]
- Lafreniere-Roula M, McCrea D. Deletions of rhythmic motoneuron activity during fictive locomotion and scratch provide clues to the organization of the mammalian central pattern generator. Journal of Neurophysiology. 2005;94:1120–1132. doi: 10.1152/jn.00216.2005. [DOI] [PubMed] [Google Scholar]
- Lundberg A. Half-centres revisited. In: Szentagothai J, Palkovits M, Hamori J, editors. Regulatory functions of the CNS. Motion and organization principles. Budapest: Pergamon Akadem Kiado; 1981. pp. 155–167. [Google Scholar]
- Marder E. Motor pattern generation. Current Opinion in Neurobiology. 2000;10:691–698. doi: 10.1016/s0959-4388(00)00157-4. [DOI] [PubMed] [Google Scholar]
- Marder E, Bucher D. Central pattern generators and the control of rhythmic movements. Current Biology. 2001;11:986–996. doi: 10.1016/s0960-9822(01)00581-4. [DOI] [PubMed] [Google Scholar]
- Marder E, Bucher D, Schulz D, Taylor A. Invertebrate central pattern generation moves along. Current Biology. 2005;15:685–699. doi: 10.1016/j.cub.2005.08.022. [DOI] [PubMed] [Google Scholar]
- Marder E, Calabrese R. Principles of rhythmic motor pattern generation. Physiological Reviews. 1996;76:687–717. doi: 10.1152/physrev.1996.76.3.687. [DOI] [PubMed] [Google Scholar]
- Matsuoka K. Mechanisms of frequency and pattern control in the neural rhythm generators. Biological Cybernetics. 1987;56:345–353. doi: 10.1007/BF00319514. [DOI] [PubMed] [Google Scholar]
- McCrea D, Rybak I. Modeling the mammalian locomotor CPG: Insights from mistakes and perturbations. Progress in Brain Research. 2007;165:235–253. doi: 10.1016/S0079-6123(06)65015-2. [DOI] [PMC free article] [PubMed] [Google Scholar]
- Mischenko E, Kolesov Y, Kolesov A, Rozov N. Asymptotic methods in singularly perturbed systems. New York: Plenum; 1994. [Google Scholar]
- Olypher A, Cymbalyuk G, Calabrese R. Hybrid systems analysis of the control of burst duration by ed calcium current in leech heart interneurons. Journal of Neurophysiology. 2006;96:2857–2867. doi: 10.1152/jn.00582.2006. [DOI] [PubMed] [Google Scholar]
- Orlovskiĭ G, Deliagina T, Grillner S. Neuronal control of locomotion: From mollusc to man. Oxford: Oxford University Press; 1999. [Google Scholar]
- Rowat P, Selverston A. Modeling the gastric mill central pattern generator of the lobster with a relaxation-oscillator network. Journal of Neurophysiology. 1993;70:1030–1053. doi: 10.1152/jn.1993.70.3.1030. [DOI] [PubMed] [Google Scholar]
- Rubin J. Bursting induced by excitatory synaptic coupling in non-identical conditional relaxation oscillators or square-wave bursters. Physical Review E. 2006;74:021917. doi: 10.1103/PhysRevE.74.021917. [DOI] [PubMed] [Google Scholar]
- Rubin J, Terman D. Analysis of clustered firing patterns in synaptically coupled networks of oscillators. Journal of Mathematical Biology. 2000;41:513–545. doi: 10.1007/s002850000065. [DOI] [PubMed] [Google Scholar]
- Rubin J, Terman D. Geometric singular perturbation analysis of neuronal dynamics. In: Fiedler B, editor. Handbook of dynamical systems. Towards applications. vol. 2. Amsterdam: Elsevier; 2002. [Google Scholar]
- Rubin J, Terman D. High frequency stimulation of the subthalamic nucleus eliminates pathological thalamic rhythmicity in a computational model. Journal of Computational Neuroscience. 2004;16:211–235. doi: 10.1023/B:JCNS.0000025686.47117.67. [DOI] [PubMed] [Google Scholar]
- Rybak I, Shevtsova N, Lafreniere-Roula M, McCrea D. Modelling spinal circuitry involved in locomotor pattern generation: Insights from deletions during fictive locomotion. Journal of Physiology. 2006;577:617–639. doi: 10.1113/jphysiol.2006.118703. [DOI] [PMC free article] [PubMed] [Google Scholar]
- Selverston A, Moulins M. Oscillatory neural networks. Annual Review of Physiology. 1985;47:29–48. doi: 10.1146/annurev.ph.47.030185.000333. [DOI] [PubMed] [Google Scholar]
- Shpiro A, Curtu R, Rinzel J, Rubin N. Dynamical characteristics common to neuronal competition models. Journal of Neurophysiology. 2007;97:462–473. doi: 10.1152/jn.00604.2006. [DOI] [PMC free article] [PubMed] [Google Scholar]
- Sirota M, Shik M. The cat locomotion elicited through the electrode implanted in the mid-brain. Sechenov Physiological Journal of the USSR. 1973;59:1314–1321. [Google Scholar]
- Skinner F, Kopell N, Marder E. Mechanisms for oscillation and frequency control in reciprocally inhibitory model neural networks. Journal of Computational Neuroscience. 1994;1:69–87. doi: 10.1007/BF00962719. [DOI] [PubMed] [Google Scholar]
- Skinner F, Turrigiano G, Marder E. Frequency and burst duration in oscillating neurons and two-cell networks. Biological Cybernetics. 1993;69:375–383. [PubMed] [Google Scholar]
- Sohal V, Huguenard J. Reciprocal inhibition controls the oscillatory state in thalamic networks. Neurocomputers. 2002;4:653–659. [Google Scholar]
- Somers D, Kopell N. Rapid synchronization through fast threshold modulation. Biological Cybernetics. 1993;68:393–407. doi: 10.1007/BF00198772. [DOI] [PubMed] [Google Scholar]
- Sorensen M, DeWeerth S, Cymbalyuk G, Calabrese R. Using a hybrid neural system to reveal regulation of neuronal network activity by an intrinsic current. Journal of Neuroscience. 2004;24:5427–5438. doi: 10.1523/JNEUROSCI.4449-03.2004. [DOI] [PMC free article] [PubMed] [Google Scholar]
- Tabak J, O’Donovan M, Rinzel J. Differential control of active and silent phases in relaxation models of neuronal rhythms. Journal of Computational Neuroscience. 2006;21:307–328. doi: 10.1007/s10827-006-8862-7. [DOI] [PubMed] [Google Scholar]
- Taylor A, Cottrell G, Kristan W., Jr Analysis of oscillations in a reciprocally inhibitory network with synaptic depression. Neural Computation. 2002;14:561–581. doi: 10.1162/089976602317250906. [DOI] [PubMed] [Google Scholar]
- Tazerart S, Viemari J, Darbon P, Vinay L, Brocard F. Contribution of persistent sodium current to locomotor pattern generation in neonatal rats. Journal of Neurophysiology. 2007;98:613. doi: 10.1152/jn.00316.2007. [DOI] [PubMed] [Google Scholar]
- Wang X, Rinzel J. Alternating and synchronous rhythms in reciprocally inhibitory model neurons. Neural Computation. 1992;4:84–97. [Google Scholar]
- Yakovenko S, McCrea D, Stecina K, Prochazka A. Control of locomotor cycle durations. Journal of Neuroscience. 2005;94:1057–1065. doi: 10.1152/jn.00991.2004. [DOI] [PubMed] [Google Scholar]
- Zhong G, Masino M, Harris-Warrick R. Persistent sodium currents participate in fictive locomotion generation in neonatal mouse spinal cord. Journal of Neuroscience. 2007;27:4507. doi: 10.1523/JNEUROSCI.0124-07.2007. [DOI] [PMC free article] [PubMed] [Google Scholar]


