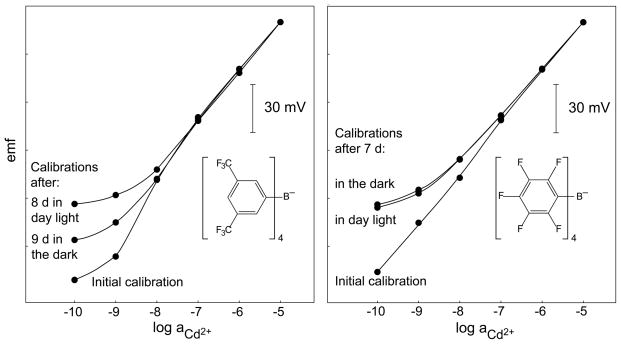
Fig. 10.
Calibration curves obtained in Cd(NO3)2 with 10−5 M NaNO3 as background electrolyte at pH 5.5 with two identical ISEs for each panel. The membranes contained tetrakis[3,5-bis(trifluoromethyl)phenyl]borate (TFPB−; left panel) or tetrakis(penta-fluorophenyl)borate (TpFPB−; right panel) as anionic sites. The inner solutions were 2.5 × 10⁻² M Et4NNO3 with 1.0 × 10⁻² M Cd(NO3)2 (18.8 % exchange of Cd2+ for Et4N+; left panel) and 1.45 × 10⁻² M Et4NNO3 with 1.0 × 10⁻² M Cd(NO3)2 (27.4 % exchange of Cd2+ for Et4N+; right panel). After recording the initial calibration curves, the ISEs were stored separately in 10−7 M Cd(NO3)2, one of each pairs in day light and the other in the dark, and then calibrations were made again.

