Abstract
Whole-body (WB) planar imaging has long been one of the staple methods of dosimetry, and its quantification has been formalized by the MIRD Committee in pamphlet no 16. One of the issues not specifically addressed in the formalism occurs when the count rates reaching the detector are sufficiently high to result in camera count saturation. Camera dead-time effects have been extensively studied, but all of the developed correction methods assume static acquisitions. However, during WB planar (sweep) imaging, a variable amount of imaged activity exists in the detector’s field of view as a function of time and therefore the camera saturation is time dependent. A new time-dependent algorithm was developed to correct for dead-time effects during WB planar acquisitions that accounts for relative motion between detector heads and imaged object. Static camera dead-time parameters were acquired by imaging decaying activity in a phantom and obtaining a saturation curve. Using these parameters, an iterative algorithm akin to Newton’s method was developed, which takes into account the variable count rate seen by the detector as a function of time. The algorithm was tested on simulated data as well as on a whole-body scan of high activity Samarium-153 in an ellipsoid phantom. A complete set of parameters from unsaturated phantom data necessary for count rate to activity conversion was also obtained, including build-up and attenuation coefficients, in order to convert corrected count rate values to activity. The algorithm proved successful in accounting for motion-and time-dependent saturation effects in both the simulated and measured data and converged to any desired degree of precision. The clearance half-life calculated from the ellipsoid phantom data was calculated to be 45.1 h after dead-time correction and 51.4 h with no correction; the physical decay half-life of Samarium-153 is 46.3 h. Accurate WB planar dosimetry of high activities relies on successfully compensating for camera saturation which takes into account the variable activity in the field of view, i.e. time-dependent dead-time effects. The algorithm presented here accomplishes this task.
1. Introduction
Whole-body (WB) planar imaging and quantification has long been one of the staple methods of dosimetry (Siegel et al 1999, Eary et al 1989, Thomas et al 1976, Jaszczak et al 1984), although more recently it has often been eschewed for, or combined with, single photon emission computed tomography (SPECT) and positron emission tomography (PET), supplemented by registration with a three-dimensional computed tomography (CT) images (Sgouros et al 2008, Koral et al 2003, Sjogreen et al 2002, He et al 2008). Nevertheless, the additional costs and increased demand on patient time of these more sophisticated imaging techniques means that two-dimensional imaging (from WB images) remains prevalent: currently, the majority of dosimetry is performed using planar imaging (Flux et al 2006).
Accurate dosimetry from WB planar images requires compensating for a wide range of physical processes, including scattering and attenuation as well as camera count rate saturation. Over the years, methodological adjustments and corrections to quantitative estimations of activity have been made for scatter correction (Jaszczak et al 1984, Siegel et al 1985, Delpon et al 2002a, Buvat et al 1995, Macey et al 1995) and attenuation (Thomas et al 1976, Bardies et al 1996, Sjogreen et al 2005). In spite of these corrections, absolute quantification in planar imaging remains somewhat controversial (Jonsson et al 2005, Hammond et al 1984, Leichner et al 1993), whereas relative quantification, i.e., determination of kinetic parameters, is considered to be more reliable (Sgouros et al 2008, Delpon et al 2002a) as the errors from scatter, septal penetration and attenuation generally cancel out from one time point to the next for the same imaged object. An issue which has not been satisfactorily addressed, however, is the dead-time correction in planar imaging.
While many studies exist with different methods for dead-time correction in static acquisitions (Sorenson 1975, 1976, Adams and Mena 1988, Zasadny et al 1993, Delpon et al 2002b, Chiesa et al 2009), the problem of varying activity in the detector field of view during acquisition has not been broached. Since the count rate varies as a function of the activity in the field of view, the correction factor during a whole-body scan will depend on the camera head position relative to the anatomical distribution of radioactivity. In patients with tumors that concentrate the radioactivity, large variations in activity distributions resulting in variable (i.e., bed-position-dependent) count rates may be expected; these must be accounted for in the saturation correction for a WB planar sweep image. This is especially important as dead-time is activity dependent, and, for a patient with multiple imaging sessions over time, will not affect each time point image equally. Consequently, the accuracy of the generally more reliable kinetics from WB imaging will be affected as well as the overall quantification.
We have developed and tested an algorithm to correct the measured count rate for deadtime effects for a relative motion between camera and imaged object. This algorithm is based on a static saturation curve, which we determined experimentally for our camera, assuming a paralyzable system. The theoretical basis for the extension of static saturation to variable count-rate saturation is presented, from which two algorithms are derived which interpret the theoretical count-rate saturation formalism. The first simulates the camera acquisition, used for simulation and validation of solutions; the second is the saturation correction algorithm proper which arrives at a solution using an adaptation of Newton’s method.
While a demonstration through a simple simulation does not require the choice of a particular isotope, application and validation of this algorithmic method by means of a phantom study does. We have chosen to use 153Sm as the radioactive quantity in our phantom study since the issue of proper camera saturation correction arose from studies of pediatric osteosarcoma patients undergoing 153Sm-EDTMP therapy (Loeb et al 2009). The conversion from count rate to activity in the phantom study made use of the classic antero-posterior MIRD formalism (Siegel et al 1999), with the inclusion of the build-up method for scatter compensation (Siegel et al 1985).
Results of the application of the correction algorithm from both the simulated data and the phantom study are presented; comparisons to non-corrected data are given, however no direct comparisons to ‘standard’ correction data are included as all correction methods currently available make the assumption of static image acquisition.
2. Theory
2.1. Static camera saturation
In a classic paralyzable system, a linear relation exists between the count rate viewed by the detector and the detector dead-time. Assuming a linear response between count rate, C, and activity, A, in the absence of dead-time, with α as the linear response coefficient, the following formula may be derived (Sorenson 1975, Zasadny et al 1993):
| (1) |
where β is the dead-time coefficient. The relation represented by equation (1) is not a function as it is not one-to-one; however, as long as the activity under the camera is less than 1/β it remains one-to-one and serves as a function. Neither is equation (1) invertible: in order to obtain the activity from the count rate, an iterative algorithm (Sorenson 1975, 1976, Adams and Mena 1988, Zasadny et al 1993, Delpon et al 2002b) is used, valid for static acquisitions, which is based on Newton’s method where each successive approximation of A is obtained from the formula:
| (2) |
where Cm is the measured count rate and the derivative C′n of equation (1) may be expressed as
| (3) |
2.2. Whole-body sweep camera saturation
However, in WB planar imaging, the value A in the exponent of equation (1) and the A in the linear part of the same equation do not represent the same activities. This is a consequence of the fact that count rate saturation is dependent upon the total counts seen by the detector while the linear count rate from a specific imaged location is proportionate only to the activity at that location. In a WB planar image the measured count rate cij, at a given longitudinal position, i, (designated as the y-axis) when the camera is in position (or time point), j, is equal to
| (4) |
where W is the width of the detector in pixels, in this case 256. The index, i, spans the patient length and provides the y-pixel position for the count rate seen along a given column, i, of the whole-body image and varies from 0 to N − 1, where N is 1024. For a given position, i, the index j indicates the position of the leading edge of the detector; j ranges from i to i + W − 1, i.e., all detector positions that include the column i in the field of view. The additional index, k, which is used in the exponent, is used to sum over all columns of the detector for each value of j to provide the total activity seen by the detector at each detector position j; k varies from j − W + 1 to j. The indices as a function of position are illustrated in figure 1.
Figure 1.
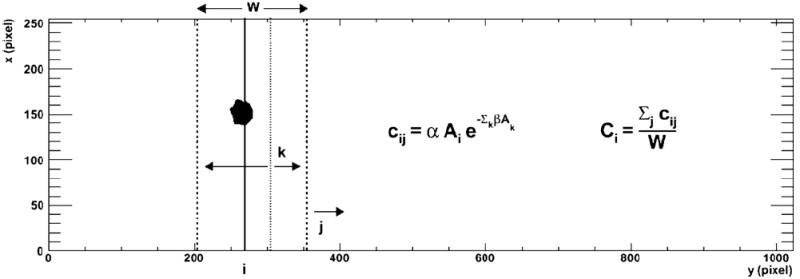
The different indices i, j and k from equations (4) and (5) are illustrated against a backdrop of an imaged tumor ROI. Here i is the column number of the imaged object denoted by the solid line. For each i, the index j denotes the y-position of the leading edge of the detector, valid for all different positions where it images the ith column. The detector is indicated by the two dotted lines. For each of those j detector positions, the sum of activities in all the k columns, from j − W + 1 to j, seen by the camera is the activity that contributes to the dead-time effect.
For each index, i, the count rate is averaged over the width of the detector to account for the total time that the detector overlaps with the column at index i. In other words, the count rate at position i is the sum of count rates measured when the camera is in different positions which include the y-position, i, within the detector head field of view, divided by the number of such camera positions:
| (5) |
There are additional constraints placed on the variables j and k not represented explicitly in equations (4) and (5): the values for the variables only enter into the summation if they satisfy the constraints:
| (6) |
Both conditions on j are always satisfied and the denominator in equation (5) reduces to W. However, the conditions are not always satisfied for k and must be checked. These conditions are implicit in all equations throughout the paper that include summation over indices representing columns.
2.3. Camera simulation algorithm
This formalism was interpreted into algorithms to simulate detector response and count rate correction. Since the response and correction are functions of the y-position only, one-dimensional matrices (or arrays) were sufficient to test the algorithms, which operate on a column-by-column basis (y-position). The camera response simulation algorithm is the following.
- Find the activity seen by the detector for each time point, j (j varies from 0 to N + W − 1), by summing the activities Ak:
(7) - Calculate each matrix element cij, the count rate measured in column i at time j attenuated by the activity Aj:
(8) - Take the average count rate over the j index:
(9)
2.4. Saturation correction algorithm
The algorithm for calculating the corrected count rate for each column from the measured count rate expands upon the previous algorithm and uses a modified version of Newton’s method (illustrated in figure 2).
Figure 2.
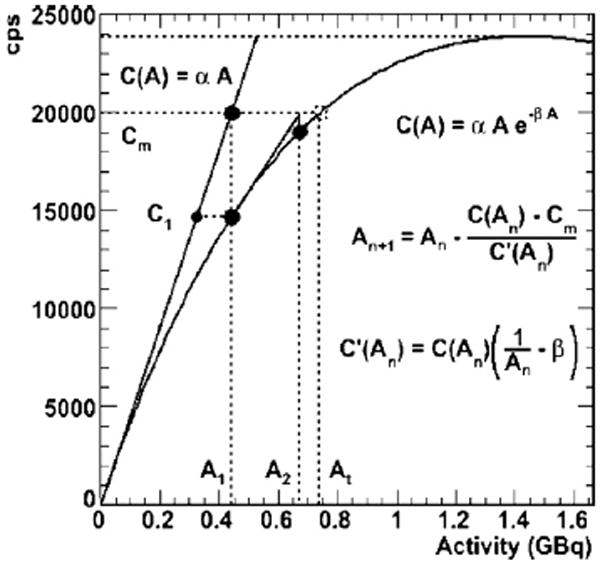
Illustrates the correction algorithm in one dimension, an adaptation of Newton’s method. Here At is the true activity and Cm is the measured count rate.
- For each pixel column position, i, make a linear (or first-order) approximation of the activity, Ai from the summed measured (m) count rate per column Ci(m):
(10) Find the activity seen by the detector for each time point, j, by summing the activities Ak (equation (7)).
Calculate each matrix element cij, the count rate measured in column i at time j attenuated by the activity Aj (equation (8)).
Take the average count rate (equation (9)).
- Calculate the next, (n + 1)st, approximation of Ai (where Ci(m) is the initial measured count rate):
(11) Repeat steps 2–5 and calculate the difference between successive values of Ai until the desired precision is reached for each Ai.
The difference from a classic application of Newton’s method to a multi-dimensional problem is the addition of steps 3 and 4, which calculate successive approximations as a sum of contributions from different saturating activity values (step 3), and averages those contributions (step 4).
Note that the precision is not introduced directly into the algorithm; the difference in successive Ai values is used as substitute for precision, reflecting the rate of convergence rather than actual precision. Though the actual relationship between these two varies, they are closely related. A greater precision can be reached by a more rigorous condition set on the convergence.
3. Methods
3.1. Detector
The phantom WB sweeps and the static phantom images for the saturation curve were acquired with a GE Infinia Hawkeye (GE Healthcare, Waukesha, WI, USA) gamma camera using a low energy, high resolution (LEHR) collimator, and an energy window set at 103 ± 10.3 keV. Whole-body scans were collected at a sweep rate of 10 cm min−1. Calibration, scatter, attenuation and count saturation corrections were implemented as outlined below. The isotope used in this study, 153Sm, is a β− emitter, with an average β energy of 233 keV, which makes it desirable for therapy. 153Sm has a half-life of 46.3 h, and it emits a 103 keV photon used for imaging.
3.2. Static camera saturation parameters
A carefully measured high activity of 153Sm-EDTMP was obtained and diluted with water into a large flat phantom (h = 48 cm, w = 38 cm, d = 1.2 cm) and allowed to decay over time. In addition to the depth d, of the liquid, 1.0 cm of plexiglass enclosed the activity. Images were acquired twice daily over a 1 week period and the measured counts plotted versus physical decay-corrected initial activity.
Equation (1) was fit to the data and the parameters α and β were determined. The fit was modified to account for the attenuation due to 1.0 cm of plexiglass, so as to be able to correct for counts leaving the phantom surface.
3.3. Algorithm validation
The validity of the correction algorithm was tested on a number of randomly determined matrices. After creating a one-dimensional ‘true’ count rate matrix, a ‘measured’ count rate matrix was created using the camera simulation algorithm which simulates the detector measurement. The ‘measured’ count rates were then run through the correction algorithm and the ‘corrected’ count rates were compared to the original ‘true’ count rates. An example of this process, using ‘true’ count rates based on a sine function, is given in the results section.
3.4. Whole-body sweep phantom
A phantom was imaged using a WB sweep in order to test the correction algorithm. The phantom used was elliptical (a = 15 cm, b = 11 cm, h = 24.5 cm) in shape and filled with 12 650 ml of water containing 2.89 GBq of 153Sm-EDTMP. Within the phantom, a small sphere (V = 90 ml), was filled with water containing a higher concentration of 153Sm-EDTMP (161 MBq, signal to background ratio ~4:1) to simulate a tumor with higher uptake. The phantom was allowed to rest and water was added as air bubbles settled over time. The phantom was imaged using a whole-body sweeps at 50 h, 122 h and 264 h after creation of the phantom. The last time point was imaged to provide data from a low count rate scenario for comparison and thus to provide a measure of the order of the systematic error in the calculation of the activity from the corrected and uncorrected count rates.
The measured count values were summed for each pixel column (y values), since all pixels in the same column have their counts affected by saturation in the same proportion. These column count sums were then corrected for camera saturation compensation according to the previously described algorithm. The individual pixel values were then multiplied by their respective column correction factor. The results were checked by using the camera simulation algorithm and compared to the measured data.
3.5. Activity determination
After correction for dead-time effects, the sphere portion of the phantom was defined by setting a threshold on corrected pixel values. The activity in the sphere was determined using the MIRD methodology (Siegel et al 1999), while substituting in the build-up factor (Siegel et al 1985) as a method for scatter correction. The background values were determined from the phantom profile by setting a fit to the background pixel values of the form:
| (12) |
where a, b, x0, and CB0 are the fit parameters.
3.6. Scatter correction—build-up factor
While the triple energy window method of scatter and attenuation correction is often considered to be the gold standard (Delpon et al 2002a, 2003, Buvat et al 1995, Macey et al 1995), the build-up factor method (Siegel et al 1985) for scattering compensation enjoys the advantage of being the only MIRD-approved method that can be applied retrospectively. The build-up factor method of scatter correction integrated into the standard activity calculation described in MIRD pamphlet 16 (Siegel et al 1999) was applied using the following equations:
| (13) |
where cb is present in the background formula:
| (14) |
The variables are illustrated in figure 3. AR and AB represent the surface areas of the region of interest (ROI) and the background, respectively. CR and CB are the (saturation corrected) measured counts from those areas, L is the phantom thickness, d is the tumor depth and θ is the tumor thickness. cr and cb are the count densities, assumed homogenous, for tumor and background. This methodology accounts for background contribution above and below the ROI. The build-up coefficients μ and B(∞), as well as the attenuation coefficient λ, were determined using phantom study data fit to the following equations:
| (15) |
where TF is the transmission factor and d is the depth of the activity measured from the surface of the phantom. Data were collected for different functional definitions of the tumor region. Since the tumor regions are defined as a percentage of the maximum count value, the build-up and attenuation coefficients vary as the percentage varies.
Figure 3.
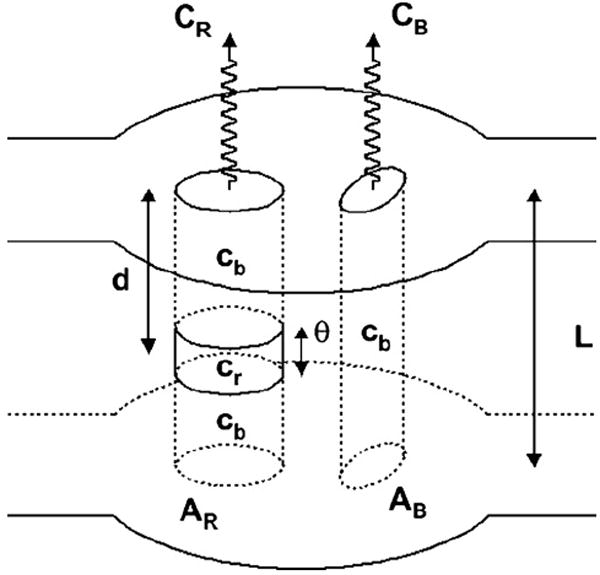
Two-dimensional dosimetry model representing the variables present in equations (13) and (14).
4. Results
4.1. Static phantom study
The static phantom data and the fit to equation (1) are shown in figure 4. To first order, equation (1) fits well (R2 = 0.992, α = 43 060 cps GBq−1, β = 0.715 GBq−1) with the data. The assumption of a paralyzable model of dead-time, i.e. one with dead-time proportionate to total count rate appears to be reasonable. The same fit is used as the basis for the algorithm: this is shown in figure 2 with a graphical illustration of Newton’s method.
Figure 4.
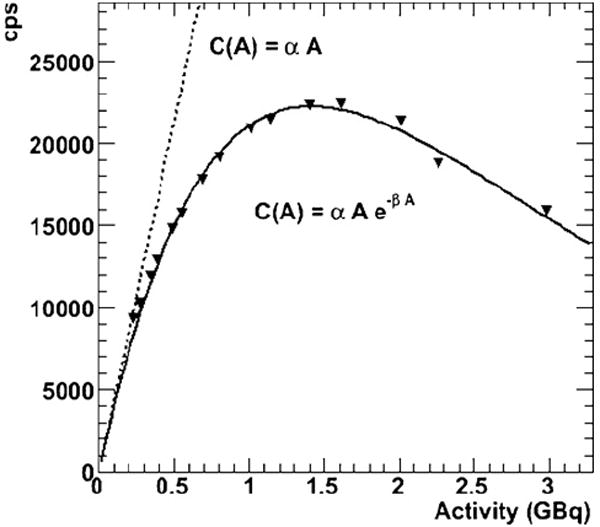
Phantom saturation curve. The phantom consists of 1.0 cm of plexiglass covering 1.2 cm of solution, so the appropriate attenuation modifiers were applied. The triangles are the measured counts per second (cps) values as a function of the decaying activity. The solid line shows the fit using equation (1) and the dotted line shows the theoretically unsaturated linear response. The determined α and β values are the same as used in figure 2, but the range of activities extends further out here.
4.2. Simulation results
An example of simulated data and the results of the saturation correction algorithm are shown in figure 5. The original ‘true’ count rate data, here a modified sine function, is shown in the first figure (figure 5(a)). The data are run through the detector simulation algorithm to create ‘measured data’ and then corrected for the dead-time effect using the correction algorithm. Figure 5(b) shows the ‘measured’ data and figure 5(c) shows the ratio of ‘measured’ count rate to the original ‘true’ count rate as a function of y-positions. The corrected values are then compared with the original input data (figure 5(d)). The greatest difference for a single y-value between original input and output values is 0.025% for a convergence criterion of 1/10 000, and the number of iterations necessary to achieve this result was 22. Similar results were obtained for all manner of functional and randomly generated count rate matrices.
Figure 5.
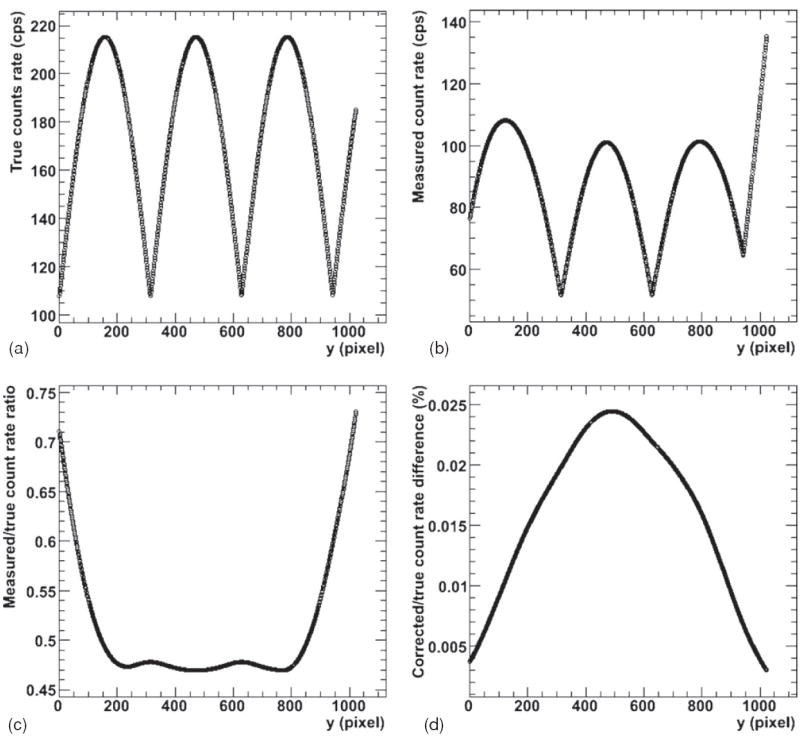
Iterative saturation correction results for the simulated (computer-generated) data. (a) The original ‘true’ data; (b) the simulated ‘measured’ data. (c) The ratio of ‘measured’ to ‘true’ data. The corrected data are compared with the original ‘true’ data as percent difference in (d).
4.3. WB sweep phantom results
The results from the first time point phantom WB sweep are presented in a similar fashion to the simulation results. First, however, the images were converted to one-dimensional column count rate sums. Figure 6(a) shows the raw measured data from the phantom study, and the summed measured count values for each pixel column (y-value) are shown in figure 6(b). All pixels in the same column have their counts affected by saturation in the same proportion. The values in figure 6(b) were taken as input into the algorithm, and the output results are shown in figure 7.
Figure 6.
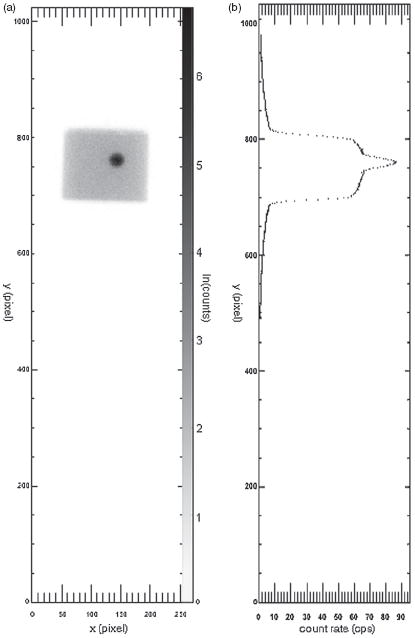
Phantom data. (a) The counts measured in the phantom using a whole-body sweep with a log scale. The y-axes are the same for both images. (b) The x-axis shows the average count rate per pixel across the y-column of pixels in (a).
Figure 7.
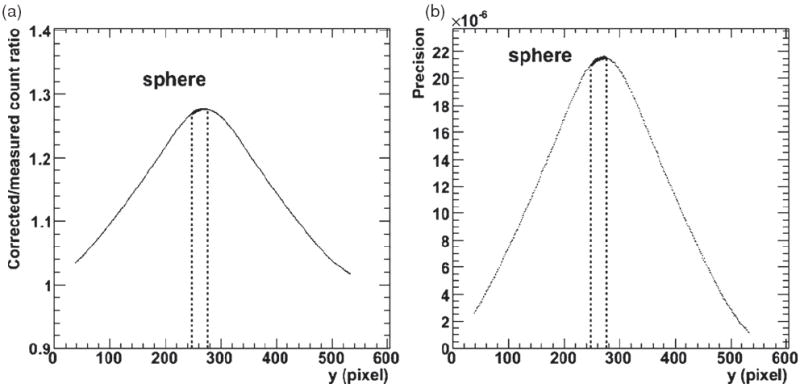
First time point phantom corrected count rate results. (a) The ratio of the corrected values to the measured count rates as a function of y-position (the y-axis in figure 6). (b) The difference between the re-simulated count rate and measured count rate as a function of y-position, reflecting the precision of the correction (for a maximum difference of 0.0022%).
Figure 7 illustrates the phantom results in a similar manner to the simulated results: figure 7(a) shows the ratio of measured count rates to the corrected values as a function of y-position. The corrected values were checked for validity by running them through the detector simulation algorithm. The percent difference between the ‘re-simulated’ values and the original measured data are presented in figure 7(b) which gives the precision of the results. A maximum percent difference of 0.0022% for a convergence criterion of 1/10 000 and 6 iterations is obtained for this phantom data and a correction of ~27% was made to the sphere count rate values. The phantom results for all time points are summarized in table 1.
Table 1.
WB sweep phantom count rate results.
| Time point (h) | Count correction (%) | Precision (%) |
|---|---|---|
| 50 | 27 | 2.2 × 10⁻³ |
| 122 | 9.2 | 3.4 × 10⁻⁴ |
| 264 | 2.3 | 2.7 × 10⁻⁵ |
4.4. Build-up scatter correction
The parameters derived from the phantom studies for the determination of the build-up method of scatter correction are given in table 2. R2 values for the fits are also provided.
Table 2.
Phantom build-up factor results. The fit results to equation (15) for the build-up study as a function of the threshold definition of the ROI are shown. Three different functional ROIs were defined using percentage of the maximum value, as well as the geometrical ROI.
| ROI definition | λ (cm−1) | μ (cm−1) | B (∞) | R2 |
|---|---|---|---|---|
| 50% of max | 0.1385 | 0.1500 | 1.651 | 0.999 |
| 25% of max | 0.1320 | 0.1418 | 1.507 | 0.999 |
| 10% of max | 0.1261 | 0.1343 | 1.425 | 0.999 |
4.5. Activity determination
After applying equations (13) and (14), the activity measured at 50 h for the sphere was 50.4 MBq from the uncorrected counts and 63.7 MBq after dead-time correction. The true activity in the sphere was 75.8 MBq, which translates as an accuracy of 66.3% for the uncorrected activity and 83.8% for the corrected activity. The activity calculated for the 122 h time point was 19.2 MBq (73.8%) for the uncorrected method and 21.2 MBq (81.5%) using the correction algorithm. The measured half-life of the activity in the sphere using uncorrected counts was 51.4 h (111% of the physical half-life) and after dead-time correction was 45.1 h (97.3% of the physical half-life). Similar half-life values were found for all considered regions of interest.
To provide a basis of understanding for the discrepancies in absolute quantification and to verify the convergence of the corrected and uncorrected versions at low activity, the phantom data from the later time point were analyzed. For a sphere activity of 3.07 MBq, the uncorrected activity calculation resulted in 2.52 MBq (81.9%), while the correction algorithm gave the same value rounded to three digits. For images past this last time point, distinction between the sphere signal and background noise rendered quantification unreliable. The results from all three time points are summarized in table 3.
Table 3.
WB sweep phantom activity results. Activities (A) shown are those calculated for the sphere: the activities are calculated using uncorrected counts (Non-corr.) and the corrected counts (Corr.).
| Time (h) | True A (MBq) | Corr. A (MBq) | Non-corr. A (MBq) | A correction (%) |
|---|---|---|---|---|
| 50 | 75.8 | 63.7 (83.8%) | 50.4 (66.3%) | 21 |
| 122 | 26.0 | 21.2 (81.5%) | 19.2 (73.8%) | 9.4 |
| 264 | 3.07 | 2.52 (81.9%) | 2.52 (81.9%) | 0 |
5. Discussion
An algorithmic correction was developed for planar WB sweep acquisitions. Such a correction is complicated by the need to account for motion of the detector and the variable level of count saturation as the detector sweeps across the patient. To first order, the algorithm has proven successful for both the simple simulation and the phantom study. The count saturation correction algorithm yielded an activity phantom half-life consistent with the physical decay half-life of the radionuclide (97%) as compared with the activity half-life calculated without correction for count rate saturation (111%).
An important limiting consideration of the study is a lack of thorough validation. Unfortunately, no other method for correcting for camera saturation with relative motion is available for direct comparison. A complete detector response simulation that accounts for attenuation, scatter, septal penetration and relative motion would be desirable but is beyond the scope of this study.
Moreover, there still exists non-negligible uncertainty on the accuracy of the activity determination using this method. This uncertainty is intrinsic to the nature of two-dimensional dosimetry (Jonsson et al 2005, Hammond et al 1984, Leichner et al 1993), which is not improved upon by this method. Additionally, some uncertainty would stem from the validity of the saturation curve fits. The algorithm is accurate to any desired precision assuming that the saturation curve is itself accurate. This saturation correction is far from superfluous, however, as it could provide a method of retaining reasonable accuracy for two-dimensional kinetics in the event of detector saturation from high activities and count rates.
In particular, the order of accuracy in the phantom study was in the 81–83% range. A certain degree of validation of the method may be seen in the fact that this value remained consistent through a wide range of activity values, and specifically for the third, low activity time point. This result could indicate that the 17–19% error is systematic due to the application of the antero-posterior method of activity determination.
The counts in the sphere were increased by 27% for the first time point and by 9.2% at the second time point by the correction algorithm, while the measured activity was increased by 21% and 9.4%, respectively. The level of correction decreases as a function of decreasing true activity, as expected, both for the count rate and the measured activity. That the measured sphere activity values are not increased by the exact amount as the count rate is due to the errors innate to the activity determination methodology previously mentioned, but also to the fact that the count rates in the background regions have also been adjusted for saturation.
Although a simple paralyzable system is used as an example, the algorithm may be extended to different models, including the non-paralyzable, assuming that the static camera saturation curve can be fit with a functional form. For example, for a nonlinear paralyzable camera response of the form: C = αAγ e−βA, the algorithm remains valid as long as the appropriate modification to the derivative of C is used in equation (11), in this case: C′n = Cn (γ − βAn).
6. Conclusions
Accurate WB planar dosimetry of high activities relies on successfully compensating for camera saturation which takes into account relative motion between detector and imaged object, that is, time-dependent dead-time effects. The algorithm presented here accomplishes this task to any desired degree of precision.
Acknowledgments
This work was financially supported by NIH, EUSAPharm (formerly Cytogen).
References
- Adams R, Mena I. Testing the count rate performance of the scintillation camera by exponential attenuation: decaying source; multiple filters. Med Phys. 1988;15:415–9. doi: 10.1118/1.596241. [DOI] [PubMed] [Google Scholar]
- Bardies M, et al. Bispecific antibody and iodine-131-labeled bivalent hapten dosimetry in patients with medullary thyroid or small-cell lung cancer. J Nucl Med. 1996;37:1853–9. [PubMed] [Google Scholar]
- Buvat I, Rodriguez-Villafuerte M, Todd-Pokropek A, Benali H, Di Paola R. Comparative assessment of nine scatter correction methods based on spectral analysis using Monte Carlo simulations. J Nucl Med. 1995;36:1476–88. [PubMed] [Google Scholar]
- Chiesa C, et al. A practical dead time correction method in planar activity quantification for dosimetry during radionuclide therapy. Q J Nucl Med Mol Imaging. 2009;53:546–61. [PubMed] [Google Scholar]
- Delpon G, Ferrer L, Lenta C, Lisbona A, Buvat I, Bardies M. Comparison of four scatter correction methods for patient whole-body imaging during therapeutic trials with iodine-131. Cancer. 2002;94:1224–30. doi: 10.1002/cncr.10289. [DOI] [PubMed] [Google Scholar]
- Delpon G, Ferrer L, Lisbona A, Bardies M. Correction of count losses due to deadtime on a DST-XLi (SmVi-GE) camera during dosimetric studies in patients injected with iodine-131. Phys Med Biol. 2002;47:N79–90. doi: 10.1088/0031-9155/47/7/402. [DOI] [PubMed] [Google Scholar]
- Delpon G, Ferrer L, Lisbona A, Bardies M. Impact of scatter and attenuation corrections for iodine-131 two-dimensional quantitative imaging in patients Cancer. Biother Radiopharm. 2003;18:191–9. doi: 10.1089/108497803765036355. [DOI] [PubMed] [Google Scholar]
- Eary JF, Appelbaum FL, Durack L, Brown P. Preliminary validation of the opposing view method for quantitative gamma camera imaging. Med Phys. 1989;16:382–7. doi: 10.1118/1.596347. [DOI] [PubMed] [Google Scholar]
- Flux G, Bardies M, Monsieurs M, Savolainen S, Strands SE, Lassmann M. The impact of PET and SPECT on dosimetry for targeted radionuclide therapy. Z Med Phys. 2006;16:47–59. doi: 10.1078/0939-3889-00291. [DOI] [PubMed] [Google Scholar]
- Hammond ND, Moldofsky PJ, Beardsley MR, Mulhern CB., Jr External imaging techniques for quantitation of distribution of I-131 F(ab′)2 fragments of monoclonal antibody in humans. Med Phys. 1984;11:778–83. doi: 10.1118/1.595580. [DOI] [PubMed] [Google Scholar]
- He B, et al. Comparison of residence time estimation methods for radioimmunotherapy dosimetry and treatment planning—Monte Carlo simulation studies. IEEE Trans Med Imaging. 2008;27:521–30. doi: 10.1109/TMI.2007.908131. [DOI] [PMC free article] [PubMed] [Google Scholar]
- Jaszczak RJ, Greer KL, Floyd CE, Jr, Harris CC, Coleman RE. Improved SPECT quantification using compensation for scattered photons. J Nucl Med. 1984;25:893–900. [PubMed] [Google Scholar]
- Jonsson L, Ljungberg M, Strand SE. Evaluation of accuracy in activity calculations for the conjugate view method from Monte Carlo simulated scintillation camera images using experimental data in an anthropomorphic phantom. J Nucl Med. 2005;46:1679–86. [PubMed] [Google Scholar]
- Koral KF, et al. Update on hybrid conjugate-view SPECT tumor dosimetry and response in 131I-tositumomab therapy of previously untreated lymphoma patients. J Nucl Med. 2003;44:457–64. [PubMed] [Google Scholar]
- Leichner PK, Koral KF, Jaszczak RJ, Green AJ, Chen GT, Roeske JC. An overview of imaging techniques and physical aspects of treatment planning in radioimmunotherapy. Med Phys. 1993;20(Pt 2):569–77. doi: 10.1118/1.597051. [DOI] [PubMed] [Google Scholar]
- Loeb DM, et al. Dose-finding study of (153)Sm-EDTMP in patients with poor-prognosis osteosarcoma. Cancer. 2009;115:2514–22. doi: 10.1002/cncr.24286. [DOI] [PMC free article] [PubMed] [Google Scholar]
- Macey DJ, et al. Improved conjugate view quantitation of I-131 by subtraction of scatter and septal penetration events with a triple energy window method. Med Phys. 1995;22:1637–43. doi: 10.1118/1.597423. [DOI] [PubMed] [Google Scholar]
- Sgouros G, Frey E, Wahl R, He B, Prideaux A, Hobbs R. Three-dimensional imaging-based radiobiological dosimetry. Semin Nucl Med. 2008;38:321–34. doi: 10.1053/j.semnuclmed.2008.05.008. [DOI] [PMC free article] [PubMed] [Google Scholar]
- Siegel JA, et al. MIRD pamphlet no. 16: Techniques for quantitative radiopharmaceutical biodistribution data acquisition and analysis for use in human radiation dose estimates. J Nucl Med. 1999;40:37S–61S. [PubMed] [Google Scholar]
- Siegel JA, Wu RK, Maurer AH. The buildup factor: effect of scatter on absolute volume determination. J Nucl Med. 1985;26:390–4. [PubMed] [Google Scholar]
- Sjogreen K, Ljungberg M, Strand SE. An activity quantification method based on registration of CT and whole-body scintillation camera images, with application to 131I. J Nucl Med. 2002;43:972–82. [PubMed] [Google Scholar]
- Sjogreen K, Ljungberg M, Wingardh K, Minarik D, Strand SE. The LundADose method for planar image activity quantification and absorbed-dose assessment in radionuclide therapy. Cancer Biother Radiopharm. 2005;20:92–7. doi: 10.1089/cbr.2005.20.92. [DOI] [PubMed] [Google Scholar]
- Sorenson JA. Deadtime characteristics of Anger cameras. J Nucl Med. 1975;16:284–8. [PubMed] [Google Scholar]
- Sorenson JA. Methods of correcting Anger camera deadtime losses. J Nucl Med. 1976;17:137–41. [PubMed] [Google Scholar]
- Thomas SR, Maxon HR, Kereiakes JG. In vivo quantitation of lesion radioactivity using external counting methods. Med Phys. 1976;03:253–5. doi: 10.1118/1.594287. [DOI] [PubMed] [Google Scholar]
- Zasadny KR, Koral KF, Swailem FM. Dead time of an anger camera in dual-energy-window-acquisition mode. Med Phys. 1993;20:1115–20. doi: 10.1118/1.597008. [DOI] [PubMed] [Google Scholar]


