

Abstract
The atomic force microscope (AFM) was used to continuously follow height changes of individual protein molecules exposed to physiological stimuli. A AFM tip was coated with ROMK1 (a cloned renal epithelial potassium channel known to be highly pH sensitive) and lowered onto atomically flat mica surface until the protein was sandwiched between AFM tip and mica. Because the AFM tip was an integral part of a highly flexible cantilever, any structural alterations of the sandwiched molecule were transmitted to the cantilever. This resulted in a distortion of the cantilever that was monitored by means of a laser beam. With this system it was possible to resolve vertical height changes in the ROMK1 protein of ≥0.2 nm (approximately 5% of the molecule’s height) with a time resolution of ≥1 msec. When bathed in electrolyte solution that contained the catalytic subunit of protein kinase A and 0.1 mM ATP (conditions that activate the native ion channel), we found stochastically occurring height fluctuations in the ROMK1 molecule. These changes in height were pH-dependent, being greatest at pH 7.6, and lowering the pH (either by titration or by the application of CO2) reduced their magnitude. The data show that overall changes in shape of proteins occur stochastically and increase in size and frequency when the proteins are active. This AFM “molecular-sandwich” technique, called MOST, measures structural activity of proteins in real time and could prove useful for studies on the relationship between structure and function of proteins at the molecular level.
The plasma membrane of eukaryotic cells separates the extracellular space from the cell interior so that life can proceed in a well-defined environment. Signals from outside are being transmitted across the plasma membrane by means of proteins that are located in the lipid bilayer. Ion channels are specialized proteins in the plasma membrane that allow the flow of electrical current and, thus, significantly contribute to maintenance of cell voltage, to transmembrane net ion flow, and to signal transduction across the cell membrane. The patch-clamp technique allows studies of the regulation of ion channels by analyzing electrical current at the single molecular level (1). With this technical approach, it was directly shown that ion channels “open” and “close” in a stochastic manner and that the so-called open probability of a channel depends upon various physiological stimuli.
In this report, we introduce a method that also tries to directly evaluate single protein function. In contrast to the patch-clamp technique that analyzes the electrical current flowing through a single protein, the technique presented herein analyzes the changes of the protein shape in response to various stimuli. The ion channel under study—an isolated potassium channel cloned recently from the outer medulla of rat kidney and called ROMK1 (2)—is attached to the tip of an atomic force microscope (AFM) and then placed on a mica surface in electrolyte solution mimicking the cytosol. Any stochastic changes in molecule height at various physiological conditions can thus be continuously monitored because the AFM tip deviates in the vertical direction when the attached protein changes its overall conformation. Because the pH sensitivity of the ROMK1 channel is a well-known characteristic of this protein (3), we screened for any stochastically occurring shape changes of the potassium channel in response to changes in pH.
METHODS
The expression and purification of the fusion protein ROMK1–glutathione S-transferase and the subsequent cleavage of glutathione S-transferase from the fusion protein was performed essentially as described in ref. 4.
AFM Set-Up.
We used the BioScope (Digital Instruments, Santa Barbara, CA), which is an AFM attached to an inverted microscope (Axiovert 100, Zeiss). The BioScope is firmly placed on a heavy pneumatic antivibration table completely isolated from any other laboratory equipment. The whole AFM set-up (i.e., pneumatic table, Axiovert, and BioScope) is placed in a Faraday cage paneled with thick foamed plates similar to those used in music studios. This is of crucial importance because it shields off acoustic noise from the outside environment (the BioScope is particularly sensitive to noise frequencies in the range of 200–400 Hz). A piece of freshly cleaved mica (about 1 cm2) is glued to a thick microscope coverslip (no. 2) that is firmly attached (via vacuum suction) to the metal stage of the inverted microscope. The AFM cantilever with the scanning tip is lowered from the top onto the mica surface, and then 500 μl of Hepes-buffered solution (mimicking the cytosolic electrolyte composition) is injected into the space between the AFM cantilever (top) and the mica surface (bottom). Fluid exchange is performed with tuberculin syringes and fine needles. This takes about 20 sec, a period that cannot be used for analysis due to artificial noise.
Molecular Sandwich Technique (MOST).
The basic concept of MOST is as follows: In a first step, a few ROMK1 protein molecules are firmly attached to the AFM tip, and then, by lowering the tip onto the mica surface, the most protruding ROMK1 protein interacts with the atomically flat mica surface. In other words, the protein is sandwiched between the stable mica surface and the AFM tip that protrudes from the one end of the cantilever (Fig. 1). The cantilever serves as a weak spring that is distorted when the sandwiched ROMK1 protein changes its overall shape. A laser beam that is reflected from the gold-coated cantilever will then be deviated. The change in laser beam position will be sensed by a photodiode that transfers this optical signal into an electrical signal. This electrical signal can be continuously recorded. It represents the apparent changes in height of the protein with a resolution in time in the millisecond range. Measurements are performed at zero scan area; i.e., the cantilever tip remains at the same spot and only moves in the z direction (i.e., vertical direction) due to structural changes of the sandwiched ROMK1 protein. Because the protein is attached to the AFM tip of the cantilever (and not to the mica surface) any (thermal) lateral drift of the AFM tip and/or the mica surface will not introduce significant artefacts. We sampled 256 data points per scan line. Each scan line represented 200 msec (i.e., scan rate was 5 Hz). Thus, a single height measurement was performed every 0.8 msec. We stored recordings that represented 65,536 data points (scan rate = 5 Hz, 256 lines per recording) and analyzed the so-called mean roughness of the recording (Rm), a feature provided by the software package of the BioScope. Rm expressed in nm represents the mean deviation of the data points in the plus and minus z direction in relation to a zeroed reference area. Because we could not directly calibrate the height changes, we must consider the observed deviations of the AFM tip in z direction as “apparent” changes given in nm.
Figure 1.
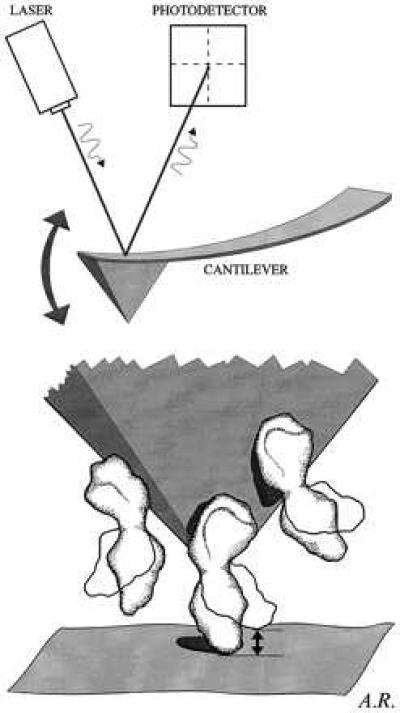
Schematic illustration of the MOST. (Upper) The scanning tip of the AFM is an integrated part of the cantilever that acts as a soft spring (spring constant, 0.06 N/m). A laser beam, reflected from the cantilever, transmits the position of the AFM tip (via a photodiode) to a computer. (Lower) The protein-coated AFM tip is lowered onto the mica surface until the most protruding molecule is sandwiched between mica and AFM tip. Then, the AFM tip remains at this very spot (i.e., x–y scan is disabled). Any changes in the height of the sandwiched molecule (“contraction or expansion”) will be transmitted to the cantilever and cause it to deviate in vertical direction (i.e., along the z axis). These data are analyzed. They probably represent the apparent height fluctuations of the most protruding molecule over time. The resolution in height is about ≥0.2 nm (or about 5% of total molecule height), with a time resolution ≥1 msec. Experiments are performed in fluid mimicking the physiological environment of the respective molecule.
Coating of the AFM Tips.
Tip were coated in two steps. (i) The triangular-shaped cantilever (leg length, 200 μm; spring constant, 0.06 N/m) carrying the AFM tip (oxide-sharpened silicon nitride oriented twin-tip NP-STT; Digital Instruments) was immersed in a poly-(l-lysine)-containing solution [poly-(L-lysine) at 0.1 mg/ml in H2O] for 1 min and then rinsed with destilled water. Treatment of the AFM tip with the polycation poly-(l-lysine) provided the matrix to attach the ROMK1 protein. Pilot studies revealed that ROMK1 molecules firmly attach to surfaces (e.g., glass or mica) pretreated with poly-(l-lysine). In a second step, the AFM tips were immersed in a 10-μl droplet of cytosolic solution containing the ROMK1 protein at a concentration of 1.7 pM. In an appropriate dish, the cantilevers were left in this solution for 24 h at 4°C.
Tip coating was examined in two different ways: Scanning electron microscopy was used to view the AFM tips to evaluate coating after various different treatments [e.g., with and without poly-(l-lysine) pretreatment, different ROMK1 concentrations, etc.]. A representative example of a ROMK1-coated tip is shown in Fig. 2. The bar-shaped AFM tip appears covered with the ROMK1 protein. Pretreatment with poly-(l-lysine) and a ROMK1 concentration of about 1 pM gave the most reproducible results. A well-coated AFM tip has protein molecules attached only to the very top of the tip. Another approach to evaluate successful tip coating, and a better way in practice, is to mount the cantilever on the AFM and to run so-called cantilever deflection (i.e., force) curves. To obtain such force curves the AFM tip was positioned a few micrometers above the mica surface in cytosolic fluid. In so-called force scans, the deflection of the cantilever was recorded on approach to the mica surface (dimension, nm) and was directly converted into force (dimension, nN) considering the spring constant of the cantilever (0.06 N/m). A typical force curve taken with a noncoated tip on mica in fluid is shown in Fig. 3A. The adhesive force between AFM tip and mica is usually small, causing a small downward-directed “sink” before the AFM tip jumps back into the noncontact position. In contrast, successfully coated tips show a significantly deeper sink before the tip retracts into the noncontact position (Fig. 3 B–D). We found virtually no difference in the force curves between noncoated tips and poly-(l-lysine)-coated tips. In an additional series of experiments, we used the enzyme carbonic anhydrase (from bovine erythrocytes; Sigma) for tip coating. This series of experiments was performed to compare the response of ROMK1-coated and carbonic anhydrase-coated tips to the application of CO2 (vide infra). Tips were coated with carbonic anhydrase by using a procedure similar to that used for ROMK1 coating, as described above, except that a 1 nM carbonic anhydrase solution instead of a 1 pM ROMK1 solution was applied.
Figure 2.
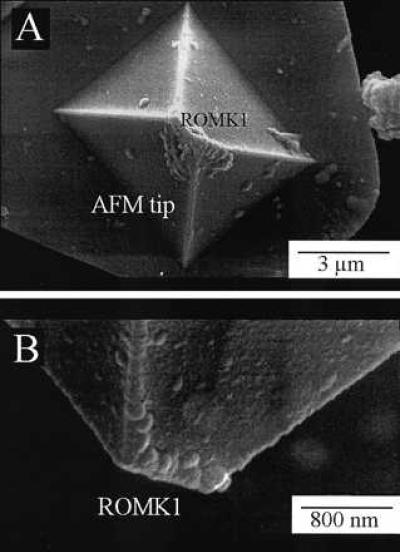
Top view (A) and side view (B) of an AFM tip coated with the ROMK1 protein. Images were obtained with a scanning electron microscope (DSM 962, Zeiss). AFM tips were directly sputtered with 20- to 30-nm gold and then analyzed by scanning electron microscope. Note the bar-shaped AFM tip with ROMK1 proteins attached to it.
Figure 3.
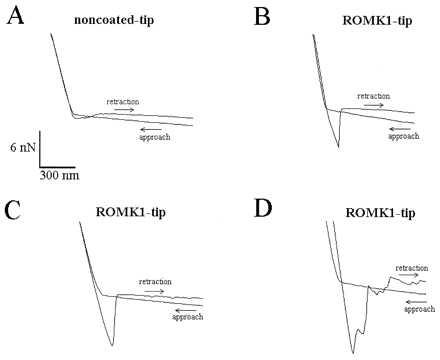
Four force scan curves illustrating the difference between noncoated AFM tips (A) and AFM tips coated with the ROMK1 channel protein (B–D). To obtain a force curve, the AFM tip first approaches the mica surface until the cantilever holding the tip is distorted. This creates the upward slope. Then, the AFM tip is retracted (downward slope) until the retractive force overcomes the adhesive force and the tip “jumps off” the mica surface. The adhesive force between a noncoated AFM tip and mica is usually small, causing a small downward-directed sink before the AFM tip jumps back into the noncontact position (A). In contrast, successfully coated tips show a significantly deeper sink before the tip retracts into the noncontact position (B–D).
Electrolyte Solutions.
From patch-clamp studies, it is known that the ROMK1 channel remains active and responsive to physiological stimuli when the catalytic subunit of protein kinase A (PKA) and 0.1 mM ATP are present in the experimental solution (5, 6). Therefore, we performed all experiments in solutions containing PKA at 20 units/ml and 0.1 mM ATP. Pilot studies revealed that in the absence of PKA and ATP, the ROMK1 protein also responds to changes in pH; however, height fluctuations were less pronounced and less reproducible (unpublished observation). The composition of the cytosolic solution (bath solution) used in all experiments was 130 mM KCl, 1 mM MgCl2, 0.1 mM CaCl2, 10 mM NaCl, 1.0 mM EGTA, and 10 mM Hepes. The calcium chelator EGTA in combination with CaCl2 gave, at pH 7.4, a free calcium concentration of 0.1 μM Ca2+. In the different series of experiments, pH was titrated in steps of 0.2 pH units from pH 6.8 to pH 7.8, adding appropriate amounts of 1 M NaOH to the bath solution. In some experiments 5% CO2/95% room air was applied to the bath solution via a flexible silicon-rubber tubing that delivered the gas close to the 500-μl fluid meniscus formed between cantilever and mica surface. This allowed the rapid equilibration of the bath fluid with CO2 without introducing significant artefacts.
Statistics.
Data are given as the mean ± SEM. Significant differences in the results were evaluated by applying the paired or unpaired Student’s t test when applicable. Samples were considered to be significantly different at P < 0.05 or less.
RESULTS
The so-called small-conductance potassium channel of the apical plasma membrane of rat cortical collecting duct has been carefully characterized by the patch-clamp technique (7). The K+ channel can maintain its activity at low concentrations of ATP in the presence of cAMP-dependent protein kinase A. Furthermore, the channel is very sensitive to intracellular pH. Changing bath pH facing the cytoplasmic side of inside-out patches from pH 7.4 to 6.9 reversibly reduced the mean open probability from 0.9 to 0.1 (3). This channel most likely belongs to the family of the ROMK channels that were further characterized by patch-clamp techniques when expressed in Xenopus laevis oocytes (6, 8). In the present study, we focused on the pH sensitivity of the channel. To maintain the channel in a potentially active state, we added the catalytic subunit of PKA and 0.1 mM ATP to all solutions applied. We mounted a ROMK1-coated cantilever to the AFM, performed a force curve in cytosolic solution, and tested for proper coating (vide supra). Then, we increased the pH of the cytosolic solution from pH 6.8 to 7.8 in steps of 0.2 pH units. At each individual pH, we collected a series of three to five AFM recordings. The scan area was set to zero, the scan rate was 5 Hz, and each recording was composed of 256 lines. Extreme care was taken to reduce the force to the range of 50–100 pN. Fig. 4 shows a set of six AFM recordings (panels 1 to 6) taken at the increasing pH values. The lines (continuously recorded and for clarity lined up as single tracings, each about 250 msec in duration) of the individual subsets represent the vertical deviations of the AFM tip (z fluctuation) over a period of about 2,000 msec. Between pH 6.8 and 7.2, the z fluctuation of the AFM tip is rather small; thus, the individual tracings (256 data points per line) look smooth. At a more alkaline pH, the z fluctuations increase with a clear maximum at pH 7.6. Further alkalinization (pH 7.8) again reduces the height fluctuations of the AFM tip.
Figure 4.
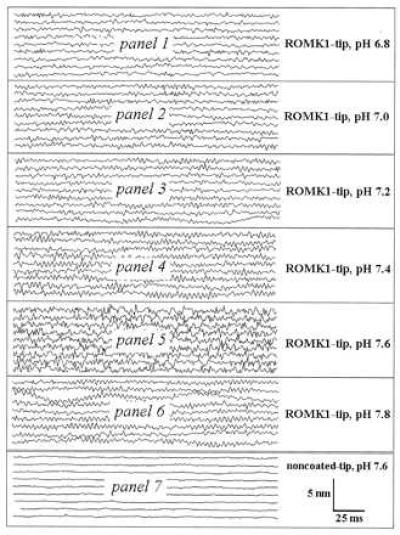
Individual AFM tracings obtained with a ROMK1-coated AFM tip at different pH values (panels 1–6; paired study; i.e., an individual ROMK1-coated AFM tip was subsequently exposed to bath solutions with increasing pH; each experiment was repeated several times to test for the reversibility of the pH response). The catalytic subunit of PKA at 20 milliunits/ml and 0.1 mM ATP were present in the intracellular electrolyte solution to maintain the ROMK1 channel protein in an activatable condition. The tracings in panel 7 were obtained with a noncoated AFM tip. They represent the background noise.
We interpret the height fluctuations of the ROMK1-coated AFM tip as follows: Any deviation directed upwards represents an “expansion” of the ROMK1 molecule at the AFM tip and any deviation directed downwards a “contraction” of the molecule. Integrated in the individual line tracings is the unspecific “noise” of the AFM tip, which we tested independently with noncoated AFM tips and which is considerably less than the observed fluctuations obtained with ROMK1-coated tips (Fig. 4, panel 7). Again it becomes obvious from Fig. 4 that at pH 7.6, height fluctuations are most prominent. Fig. 5 shows the statistical analysis of the results. The mean roughness (Rm) of the individual recordings increases with increasing pH showing its optimum at pH 7.6. This figure also displays the Rm values of noncoated tips. They are clearly below the values of those of ROMK1-coated tips and demonstrate that unspecific noise is virtually independent of pH (at least between pH 6.8 and 7.8).
Figure 5.
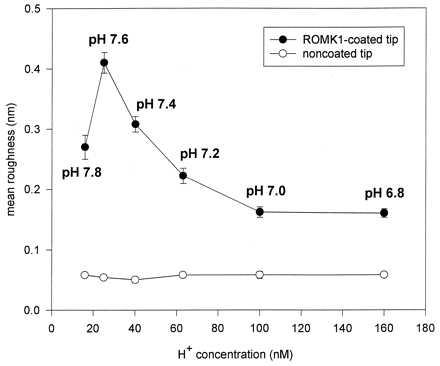
Mean roughness (Rm) of individual recordings obtained with noncoated [noncoated tips treated only with poly-(l-lysine); five experiments] and ROMK1-coated (five experiments) AFM tips are plotted vs. different pH values of the bath solution. Data are the mean ± SEM of five recordings (with about 65,000 data points per recording) obtained at a specific pH value. The experiments were performed as a paired study; i.e., an individual ROMK1-coated [or noncoated but coated with poly-(l-lysine)] AFM tip was subsequently exposed to six pH values. This was accomplished by completely exchanging the bath solution after a recording was obtained at one specific pH value.
For comparison, we tested the response to a change in pH by using another protein, namely, carbonic anhydrase, an enzyme known to transform CO2 in the presence of H2O into H+ and HCO3−. Therefore, we first exposed a carbonic anhydrase-coated AFM tip to a cytosolic solution with pH 7.6 and measured Rm of several recordings. Then we equilibrated the solution with 5% CO2 and again measured Rm. The data of this series of experiments are given in Table 1. Rm clearly increased with the addition of CO2, indicating that the enzyme mounted on the AFM tip was activated. Then, we added the carbonic anhydrase inhibitor acetazolamide (0.1 mM) to the CO2-equilibrated solution. Under these conditions, Rm decreased to values that were even lower compared with controls. The same experimental protocol was also applied to ROMK1-coated AFM tips. In contrast, to the former experiment, Rm decreased in response to CO2 and was not influenced by the presence of acetazolamide (Table 1). Because the addition of 5% CO2 lowers pH of the cytosolic Hepes-buffered solution by about 2 pH units (measured independently in vitro), we interpret this latter observation as being an inhibitory effect of acid pH on ROMK1 channel activity. This series of experiments shows that changing pH in the cytosolic solution leads to individual responses in functionally different proteins.
Table 1.
Mean roughness
| Parameter | % control
|
|
|---|---|---|
| ROMK1 | Carbonic anhydrase | |
| Control* | 100 | 100 |
| Control + 5% CO2 | 52 ± 6 (5) | 146 ± 12 (6) |
| Control + 5% CO2 + acetazolamide | 56 ± 7 (4) | 89 ± 10 (5) |
| Control + Anti-ROMK1 | 72 ± 9 (5) | 102 ± 9 (4) |
Cytosolic solution at pH 7.6 [ROMK1 experiments, PKA (catalytic subunit) at 20 units/ml and 0.1 mM ATP]. Numbers of samples tested are in parentheses.
In a final series of experiments, we tested whether the application of a specific antibody against the ROMK1 protein (anti-ROMK1; polyclonal antibody from Alomone Labs, Jerusalem, Israel) could lead to any signal at the ROMK1-coated AFM tip (i.e., change in z fluctuations of the AFM tip). We first performed a control experiment in cytosolic solution (pH 7.6) and analyzed Rm. Then, we added anti-ROMK1 (final concentration in the bath solution = 1 nM) and, after a few minutes, again analyzed Rm in a series of subsequent recordings. As shown in Table 1, Rm clearly dropped to significantly lower values. This indicates that anti-ROMK1 apparently interacted with the ROMK1 protein at the AFM tip. Currently, we cannot specify whether this decrease of fluctuations in height indicates a functional reduction of the activity of the ROMK1 channel or simply reflects the physical interaction between ROMK1 and its antibody. A nonspecific protein–protein interaction at the AFM tip can be excluded because BSA applied at concentrations similar to anti-ROMK1 did not change the z fluctuations of the ROMK1-coated AFM tip (unpublished observations).
DISCUSSION
The atomic force microscope is a tool for studying the physiological function of individual biomolecules. Some studies have been performed with so-called functionalized AFM tips. With such an approach, researchers study interaction forces between macromolecules. Adhesion forces have been investigated between individual ligand–receptor pairs (9) and the biophysical binding characteristics of a protein with its specific antibody (10). Furthermore, enzyme activity has been directly observed with the AFM with a time resolution in the millisecond range (11). In these experiments the enzyme lysozyme was adsorbed to the mica surface (not to the AFM tip) and fluctuations of the heights of individual molecules before and after the stimulation with substrate were measured with a noncoated AFM tip. Because of the rather unpredictable thermal drift of the mica surface loaded with lysozyme, the AFM tip interacts with an unpredictable number of molecules that “meet” with the AFM tip although scan area is set to zero. This can cause uninterpretable height fluctuations of the AFM tip. This problem was circumvented by using a protein-tracking system, where the AFM tip was periodically repositioned above a single protein molecule as thermal drifting occurred (12). The present study focused in a similar direction but used a different technical approach: We attached the biomolecule to the AFM tip and sandwiched it between AFM tip and mica surface. Because mica is atomically flat, thermal drift should not cause fluctuations in height and thus should not considerably increase unspecific noise. A potential disadvantage of MOST is that biomolecules have to be properly attached to the AFM tip before the experiment. This procedure has to be standardized for individual proteins because binding properties on poly-(l-lysine)-coated tips will definitely differ significantly among various molecules. Finally, as evident from scanning electron microscopy (see Fig. 2), many ROMK1 molecules were usually attached to the AFM tip. Therefore, we cannot directly relate the observed height fluctuation of the AFM tip to one individual molecule. However, we assume that the “most-protruding” protein at the AFM tip is the one in contact with the mica surface and thus mainly responsible for the apparent height fluctuation of the AFM tip. Nevertheless, this is only a speculation that needs to be further tested.
As discussed in other studies (9, 13), it is of crucial importance to reduce the force between the protein-coated AFM tip and mica to a minimum. MOST is sufficiently sensitive at forces in the range of 50–100 pN. The force curves performed during an experiment usually give a good indication whether the tip is still properly functioning. Also the mean roughness Rm can be analyzed in the course of an experiment and usually can tell the researcher whether the biomolecule under study is still active. To investigate a basic physiological property of a single integral membrane protein, we decided to test for the pH sensitivity of the isolated ROMK1 channel protein. There were several reasons to choose this protein. (i) From the physiological point of view, the ROMK1 channel localized in the distal portion of the nephron (14, 15) is of potential importance for transcellular K+ secretion into the tubule lumen. There is a vast body of evidence that the small-conductance K+ channel described by Wang and Giebisch (7) is the functional correlate for this protein. (ii) The pH sensitivity is a characteristic feature of the small-conductance K+ channel (3) and was shown in detail for the specific ROMK1 channel (6). (iii) The cDNA of ROMK1 has been available since 1992 (2), and thus the protein can be expressed in Escherichia coli and purified. (iv) Finally, we recently imaged by AFM the ROMK1 protein on mica in cytosolic electrolyte solution (4). We were encouraged to further investigate the function of this isolated protein at the molecular level because the protein was shown to bind ATP and/or to change its conformation in response to this nucleotide. As indicated by the present study, height fluctuations of the ROMK1 protein were prominent at pH 7.6. Actually, and this was rather unexpected, height fluctuations have an optimum at this very pH value and become again small at more alkaline conditions. If the magnitude of the height fluctuations reflects the activity of this ROMK1 protein, then at pH 7.6, the ROMK1 channel is most active. Functional studies in various renal potassium channels agree with this observation (3, 16–20). A remote possibility for the observed pH-dependent changes in height fluctuations could be a pH-dependent physical interaction between PKA and ROMK1. Such an explanation, however, is rather unlikely since ROMK1 responds to changes in pH also in the absence of PKA albeit less pronounced (unpublished observations).
The carbonic anhydrase experiment was chosen because the functional properties of this enzyme are well known and is expected to respond to CO2 (another way to acidify the bath solution). We activated the enzyme by CO2 and could show the increase in the height fluctuations. The fact that the ROMK1 protein responded in the opposite direction (i.e., reduction of height fluctuations in response to CO2) is in agreement with the former series of experiments where acid pH reduced ROMK1 activity. The polyclonal antibody against the ROMK1 protein (anti-ROMK1) is known to bind to the C-terminal end of the protein. We observed a substantial decrease in Rm when the antibody was applied to the ROMK1-coated tip. This seems to indicate that anti-ROMK1 interferes with a functionally important amino acid sequence at the C-terminal end of the K+ channel.
The AFM recordings of the height fluctuations with ROMK1-coated tips suggest that the protein mounted to the AFM tip stochastically “expands and contracts.” A representative example of this “structural activity” of a ROMK1 protein is shown in Fig. 6. We assume that a single ROMK1 molecule is approximately a sphere with a diameter of 5 nm (this estimation is based on 40 kDa, the molecular mass of the ROMK1 protein, and 70 nm3, the respective volume, calculated as described (4, 21, 22). The individual fluctuations in height observed with MOST were maximally 0.5 nm. Thus, the structural changes occurring stochastically while the ROMK1 protein is active are about 10% of the total protein height. The minimal height change we can detect with our AFM set-up, taking into account background noise, is about 0.2 nm, which is about 4% of the total height of a single ROMK1 protein.
Figure 6.
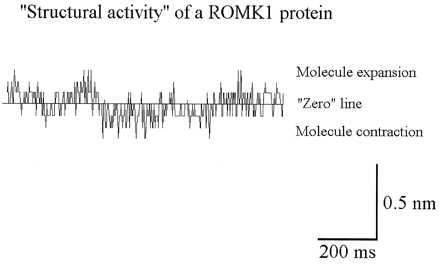
Single tracing of the stochastically occurring fluctuations in apparent molecule height measured with MOST. Upward deflections indicate “molecule expansion,” downward deflections indicate “molecule contraction” in reference to the baseline (“zero” line). The AFM tip was coated with the ROMK1 protein.
The resolution in time of the structural activity of the ROMK1 protein was about 1 msec; i.e., the protein height was measured once per msec. Such a resolution in time was recently used for observing conformational changes of lysozyme molecules (11). The perspective of measuring structural changes of a membrane protein is the millisecond range will possibly allow the direct correlation of the function of an ion channel or any other membrane protein, analyzed by electrophysiological techniques, and the structural change of the respective protein, analyzed by MOST.
Acknowledgments
We thank Prof. Georg Krohne (Division of Electron Microscopy, Theodor Boveri Institute, University Würzburg) for performing scanning electron microscopy on AFM tips. We gratefully acknowledge the continuous support of Profs. Gerhard Giebisch and Stefan Silbernagl during the course of these experiments. We thank Drs. D. Hornby and S. White from Sheffield University for providing the purified ROMK1 channel protein. We are grateful to Mrs. A. Rakowska for preparing Fig. 1. The study was supported by the Deutsche Forschungsgemeinschaft, SFB 176 (A6).
ABBREVIATIONS
- AFM
atomic force microscope
- MOST
molecular-sandwich technique
- PKA
protein kinase A
References
- 1.Hamill O P, Marty A, Neher E, Sakmann B, Sigworth F J. Pflügers Arch. 1981;391:85–100. doi: 10.1007/BF00656997. [DOI] [PubMed] [Google Scholar]
- 2.Ho K, Nichols C G, Lederer W J, Lytton J, Vassilev P M, Kanazirska M V, Hebert S C. Nature (London) 1993;362:31–38. doi: 10.1038/362031a0. [DOI] [PubMed] [Google Scholar]
- 3.Wang W, Schwab A, Giebisch G. Am J Physiol. 1990;259:F494–F502. doi: 10.1152/ajprenal.1990.259.3.F494. [DOI] [PubMed] [Google Scholar]
- 4.Henderson R M, Schneider S, Li Q, Hornby D, White S J, Oberleithner H. Proc Natl Acad Sci USA. 1996;93:8756–8760. doi: 10.1073/pnas.93.16.8756. [DOI] [PMC free article] [PubMed] [Google Scholar]
- 5.Wang W, Giebisch G. Proc Natl Acad Sci USA. 1991;88:9722–9725. doi: 10.1073/pnas.88.21.9722. [DOI] [PMC free article] [PubMed] [Google Scholar]
- 6.McNicholas C M, Wang W, Ho K, Hebert S C, Giebisch G. Proc Natl Acad Sci USA. 1994;91:8077–8081. doi: 10.1073/pnas.91.17.8077. [DOI] [PMC free article] [PubMed] [Google Scholar]
- 7.Wang W, Giebisch G. J Gen Physiol. 1991;98:35–61. doi: 10.1085/jgp.98.1.35. [DOI] [PMC free article] [PubMed] [Google Scholar]
- 8.Macica C M, Yang Y, Hebert S C, Wang W H. Am J Physiol. 1996;271:F588–F594. doi: 10.1152/ajprenal.1996.271.3.F588. [DOI] [PubMed] [Google Scholar]
- 9.Florin E-L, Moy V T, Gaub H E. Science. 1994;264:415–417. doi: 10.1126/science.8153628. [DOI] [PubMed] [Google Scholar]
- 10.Hinterdorfer P, Baumgartner W, Gruber H J, Schilcher K, Schindler H. Proc Natl Acad Sci USA. 1996;93:3477–3481. doi: 10.1073/pnas.93.8.3477. [DOI] [PMC free article] [PubMed] [Google Scholar]
- 11.Radmacher M, Fritz M, Hansma H G, Hansma P K. Science. 1994;265:1577–1579. doi: 10.1126/science.8079171. [DOI] [PubMed] [Google Scholar]
- 12.Thomson N H, Fritz M, Radmacher M, Cleveland J P, Schmidt C F, Hansma P K. Biophys J. 1996;70(5):2421–2431. doi: 10.1016/S0006-3495(96)79812-0. [DOI] [PMC free article] [PubMed] [Google Scholar]
- 13.Radmacher M, Cleveland J P, Fritz M, Hansma H G, Hansma P K. Biophys J. 1994;66:2159–2165. doi: 10.1016/S0006-3495(94)81011-2. [DOI] [PMC free article] [PubMed] [Google Scholar]
- 14.Lee W-S, Hebert S C. Am J Physiol. 1995;268:F1124–F1131. doi: 10.1152/ajprenal.1995.268.6.F1124. [DOI] [PubMed] [Google Scholar]
- 15.Boim M A, Ho K, Shuck M E, Bienkowski M J, Block J H, Slightom J L, Yang Y, Brenner B M, Hebert S C. Am J Physiol. 1995;268:F1132–F1140. doi: 10.1152/ajprenal.1995.268.6.F1132. [DOI] [PubMed] [Google Scholar]
- 16.Bleich M, Schlatter E, Greger R. Pflügers Arch. 1990;415:449–460. doi: 10.1007/BF00373623. [DOI] [PubMed] [Google Scholar]
- 17.Hurst A M, Hunter M. Pflügers Arch. 1989;415:115–117. doi: 10.1007/BF00373148. [DOI] [PubMed] [Google Scholar]
- 18.Oberleithner H, Kersting U, Hunter M. Proc Natl Acad Sci USA. 1988;85:8345–8349. doi: 10.1073/pnas.85.21.8345. [DOI] [PMC free article] [PubMed] [Google Scholar]
- 19.Fakler B, Schultz J H, Yang J, Schulte U, Brändle U, Zenner H P, Jan L Y, Ruppersberg J P. EMBO J. 1996;15:4093–4099. [PMC free article] [PubMed] [Google Scholar]
- 20.Coulter K L, Périer F, Radeke C M, Vandenberg C A. Neuron. 1995;15:1157–1168. doi: 10.1016/0896-6273(95)90103-5. [DOI] [PubMed] [Google Scholar]
- 21.Schneider S, Folprecht G, Krohne G, Oberleithner H. Pflügers Arch. 1995;430:795–801. doi: 10.1007/BF00386178. [DOI] [PubMed] [Google Scholar]
- 22.Oberleithner H, Schneider S, Bustamante J O. Pflügers Arch. 1996;432:839–844. doi: 10.1007/s004240050206. [DOI] [PubMed] [Google Scholar]