

Abstract
Preformed gas bubbles can increase energy absorption from an ultrasound beam and therefore they have been proposed for an enhancer of ultrasound treatments. Although tissue temperature measurements performed in vivo using invasive thermocouple probes and MRI thermometry have demonstrated increased tissue temperature, the microscopic temperature distribution has not been investigated so far. In this study the transfer of heat between bubbles and tissue during focused ultrasound was simulated. Microbubble oscillations were simulated within a rat cortical microvascular network reconstructed from in vivo dual-photon microscopy images and the power density of these oscillations was used as an input term in the Pennes Bioheat Transfer Equation. The temperature solution from the Bioheat Transfer Equation was mapped onto vascular data to produce a three dimensional temperature map. The results showed high temperatures near the bubbles and slow temperature rise in the tissue. Heating was shown to increase with increasing bubble frequency and insonation pressure, and showed a frequency dependent peak. The goal of this research is to characterize the effect of various parameters on bubble-enhanced therapeutic ultrasound to allow better treatment planning. These results show that the induced temperature elevations have nonuniformities which may have a significant impact on the bio-effects of the exposure.
Keywords: hyperthermia, focused ultrasound, bubble, capillary, treatment planning, contrast agent
2 Introduction
High intensity focused ultrasound (HIFU) therapy is an emerging medical technology whereby high-pressure acoustic radiation is focused within the body to heat tissue. The temperature elevation can be used for example to coagulate tissue, or to selectively release drugs from temperature sensitive liposomes [15], or to locally activate gene therapy [25],[4].
Gas filled bubbles within the bloodstream have many biomedical applications. Their salient feature is that they oscillate strongly under an external ultrasound field. Because of this they are used as contrast agents during diagnostic ultrasound[5]. Recent research shows that they may also have therapeutic applications as drug or gene delivery agents [2], as mechanisms for bypassing the blood-brain barrier [7], and as actuators in microfluidic devices [10]. Bubbles can either be produced externally and injected, or produced internally by acoustic cavitation [3].
It is known that the local heat deposition from ultrasound is amplified when bubbles are present[12],[6],[21]. This is known as cavitation- or bubble-enhanced heating [23]. This means that less acoustic pressure is required to achieve the same bio-effects as without bubbles. Research has shown that the vascular permeability of the blood brain barrier is greatly increased when microbubbles are present[24]. By reducing the acoustic pressure or time-average power required to achieve a desired bio-effect, there is a lower chance of damage to the overlying or surrounding normal tissues. This may provide a method to reduce the treatment times currently required for focused ultrasound surgery of large tumours [23],[12]. All of these measurements have investigated macroscopic tissue heating either using invasive thermocouple probes or non-invasive MRI thermometry.
The motivation of this research is to determine the microscopic temperature distribution in vivo induced by focused ultrasound when preformed microbubbles are injected in the blood stream to enhance the heating. The results of these simulations will allow us to better understand the bio-effects of the bubble enhanced heating and potentially optimize it such that safe and effective treatments can be planned and executed. The challenges involved in predicting the temperature rise involve finding a realistic vascular model, taking into account the effect of the vessel geometry on the bubble's oscillation, and simulating the heat transfer from the oscillating bubbles into the tissue.
In this study micron resolution two-photon laser scanning microscopy data from a rat brain were used to reconstruct a 3D microvascular network. This is a departure from previous models using fractal trees to approximate the capillary bed [11]. Bubbles are known to behave differently when in vessels. Previous research has shown decreased oscillation amplitude and resonance frequency for a bubble within a tube [22] [19]. A model is needed to take into account the effect of the vessels on the bubble's dynamics, so that the effect of vessel geometry on bubble oscillation can be used to better predict the heating pattern from the bubbles. This has not been done before in any studies considering energy absorption from the bubbles to the tissue.
As bubbles absorb energy they act as heat sources. The transfer of heat from the source throughout the tissue is characterized by the Pennes Bioheat Transfer Equation (BHTE)[17], a partial differential equation that describes the transfer of heat through biological tissue in the pressence of a heat source. The heat source in this case is a bubble.
Previous research has investigated the effects of vessels on bubble dynamics [22] and of bubbles on heat transfer[8], but this is the first paper to combine real vascular data, a vessel-based bubble dynamics model, and bubble-based bioheat tranfer into one concrete model.
3 Procedure
A 3D stack of the cortical vasculature in the forelimb representation of the primary somatosensory cortex of an alpha-chloralose anesthetized adult rat was acquired using two photon laser scanning microscopy, following a procedure described earlier [26]. Briefly, a small (∼5 mm in diameter), closed (with 1 percent agarose) cranial window was prepared in the course of stereotaxic surgery ∼3.5 mm lateral to bregma. The tail vein was cannulated to allow administration of the fluorophore (Texas Red Dextran, 70 kDa). The imaging was performed using the FV 1000 MPE microscope (Olympus); with the 20× 0.95 NA objective, with a square field of view of 0.636 mm. The excitation, at 810 nm, was achieved via Mai Tai Ti: Sapphire Laser (Spectra Physics) and the emission, in the 570-620 nm range, was collected using external PMT detectors. The acquisition stack spanned 122 slices, each 3.6 microns. The nominal in-plane resolution was 1.2×1.2 microns. 3D visualization was obtained with ImageJ 3D viewer. Each frame contained areas of intravasculature and surrounding tissue. The fraction of vessel volume to the entire volume less than 5 percent.
To simulate the distribution of bubbles within the vasculature, a random number generator was used to assign bubbles to various voxels within the vessel region of the data set. The bubble-containing voxels were tagged so that they could be visualized. The vascular network with the tagged bubbles was viewed and the geometry of the vessel that contained a given bubble was measured by counting the number of voxels along the diameter and length of each vessel, and recorded. The diameter and length of each vessel were used as parameters for the modified Rayleigh-Plesset model.
Ultrasound driving of the bubble was simulated using a range of biomedically relevant parameters. The Zudin modified Rayleigh-Plesset equation [28], which assumes a bubble oscillating at the centre of a rigid cylindrical tube, was used to simulate the bubble's oscillation, using parameters for radius and length gleaned from the 3D image of the brain vasculature by counting the number voxels encompassed by a given vessel. The bubble was assumed to be in the geometric centre of the vessel. This assumption was used to simplify the algorithm and obtain early results, but can be improved upon in future work. The pressure change in the equation was taken from the Morgan et al.[14] model to allow for liquid compressibility. It is assumed that the megapascal-range pressures will disrupt the contrast agent shell; thus no considerations were taken in the simulations for the shell of the bubble. Numerical simulation was performed using MATLAB's ode45 algorithm. The differential equation that was used to simulate the bubble dynamics was:
| (1) |
The symbols are defined in table 1. The heat source power of the bubble was taken as the absorbed viscous power, derived, among others, by Umemura et al.[27]. It takes the form
Table 1.
Symbols and values.
| Symbol | Meaning | Value | |
|---|---|---|---|
| R | Bubble Radius | O(1 μm) | |
| γ | Polytropic Exponent | 1.07 | |
| c | Sound Velocity | 1500 m/s | |
| Pa | Applied Pressure | O(1 MPa) | |
| σ | Surface Tension | 0.072 N/m | |
| μ | Viscosity | 0.001 Pa-s | |
| L | Vessel Length | O(100 μm) | |
| RT | Vessel Radius | O(10 μm) | |
| Q | Power Density |
|
|
| ρ | Density |
|
|
| C | Heat Capacity |
|
|
| k | Thermal Diffusivity |
|
|
| T | Temperature | O(37°C) | |
| t | Time | O(1 μs) | |
| ω | Angular Frequency | O(1 MHz) | |
| ˙ | Time Derivative | ||
| o | Equilibrium |
| (2) |
The power density was calculated by dividing the power from equation 2 by the volume of the bubble, which was assumed to be spherical. The power density of the bubble was sensitive to rapid changes in the bubble's radial displacement. Each radius timepoint was averaged with the previous timepoint in order to create a smoother radial waveform and reduce dramatic outliers in the power density. The numerical timestep was set to one nanosecond.
The power density was taken as the absorbed power divided by the volume of the bubble. It was averaged over 10 microseconds, a time long enough that the strength of an outlying oscillation would have little effect, but short enough for reasonable computation times. The power density was used as an input parameter for the Pennes Bioheat Transfer Equation (BHTE):
| (3) |
Parameters were chosen to be equivalent to those of tissue. The effect of blood flow can be ignored during short, sub-second sonications [1]. The bioheat equation was simulated over a cylindrical domain in C using the explicit Euler method. The heating was simulated over half a second with Dirichlet boundary conditions assuming the temperature rise for a given source dissipates at 600 microns, slightly larger than the largest dimension of the vascular data. This value is chosen to ensure that the region of temperature change about a given bubble encompasses the entire volume. The solution of the BHTE took the form of a temperature map in space and time. The temperature increased as a function of time, and radially the temperature fall-off was Gaussian in appearance: the R-squared value of a Gaussian fit of the temperature versus radius at a given time was over 0.99.
For each bubble within the vascular network, the average power density was calculated and inputted into the BHTE, and the resulting temperature distribution was mapped onto the vascular grid: the distance from each point in the grid to the bubble was calculated, and the temperature rise at that distance was added to that point in the grid. Because the bioheat equation is linear, the changes from multiple bubbles were merely added. The complete algorithm is shown in figure 1.
Figure 1.
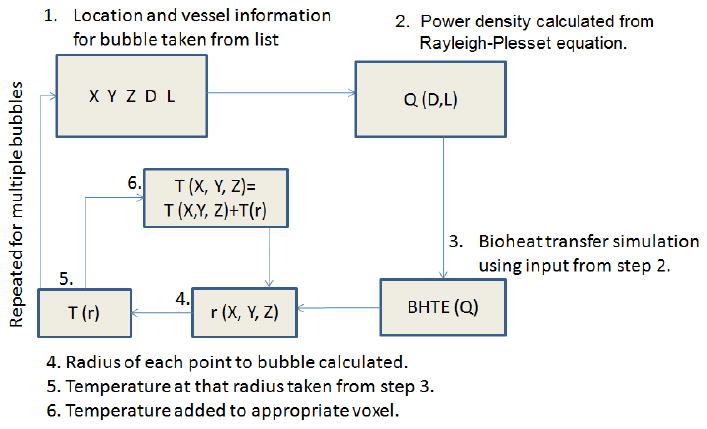
The algorithm used to map the temperature elevation caused by bubbles. 1. A bubble's location and the parameters of its surrounding vessel are taken from a list. 2. A power density is calculated based on the vessel parameters. 3. A bioheat transfer solution based on that power density is simulated. 4. For each voxel in the grid, the distance to the bubble's location is calculated. 5. The temperature at that distance, according to the bioheat transfer solution, is calculated. 6. The temperature at that distance is added to the voxel. This is applied to every bubble in the list.
4 Results
Figure 2 shows the temperature rise for a given bubble as a function of time and distance. The temperature rose, quickly reaching over 90 percent of its peak value within 10 microns of the bubble. The temperature also began increasing earlier at points closer to the bubble, while at farther points there appears to be a time threshold before the temperature begins to rise. After enough time (on the order 0.01 seconds) the temperature levelled off. The temperature rise in the tissue due to the bubbles is on the order of several degrees, while the temperature due to ultrasound absorption in the tissue is approximately 0.35 degrees. The temperature falloff as function of distance was bell-shaped. The heat source shown in figure 2 is of medium strength compared others used in the simulations; the patterns of distance and time dependence are more important than the absolute magnitude in these graphs.
Figure 2.
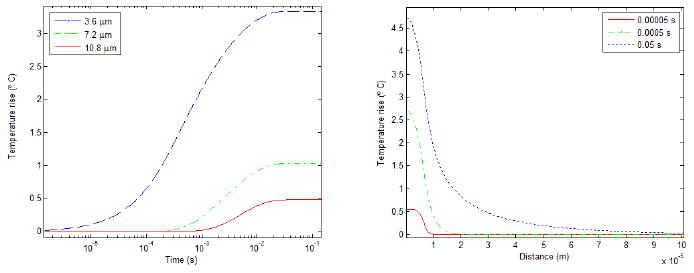
The evolution of the temperature near a bubble as a function of time (left) and distance (right) according to equation 3. The time axis on the left is logarithmic.
The temperature rose most around the bubbles and to a lesser extent throughout the tissue. Viewing the temperature distribution in the vessels, hotspots can be seen with the temperature dropping with distance (figure 3). Temperature tended to be greater in larger vessels, both because bubbles were probabilistically more likely to be in large vessels, and because bubbles in larger vessels oscillate more strongly. The temperature rise was quantified in several ways: the fraction of the volume that had risen to a certain temperature (both at a constant temperature and as a function of temperature), and the temperature at which 95 or 50 percent of the tissue was hotter.
Figure 3.
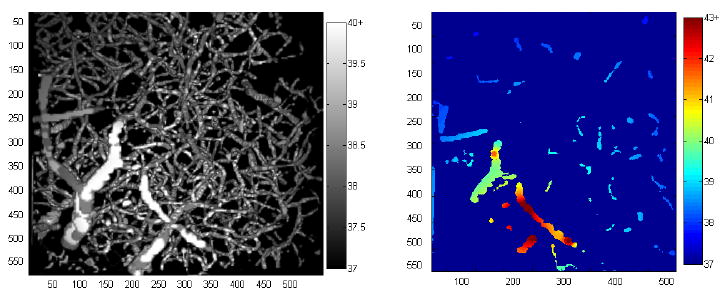
A grayscale 3D projection of the temperature distribution within the vessels, and a colour projection of the temperature within a single plane. The hotter areas near the bubble are easily discernable. Distance scale is in microns and temperature scale is degrees Celsius. The colour scale is chosen to saturate at different temperatures to highlight the distributions in each picture.
The temperature rose as a function of time. Viewing one plane as a function of time (figure 4), the temperature increases in the areas between the bubbles. The contribution of each individual heat source can be visualized and the effect of strongly and weakly oscillating bubbles observed. The fraction of the volume raised by one and two degrees can be seen in figure 5. The one degree fraction eventually levelled off as the majority of the volume reached that temperature. As a comparison, in the same amount of time, ultrasound with the same parameters heated the tissue by about 0.35 degrees.
Figure 4.
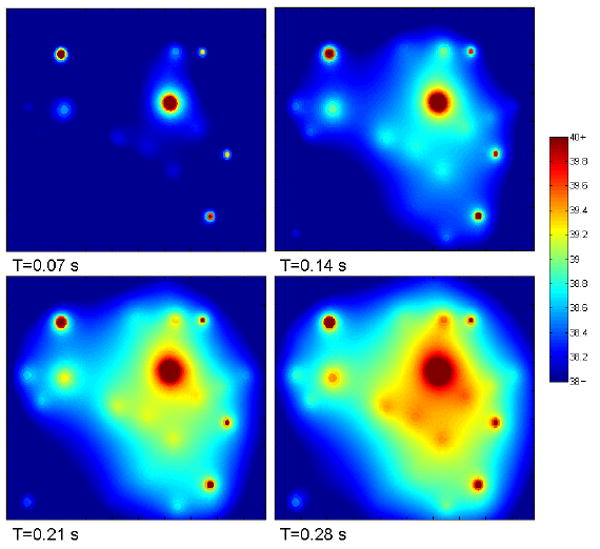
Spatial temperature map on a single plane as a function of time. Hotspots represent the approximate locations of bubbles. The bubble on the top-left is in-plane. The horizontal and vertical dimensions of each panel are approximately 600 microns.
Figure 5.
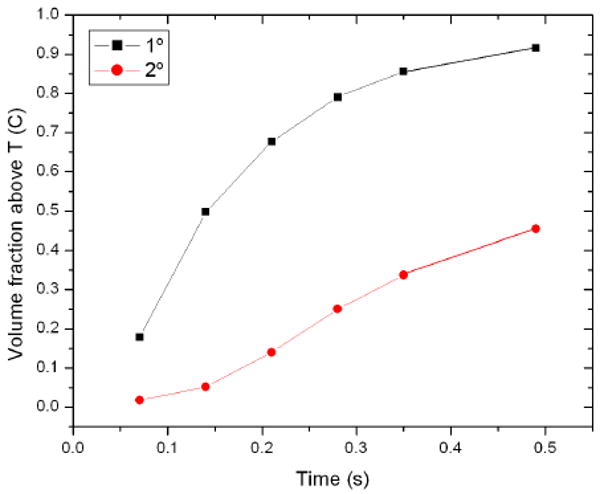
Fraction of the volume raised by 1 and 2 degree for 90 1.5-micron bubbles within the vessel grid insonated at 1 MPa and 1 MHz.
The simulations highlight why a model that takes into account the effect of the vasculature is necessary. While the simulations of the Zudin model show that after half a second the temperature has risen by 1-2 degrees, a value of the same order as experimental data, using the Rayleigh-Plesset equation with compressibility show that 85 percent of the tissue has risen by 20 degrees, which is much greater than what is observed.
The effect of concentration was evaluated by choosing bubbles using a random number generator. The volume of the blood in the volume is uncertain so the discrete number of bubbles is used as the independent variable. Using an approximate blood fraction of 0.05, the concentration varied between 3 and 13 million bubbles/mL. It is of note that the concentration here is calculated as the number of bubbles divided by the volume of the blood vessels, while in many published manuscripts the concentration cited is the concentration of the injected bolus. The fraction of the volume above a certain temperature can be seen in the figure 6. Temperature rises with increasing concentration, although there appears to be a threshold of around 50 bubbles, or 7E6 bubbles/mL for higher temperatures. The fraction does not rise in a monotone manner with concentration due to the random choice of bubbles; some may be oscillating more strongly than others.
Figure 6.
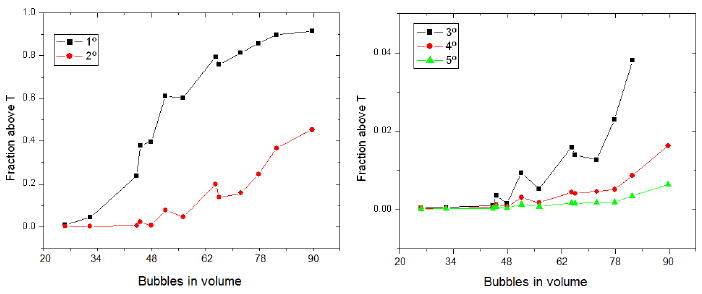
Fraction of the volume raised by 1 through 5 degrees for 1.5-micron bubbles within the vessel grid insonated at 1 MPa and 1 MHz as a function of the number of bubbles simulated within the volume. Approximate concentrations are between 3 and 13 million bubbles/mL.
The effect of bubble size is shown in figure 7 for a series of bubble size distributions centred about 1.5 microns in radius. The temperature rise is similar between the random distributions and the constant set. The T95 temperatures for a random distribution and constant radii of 1 and 1.5 microns are shown in figure 8 as a function of frequency, where the smaller bubbles are shown with a higher peak frequency and higher temperatures.
Figure 7.
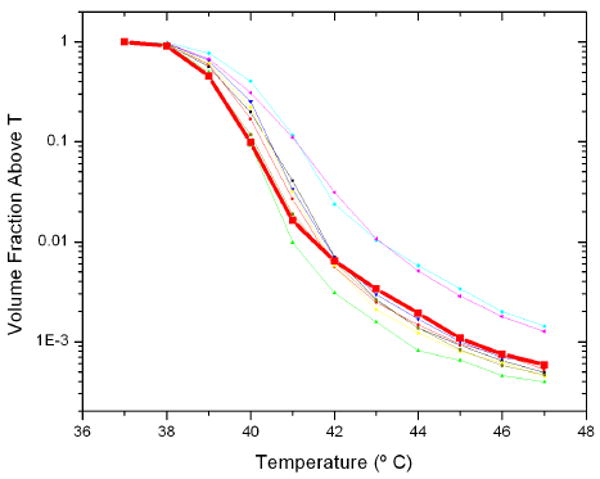
Volume fraction above a temperature as a function of temperature for bubbles insonated at 1 MHz and 1 MPa of radius 1.5 microns, and several random distributions centred about 1.5 microns. The thick curve corresponds to the effects uniform radius bubbles.
Figure 8.
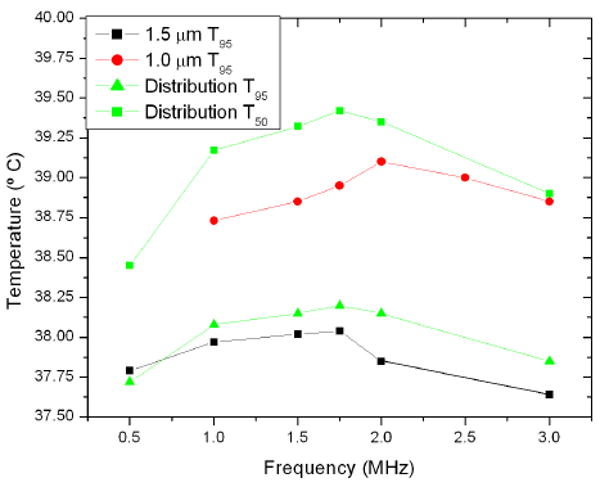
Temperature at which 95 percent of the volume is greater as a function of frequency for bubbles of size 1 micron, 1.5 microns, and a distribution centred about 1.5 microns. T50 for the random distribution is also shown.
The volume fraction above a given temperature as a function of temperature is shown in figure 9. As expected, a higher pressure tends to correspond with higher temperatures. The T95 and T50 of the volume as a function of pressure is seen in figure 10. The temperature again increases with pressure, with minor exceptions. The relationship is not linear. The T95 and T50 show similar patterns as a function of pressure.
Figure 9.
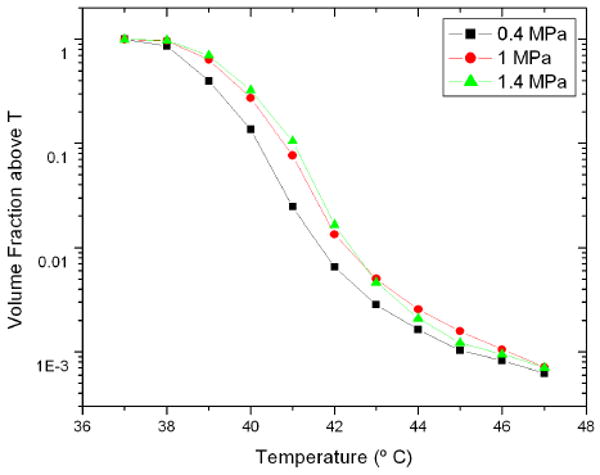
Volume fraction as a function of temperature for a random bubble distribution insonified at 1.5 MHz at various pressures. The vertical scale is logarithmic.
Figure 10.
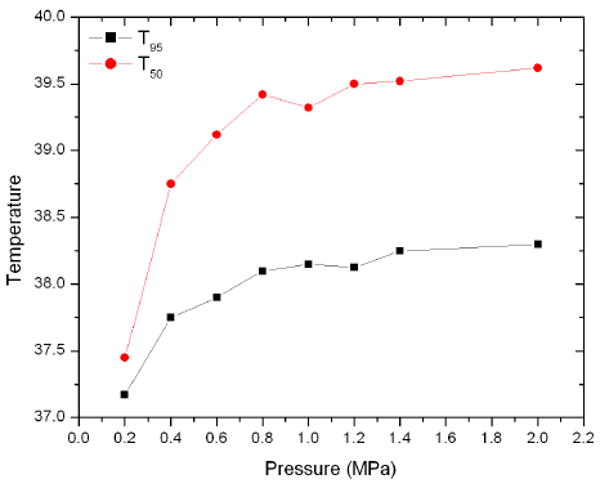
T95 and T50 as a function of pressure for a random bubble distribution insonified at 1.5 MHz.
5 Discussion
The simulations performed in this study utilized real microscopic vascular networks of mammalian brain and showed for the first time that intravascular microbubbles induce hotspots in tissue that act as heat sources and slowly heat the surrounding tissue. These results offer insights for the bubble-enhanced heating and may allow one to develop optimal parameters for such treatments. In addition, the hotspots may provide a method to selectively target the vasculature and may be at least partially responsible for the increased vessel wall permeability observed in vivo [7]. These hotspots may have applications in single-vessel acoustic cauterization for treatment of bleeding.
The algorithm developed during this study can map temperature data onto the microvasculature for an arbitrary bubble distribution. The infrastructure has been developed such that any heat source can have the resulting temperature mapped onto the volume. Other heat sources such as magnetic nanoparticle hyperthermia can be simulated on the capillary scale with the method developed herein.
The algorithm is such that any model can be used to calculate the power density of the bubbles. The Zudin model is a fast way to calculate the average power of the bubble, although it may not be the perfect tool. Other methods include finite element simulations or boundary integral computations. Any method that can calculate the radius as a function of time of an oscillating bubble can be input. Particularly, a method that accounts for the elasticity of the vessel wall, such as that of Miao and Gracewski[13] may be more appropriate. The current models of bubbles within tubes (e.g. [13],[18],[16]) calculate similar values for resonance frequency and amplitude of oscillation for given vessel geometry and set of acoustic parameters, but the effect of the different models on the heating patterns shown in this study are unknown. Future work will include calculating the average absorbed power for given vessel sizes using other models and comparing the results to those obtained from the Zudin model.
It is difficult to correlate the results of simulations over a volume smaller than a cubic millimetre to experimental results of widespread tissue heating. Sokka et al.[23] observed a temperature rise of about 5 degrees after several seconds using cavitation enhanced heating. However, the microbubbles were induced by a high power burst in the beginning of the sonications and thus did not utilize intravascular agent as was done in our study. McDanold et al [12] used contrast agent bubbles with ultrasound to measure the heating with MRI and found a 2 degree rise in the first 2.5 seconds (approximately). Similar temperatures are found in this study after a shorter time: half the volume rose 2 degrees after half a second, according to figure 4. The measured values are of similar magnitude as the simulated results, which is to be expected.
The resulting temperature distribution after each simulation is characterized by hotspots. Although the average temperature may have only risen by a few degrees, the voxels nearest each bubble location can be raised by dozens of degrees. The high temperature voxels are few and thus do not impact the fractional temperature rise data. This highlights the importance of investigating the effects of small-scale heterogeneity. With longer insonation time, the difference in temperature between the tissue and hotspots is expected to decrease. The simulation time was limited to 0.5 seconds due to computational limitations, future work will simulate over a longer heating time to verify this expected homogenization.
The concentration threshold seen in figure 6 may be due to the bubbles being too far apart at low concentration to synergistically heat the tissue between them. Above a certain concentration, approximately 6 or 7 million bubbles/mL, a global instead of local heating effect may be observed. The concentrtations simulated, of the order of 10 million bubbles/mL, are of similar order to concentrations used in vivo, given estimates for the dispersion of the injected bolus. For example, the concentration used in [12], if complete dispersion is assumed, goes from 800 million in bolus to 800 thousand in the vasculature, although over a small time scale near the injection site it would remain higher, within the range of the simulations in this study. A study comparing the concentration of acoustically detected bubbles within a small region to the concentration and number of bubbles in the injected bolus would be useful for comparing these simulations to experimental results.
The general relationship between applied pressure and heating is expected. The greater temperature rise with increasing acoustic power is shown in Sokka et al [23], who show that the temperature of a segment of rabbit thigh with bubbles generated by ultrasound increases reaches a higher temperature with higher power. Razansky et al [20] show that temperature rise increases with acoustic power: the temperature at a given time is approximately linear with the power given similar conditions. This would imply that temperature increase goes as the square of pressure, which is not seen in figure 10. The relationship between pressure and temperature is most positive at low pressures; at higher pressures increasing the pressure has less effect. This may be due to the strongly nonlinear oscillations of the bubbles at high pressure, where the effects of each parameter are so chaotic that higher pressure does not necessarily correspond to stronger oscillations. This is an interesting result and warrants further investigation. The threshold shows that increasing the pressure may not be necessary to achieve increased heating, meaning lower pressures can be used if bubbles are present: there is little added effect between 1.4 and 2.0 MPa. To put this in clinically relevant terms, the parameters used at the threshold, 0.8 MPa and 1.5 MHz give a clinically acceptable mechanical index of 0.65. Higher pressues of 2 MPa, while providing the same level of heating according to figure 10, increase the mechanical index to 1.6, approaching the clinical limit of 1.9. This is even more relevant at lower frequencies, where the same heating effect can be realized with pressures that allow a safe mechanical index with those that do not.
The results show that the frequency at which heating is greatest does not necessarily correspond with the resonance frequency of the bubble. There are many factors at play besides Rayleigh-Plesset style bubble dynamics, and the high pressures used do not allow the low amplitude linear oscillations required to calculate the Minnaert frequency. To fully investigate the effects of frequency the procedure must be modified to better take into account the size variation of the bubbles. From these results it can be seen that the frequency dependence is present but weak: the difference between on- and off-resonance heating is of the order of 0.25 degrees. The resonance frequency of 1.5 micron bubbles taking surface tension into account is approximately 2 MHz, while 1.5 MHz is observed, that the system does not diverge too significantly from the Minnaert resonance. There are two phenomena that may explain the decreased resonance frequency: the fact that the bubble is inside a vessel [22], and that high acoustic pressures depress a bubble's resonance frequency [9]. The frequency dependence warrants further research.
Based on the simulations performed, the ideal parameters for hyperthermia are a frequency of 1.5 MHz, pressures between 0.8 and 1.4 MPa, and an in-blood concentration on the order of 10 million bubbles per millilitre. This is at the higher end of parameters currently used in experiments, although higher pressures are used for hyperthermia.
Experimental verification of these results is being investigated. It is difficult to accurately and non-invasively measure temperatures at the micron scale. Microthermocouples would disturb the system, while MRI-thermometry lacks the necessary resolution. Eventual confirmation may be obtained using temperature-sensitive quantum dots in conjunction with fluorescence microscopy. This can be performed in vitro with gel phantoms, or in vivo with model organisms such as glass catfish.
Several assumptions made in this study must be considered. The power density was only taken as the viscous absorbed power, while the radiated power was ignored. A full model would take into account frequency-dependent absorption of secondary sound waves, which would increase the calculated average power of each bubble. This would result in increased tissue heating and thus, the results presented here may be conservative. The bubble dynamics model assumes rigid tubes, which does not accurately describe the walls of blood vessels. The dynamics of bubbles in non-rigid tubes are still under investigation [18] and there have not been any studies, to the authors' knowledge, into the dynamics of bubbles in winding tortuous tubes as opposed to cylinders. The sonication time was taken to be 0.5 seconds due to computation time limitations; longer sonications require that the effect of perfusion and convection be taken into account, which in addition to changing the heating pattern would cause the sources themselves to move, complicating the system. The bubbles during acoustic simulations were assumed to be in the geometric centre of each vessel, an assumption that will be improved upon in future work.
6 Conclusion
Microbubble oscillations were simulated in a 3D vascular network imaged in situ in a rodent somatosensory cortex. The heat absorbed due to the oscillations was calculated via the Pennes Bioheat Transfer Equation, and the resulting temperature was mapped onto the imaged tissue. Simulations show that temperature is highest in hotspots around the bubbles and increases over time throughout the entire tissue. Heating is increased with longer heating time, higher bubble concentration, higher acoustic pressure; and it shows a frequency dependent distribution. The heterogeneity in the temperature elevation is likely to have an impact on the bio-effects induced by microbubble enhanced treatments and needs to be taken into account when treatment effects are analyzed.
Acknowledgments
The authors wish to thank Aki Pulkinnen for his help with bioheat transfer simulations, the Terry Fox Foundation, and the National Institute of Health (grant number EB003268) for their generous funding.
References
- 1.Billard B, Hynynen K, Roemer R. Effects of physical parameters on high temperature ultrasound hyperthermia. Ultrasound in Medicine and Biology. 1990;16(4):409–420. doi: 10.1016/0301-5629(90)90070-s. [DOI] [PubMed] [Google Scholar]
- 2.Bull JL. The application of microbubbles for targeted drug delivery. Expert Opinion on Drug Delivery. 2007;4(5):475–493. doi: 10.1517/17425247.4.5.475. [DOI] [PubMed] [Google Scholar]
- 3.Chavrier F, Chapelon JY, Gelet A, Cathignol D. Modeling of high-intensity focused ultrasound-induced lesions in the presence of cavitation bubbles. The Journal of the Acoustical Society of America. 2000;108(1):432–440. doi: 10.1121/1.429476. [DOI] [PubMed] [Google Scholar]
- 4.Deckers R, Quesson B, Arsaut J, Eimer S, Couillaud F, Moonen CTW. Image-guided, noninvasive, spatiotemporal control of gene expression. Proceedings of the National Academy of Sciences. 2009;106(4):1175–1180. doi: 10.1073/pnas.0806936106. [DOI] [PMC free article] [PubMed] [Google Scholar]
- 5.Emmer M, van Wamel A, Goertz DE, de Jong N. The onset of microbubble vibration. Ultrasound in Medicine and Biology. 2007;33(6):941–949. doi: 10.1016/j.ultrasmedbio.2006.11.004. [DOI] [PubMed] [Google Scholar]
- 6.Hynynen K. The threshold for thermally significant cavitation in dog's thigh muscle in vivo. Ultrasound in Medicine and Biology. 1991;17(2):157–169. doi: 10.1016/0301-5629(91)90123-e. [DOI] [PubMed] [Google Scholar]
- 7.Hynynen K, McDannold N, Vykhodtseva N, Jolesz FA. Noninvasive MR Imaging-guided Focal Opening of the Blood-Brain Barrier in Rabbits. Radiology. 2001;220(3):640–646. doi: 10.1148/radiol.2202001804. [DOI] [PubMed] [Google Scholar]
- 8.W J. Temperature rise generated by ultrasound in the presence of contrast agent - comparison between theory and experiments. Ultrasound in Medicine and Biology. 1998 February;24(8):267–274. doi: 10.1016/s0301-5629(97)00246-9. [DOI] [PubMed] [Google Scholar]
- 9.MacDonald CA, Sboros V, Gomatam J, Pye SD, Moran CM, McDicken WN. A numerical investigation of the resonance of gas-filled microbubbles: resonance dependence on acoustic pressure amplitude. Ultrasonics. 2004;43(2):113–122. doi: 10.1016/j.ultras.2004.04.001. [DOI] [PubMed] [Google Scholar]
- 10.Marmottant P, Hilgenfeldt S. A bubble-driven microfluidic transport element for bioengineering. Proceedings of the National Academy of Sciences of the United States of America. 2004;101(26):9523–9527. doi: 10.1073/pnas.0307007101. [DOI] [PMC free article] [PubMed] [Google Scholar]
- 11.Marxen M, Henkelman RM. Branching tree model with fractal vascular resistance explains fractal perfusion heterogeneity. Am J Physiol Heart Circ Physiol. 2003;284(5):H1848–1857. doi: 10.1152/ajpheart.00510.2002. [DOI] [PubMed] [Google Scholar]
- 12.McDannold NJ, Vykhodtseva NI, Hynynen K. Microbubble Contrast Agent with Focused Ultrasound to Create Brain Lesions at Low Power Levels: MR Imaging and Histologic Study in Rabbits1. Radiology. 2006;241(1):95–106. doi: 10.1148/radiol.2411051170. [DOI] [PubMed] [Google Scholar]
- 13.Miao H, Gracewski S. Coupled fem and bem code for simulating acoustically excited bubbles near deformable structures. Computational Mechanics. 2008 April;42(12):95–106. [Google Scholar]
- 14.Morgan K, Allen J, Dayton P, Chomas J, Klibaov A, Ferrara K. Experimental and theoretical evaluation of microbubble behavior: effect of transmitted phase and bubble size. Ultrasonics, Ferroelectrics and Frequency Control, IEEE Transactions on. 2000 Nov;47(6):1494–1509. doi: 10.1109/58.883539. [DOI] [PubMed] [Google Scholar]
- 15.Needham D, Anyarambhatla G, Kong G, Dewhirst MW. A New Temperature-sensitive Liposome for Use with Mild Hyperthermia: Characterization and Testing in a Human Tumor Xenograft Model. Cancer Res. 2000;60(5):1197–1201. [PubMed] [Google Scholar]
- 16.Oguz HN, Prosperetti A. The natural frequency of oscillation of gas bubbles in tubes. The Journal of the Acoustical Society of America. 1998;103(6):3301–3308. [Google Scholar]
- 17.Pennes HH. Analysis of Tissue and Arterial Blood Temperatures in the Resting Human Forearm. J Appl Physiol. 1948;1(2):93–122. doi: 10.1152/jappl.1948.1.2.93. [DOI] [PubMed] [Google Scholar]
- 18.Qin S, Ferrara KW. Acoustic response of compliable microvessels containing ultrasound contrast agents. Physics in Medicine and Biology. 2006 Oct.51:5065–5088. doi: 10.1088/0031-9155/51/20/001. [DOI] [PMC free article] [PubMed] [Google Scholar]
- 19.Qin S, Ferrara KW. The natural frequency of nonlinear oscillation of ultrasound contrast agents in microvessels. Ultrasound in Medicine and Biology. 2007;33(7):1140–1148. doi: 10.1016/j.ultrasmedbio.2006.12.009. [DOI] [PMC free article] [PubMed] [Google Scholar]
- 20.Razansky D, Einziger P, Adam D. Enhanced heat deposition using ultrasound contrast agent - modeling and experimental observations. Ultrasonics, Ferroelectrics and Frequency Control, IEEE Transactions on. 2006 Jan.53(1):137–147. doi: 10.1109/tuffc.2006.1588399. [DOI] [PubMed] [Google Scholar]
- 21.H RG. Measurements of bubble-enhanced heating from focused, mhz-frequency ultrasound in a tissue-mimicking material. Ultrasound in Medicine and Biology. 2001 October;27(14):1399–1412. doi: 10.1016/s0301-5629(01)00438-0. [DOI] [PubMed] [Google Scholar]
- 22.Sassaroli E, Hynynen K. Resonance frequency of microbubbles in small blood vessels: a numerical study. Physics in Medicine and Biology. 2005;50(22):5293–5305. doi: 10.1088/0031-9155/50/22/006. [DOI] [PubMed] [Google Scholar]
- 23.S SD. Mri-guided gas bubble enhanced ultrasound heating in in vivo rabbit thigh. Physics in Medicine and Biology. 2003;48(19):223–241. doi: 10.1088/0031-9155/48/2/306. [DOI] [PubMed] [Google Scholar]
- 24.Sheikov N, McDannold N, Vykhodtseva N, Jolesz F, Hynynen K. Cellular mechanisms of the blood-brain barrier opening induced by ultrasound in presence of microbubbles. Ultrasound in Medicine and Biology. 2004;30(7):979–989. doi: 10.1016/j.ultrasmedbio.2004.04.010. [DOI] [PubMed] [Google Scholar]
- 25.Silcox C. The use of ultrasound to facilitate the delivery of genetic-based therapeutic strategies. 2004. [Google Scholar]
- 26.Stefanovic B, Hutchison E, Yakovleva V, Schram V, Russell JT, Belluscio L, Koretsky AP, Silva A. Functional reactivity of cerebral capillaries. Journal of Cerebral Blood Flow and Metabolism. 2007;28:961–972. doi: 10.1038/sj.jcbfm.9600590. [DOI] [PMC free article] [PubMed] [Google Scholar]
- 27.Umemura S, Kawabata K, Hashiba K. Enhancement of ultrasonic absorption by microbubbles for therapeutic application. Ultrasonics Symposium, 2001 IEEE; 2001. pp. 1311–1314. [Google Scholar]
- 28.Zudin YB. Analog of the rayleigh equation for the problem of bubble dynamics in a tube. Journal of Engineering Physics and Thermophysics. 1992 July;63:672–675. [Google Scholar]