

Abstract
The first in vivo sodium and proton MR images and localized spectra of rodents were attained using the wide bore (105 mm) high resolution 21.1 T magnet, built and operated at the National High Magnetic Field Laboratory (Tallahassee, FL). Head images of normal mice (C57BL/6J) and Fisher rats (~ 250 g) were acquired with custom designed RF probes at frequencies of 237/900 MHz for sodium and proton, respectively. Sodium MRI resolutions of ~0.125 μL for mouse and rat heads were achieved by using a 3D back-projection pulse sequence. A gain in SNR of ~ 3 for sodium and of ~ 2 times for proton were found relative to corresponding MR images acquired at 9.4 T. 3D FLASH proton mouse images (50×50×50 μm3) were acquired in 90 min and corresponding rat images (100×100×100 μm3) within a total time of 120 min. Both in vivo large rodent MR imaging and localized spectroscopy at the extremely high field of 21.1 T are feasible and demonstrate improved resolution and sensitivity valuable for structural and functional brain analysis.
Keywords: high magnetic field, in vivo rodent, MRI, sodium, localized spectroscopy
Introduction
High magnetic fields expand our capability to observe and investigate in vivo biomedical processes via magnetic resonance of protons, sodium and other nuclei. Enhanced sensitivity and high resolution are especially attractive for many time-limited in vivo MRI studies particularly for sodium MRI (1–12) and in vivo localized spectroscopy (13–17). The unique combination of the high magnetic field (21.1 T) and wide bore (105 mm) of the magnet built at the National High Magnetic Field Laboratory (NHMFL) represents an advancement in MR technology development and new opportunities for MR imaging (18).
The increase of magnetic field strength has multiple effects on the results of MR imaging (19–24). First of all, a gain in MR sensitivity is expected, leading to an increased resolution of MR imaging within a decreased acquisition time. Another feature of high magnetic fields involves the increased susceptibility effects which are proportional to the square of the magnetic field (20). These effects can be used to enhance sensitivity to a variety of dynamic or functional in vivo changes. However, these simultaneously bring additional challenges for MRI.
The ultra-high field MR imaging at the NHMFL was attained utilizing multiple steps in assessing and developing the essential experimental design. The increased resonance frequency combined with the size needed to accommodate in vivo large rodents makes the RF coil design a technically demanding project, with additional difficulties being created by the vertical orientation and considerable bore length of this magnet. Recent literature describes the use of single surface coils (25) and surface coils arrays for small animal imaging at 17.6 T (26,27). Here we show that volume coils can be used to achieve good results at 900 MHz.
In vivo proton localized spectroscopy as well as proton and sodium MR imaging of the mouse and rat brain have been accomplished using this large magnet and are presented below.
Methods
The vertical, unshielded 21.1 T magnet was designed and constructed at the NHMFL, Tallahassee, Florida (18,28). The magnet has a warm bore of 105 mm and is outfitted with an 18-channel room-temperature shimming insert (Resonance Research, Inc., Billerica, MA) that creates a homogeneous area for MR imaging with a diameter of ~ 40 mm and length of ~ 50 mm. This magnet is equipped with a Bruker Avance console operated by ParaVision 5.0 and TopSpin 2.0 software.
Normal mice (C57BL/6J, ~ 30 g) were initially selected as subjects for investigating the new MR imaging capabilities. Mouse imaging was performed using the Bruker actively shielded Micro-2.5 gradient coil with an internal diameter (ID) of 40 mm. In this case, Bruker Great60 gradient amplifiers had the capability to create a maximum gradient strength of 1.5 T/m with a rise time of 100 μs. Both proton (900 MHz) and sodium (237 MHz) mouse RF coils were implemented as single frequency inductively coupled Alderman-Grant (AG) designs (29). The internal diameters and lengths of the mouse sodium and proton RF coils were 17.5 and 25 mm, respectively.
To assess the capability to perform MR imaging of large rodents, Fisher rats (~ 175 g) were chosen. Rat MR imaging was achieved using the Bruker Mini-0.75 actively shielded gradient coil (ID = 57 mm) that produces 0.45 T/m with Bruker Avance hardware. Large rodent MR imaging was performed with AG coils with an ID of 33 mm and length of 45 mm. Additional capacitive gaps were inserted into the proton coil to reduce the wavelength effects. All RF coils were equipped with the appropriately sized bite bar for either mouse or rat experiments. The bite bar was used to suspend the rodent vertically by the fore teeth, and additional body restraints were used to limit motion and provide support. Each RF probe could accommodate a rodent having a weight of up to ~ 300 g and employed either a water heated blanket or warm air circulation to help the animals maintain their body temperature within the magnet.
Physiological monitoring of the animal was performed through the integration of a Small Animal Monitoring and Gating System (Model 1025, SA Instruments, Inc., Stony Brook, NY) capable of recording respiration, body temperature, electrocardiogram and other parameters. The animal’s breathing rate was continuously monitored and recorded during scanning using a pressure sensitive sensor-pad. No physiological triggering was used during MRI scans. Animals were anesthetized during MR scanning using a 1.5 % isoflurane mixed with oxygen. The mixture was supplied with the rate of ~ 2 L/min through the hollow bite bar directly to the mouth and nose of the animal. Inside the RF coil the mixture was blended with incoming air and all gases were evacuated away at the edge of the coil, preventing their release in the surrounding areas. Animal experiments were conducted according to the protocols approved by the Florida State University Animal Care and Use Committee ACUC. Image processing was performed using ParaVision 4.0, Matlab 7.5 and Analyze 8.1 software.
Proton MRI
For mouse head imaging, three sets of coronal multi-slice images of a mouse head were obtained with an in-plane resolution of 50×50 μm, a slice thickness of 100 μm and an inter-slice gap of 50 μm. The images were acquired using a 2D gradient-recalled echo pulse sequence (FLASH-Fast Low Angle Shot) with repetition/(echo time) TR/TE = 750/5.4 ms, flip angle 30°, number of slices (NS) = 35, field of view (FOV) = 17 × 15 mm2, matrix = 340 × 300, spectral width (SW) = 50 kHz and number of accumulations (NA) = 8. To cover continuously the space, the second and third datasets were acquired, while being shifted 50 μm and 100 μm, respectively, in the slice direction. Three datasets acquired during acquisition, were interleaved to form one isotropic 3D image with an apparent resolution of 50 μm in the slice direction and a true resolution of 50 μm in the other two directions. The acquisition time for each multi-slice set was ~ 30 min.
For rat head imaging, the same approach was applied and the three sets of coronal images of the rat head were obtained using a gradient-recalled echo pulse sequence with TR/TE = 1200/5.57 ms, NS = 27, FOV = 30 × 26 mm2, matrix = 300 × 260 and NA = 8. The in-plane resolution was 100 × 100 μm, the slice thickness was 200 μm, and the gap between slices was 100 μm. As with mouse imaging, the positions of the second and third multi-slice set of images were shifted relative to the first image set by 100 μm and 200 μm, respectively, to achieve an apparent resolution of 100 μm in a slice direction.
Sodium MRI
Mouse sodium MR images were acquired using a gradient-recalled echo 3D back-projection pulse sequence. Asymmetrical echo acquisition (P = 20 %) was used to achieve an echo time of 1.3 ms in order to capture a maximum of the sodium signal. The other imaging parameters included a number of complex points in readout (RO) direction NP = 64, a total of 64 planes containing 64 profiles each were acquired with FOV = 32 mm, SW = 20 kHz, TR = 60 ms, NA = 16. A comparable set of parameters were used for rat sodium imaging. It was also performed using a back-projection 3D pulse sequence with a matrix of 128 complex points in the RO direction and 64 × 64 orientations, FOV = 64 mm, SW = 30 kHz, TR/TE = 80/1.3 ms and NA = 16.
Localized MR Spectroscopy
The following parameters were used for acquisition: voxel size was 43 μL, TR/TE = 5000/19.7 ms, NA = 256, SW = 6 kHz, NP = 8192, three Hermite RF pulses were used with pulse duration of 0.51/0.45 ms for 90 and 180 degree pulses, respectively. The bandwidth of 90 and 180 degree pulses was 10.6 kHz and 7.6 kHz, respectively, to provide the coverage of a whole spectrum. Water suppression was performed by the Bruker provided VAPOR (variable pulse power and optimized relaxation delays) method (30) and no outer volume suppression was used. Exponential line broadening of 8 Hz was applied before Fourier transformation to produce a final spectrum.
Comparison of Proton and Sodium MRI between 9.4 T and 21.1 T
Sodium MR imaging experiments were performed for both a test sample and for an in vivo rat head. The test sample was a 60 mL vial with 0.225% saline solution (39 mmol/L). The comparable size of rat (~200 g) was used during in vivo sodium imaging. Sodium images at 9.4 T MRI scanner (Varian, Palo Alto, CA USA) were acquired using the same type of 3D back-projection pulse sequence as for the 21.1 T. At 9.4 T a double tuned RF coil was used with an internal diameter of 34 mm (Doty Scientific, Columbia, SC, USA). The sodium imaging parameters were FOV = 64 mm, SW = 10 kHz, acquisition of single profile in RO direction was accomplished by 64 complex points and 128 × 128 projections were acquired, at TR/TE = 100/1.1 ms and NA = 4.
The differences in proton MRI between two fields were evaluated only for a rat head in vivo using a multi-slice spin echo pulse sequence. The acquisition parameters were FOV 35×35 mm2, SW = 58 kHz, matrix 256 × 256, slice thickness = 0.41 mm, inter-slice distance = 0.6 mm, TR/TE = 5300/18 ms, both RF pulses were three-lobe sinc pulses with a duration of 2 ms.
Results
In vivo Rodent Proton and Sodium Imaging
The results of high resolution mouse proton MR imaging are presented on Fig. 1. The large blood vessels can be seen in detail going throughout the brain, including the intensive areas from the ventricles. The continuous multi-slice coverage in the slice direction allowed for a dramatic (~10 times) decrease in the total acquisition time relative to a comparable standard 3D acquisition time, while still preserving the high signal intensity from the voxels. This time reduction is especially advantageous for in vivo applications where the time for imaging is inevitably limited. An average signal to noise ratio (SNR) of 38 was achieved for this type of mouse brain proton imaging.
Fig. 1.

Gradient recalled (FLASH) proton in vivo MR image of a mouse head, in plane resolution for image is 50 × 50 μm2 and an apparent resolution in third direction of 50 μm.
Sodium mouse images were acquired with an echo time of 1.3 ms (Fig. 2). The brain has noticeably increased its sodium content relative to the surrounding areas, and the large sodium content can also be seen in the ventricles and eyes. There was no detrimental effect from the asymmetric acquisition time on the sodium MR resolution; yet, a minor improvement in resolution was observed. However, at the very short echo times some distortions of the images could appear and, thus, the echo times below TE = 1.1 ms were usually avoided. A resolution of ~ 0.125 μL was achieved within a total acquisition time of 55 min. The average SNR for sodium in a mouse brain was 28.
Fig. 2.

Sodium in vivo 3D back-projection MR image of a mouse head at 21.1 T. Isotropic 3D resolution was ~ 0.125 mm3.
The rat proton MR images were acquired using the same aforementioned multi-slice acquisition mode (Fig. 3 A, B). Both 3D images show the presence of multiple small blood vessels detected as dark spots throughout the brain and demonstrate the capability of the present high resolution imaging at different parts of the rat head. The acquisition time for each set of images was ~ 41 min. The average SNR throughout the rat brain was 42.
Fig. 3.
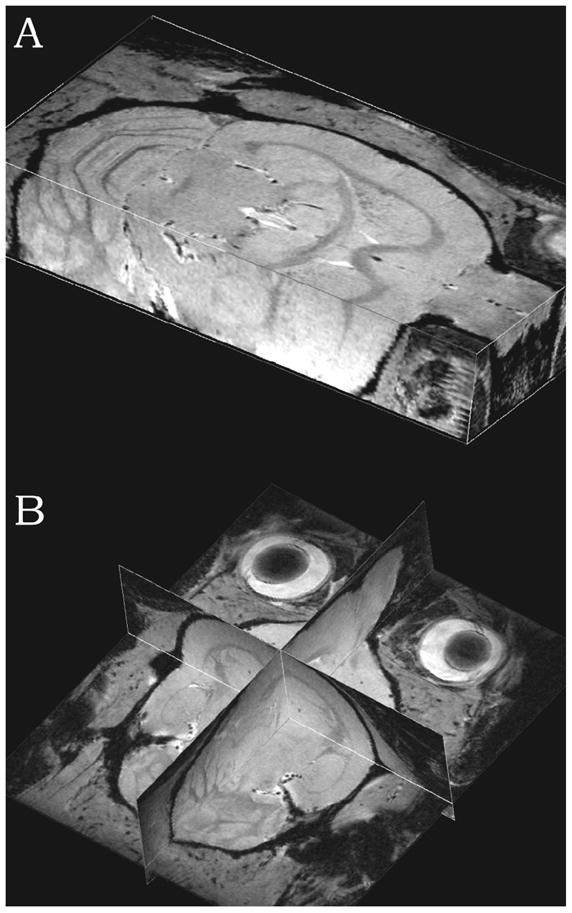
(A, B). (A) and (B) 3D proton gradient recalled (FLASH) MR image of rat head with in plane resolution of 100 × 100 μm2 and an apparent resolution in third direction of 100 μm. Multiple hypo-intensity dots represent large and small blood vessels.
Rat sodium MRI was performed with a resolution of ~0.125 μL, the same as for mouse imaging (Fig. 4). Increased sodium content in the brain, ventricles and even the large blood vessels around the brain can be seen. The total acquisition time was 87 min. The average SNR of 47 was found for the rat brain in this sodium image set.
Fig. 4.

(A, B). Sodium in vivo 3D back-projection MR image of rat head, spatial resolution was 0.125 mm3, (A) 3D view, (B) 2D view. High sodium content in brain cortex can be noticeable.
Rat Brain in vivo Localized Spectroscopy
An in vivo localized PRESS (Point Resolved Spectroscopy) spectrum was acquired from the rat head, also using the volume RF coil which was covering the entire head of the rat. The voxel of 43 μL was placed within the striatum, laterally to the rat brain midline, excluding the lateral ventricles. The total scan time was 21 min (Fig. 5). Three experiments with three different animals were performed and a typical spectrum is presented in Fig. 5. A wide separation between metabolites is the most attractive feature of the spectrum. The voxel average water line width was ~ 35 Hz. It usually required FASTMAP shimming for a larger voxel size followed by a manual shim adjustment for the final voxel. Provisional assignment of MR peaks was made in accordance with published data (16).
Fig. 5.
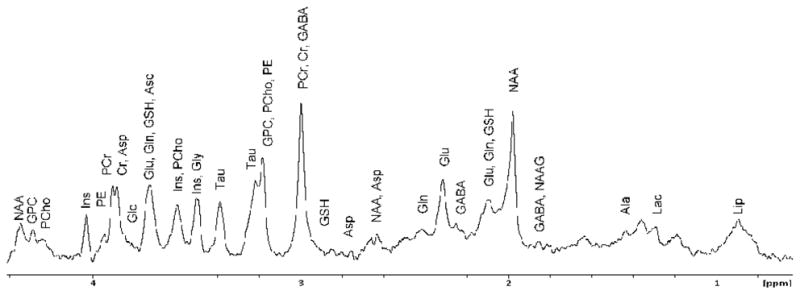
In vivo MR PRESS localized spectrum in rat brain, voxel size was 43 μL. Metabolites in the MR spectrum are lactate (Lac), alanine (Ala), γ–aminobutyrate (GABA), N–acetylaspartylglutamate (NAAG), N-acetylaspartate (NAA), glutamate (Glu), glutamine (Gln), glutathione (GSH), aspartate (Asp), creatine (Cr), phosphocreatine (PCr), glycerophosphocholine (GPC), phosphocholine (PCho), phosphoethanolamine (PE), taurine (Tau), myo-Inositol (Ins), glycine (Gly), ascorbate (Asc), glucose (Glc).
Comparison of Sodium and Proton MRI at 9.4 and 21.1 T
The gain in sensitivity was first evaluated for sodium MRI using a 60 ml vial with 0.225% saline solution. The concentration of sodium in the test sample was chosen because it is comparable to the in vivo sodium brain concentration (~45 mM). Thus, the RF coil load was similar to the load for the rat head in vivo. The same test sample was used at both magnetic fields including the same parameters for the 3D back-projection pulse sequence. For a scan time of 28 min, the SNR at 9.4 T was 32 while for the 21.1 T it was 109. The RF coil at 9.4 T was the “Doty Scientific” double-tuned Litz coil. The estimated efficiency for sodium detection was ~90% relative to a single tuned RF coil at the same frequency (private communication, F.D. Doty). Taking this judgment into consideration, the resulting gain in sodium sensitivity was a factor of 3.1.
In vivo sodium MR images of rats gave another and more relevant measure of the sodium sensitivity gain between these two magnetic fields (Fig. 6). The MR imaging parameters were the same as for the saline solution and the same for both magnetic fields. A noticeable advantage in sensitivity can be seen in the sodium image acquired at 21.1 T (Fig. 6A). The sodium SNR within the striatum of the rat brain was 112 at 21.1 T and 34 at 9.4 T. Again taking into consideration the 0.9 efficiency factor for the double tuned sodium coil used at 9.4 T, the SNR gain at 21.1 T for in vivo rat sodium MRI is ~3.0.
Fig. 6.
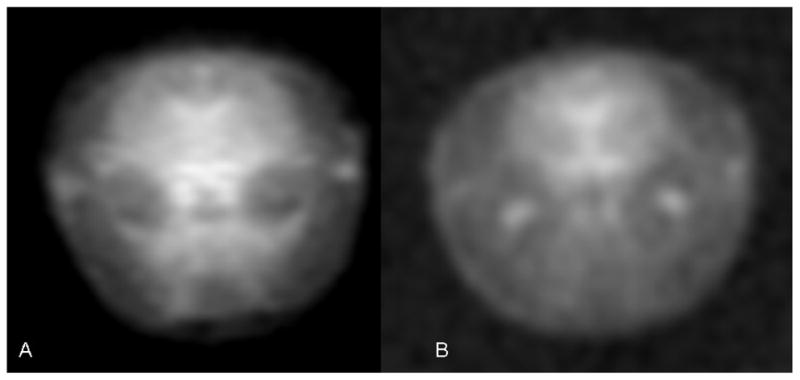
(A, B). In vivo sodium MRI of rat head at 21.1 T (A) and 9.4 T (B). Both MRI images were acquired using back-projection pulse sequence with the same imaging parameters. The isotropic resolution of images was ~1 mm3..
The gain in proton sensitivity at 21.1 T was evaluated only for in vivo MRI experiments shown in Fig. 7. A reasonable co-registration was used to present the same part of the animal brain from two different scans. At the same MRI parameters, the 21.1 T image demonstrates more small features inside the brain which can be seen, for example, as multiple lines and dots from different blood vessels. For striatum of the rat brain, proton SNR at 21.1 T was measured to be 83, while at 9.4 T, it was only 30. The double-tuned 9.4-T RF coil used in this study had a proton channel with an efficiency of about 75% relative to a single tuned proton coil of the same size (private communication, F.D. Doty). Thus, the final gain in proton sensitivity is approximately 2.1.
Fig. 7.

(A, B). In vivo proton MRI of rat head at 21.1 T (A) and 9.4 T (B). Both MRI images were acquired using spin echo pulse sequence and the same imaging parameters. The resolution of images was 0.137×0.137×0.41 mm3.
The difference in sodium T1 relaxation times between 21.1 T and 9.4 T were evaluated using a saturation recovery method. For sodium saline solution of 0.9 % (155 mmol/L) the fitting of the data with an exponential function gave a 23Na T1 of 54.2 ± 0.4 ms. At 9.4 T the T1 relaxation time for the same saline sample was 53.1 ± 0.9 ms (n=3). The double tail p value (ANOVA) is 0.89 here indicating that the difference between these T1 values is statistically non-significant.
For in vivo T1 measurements, a sodium signal from a whole head was used. The sodium T1 relaxation curve was fitted by a single exponential function and yielded a T1 of 39.1 ± 0.6 ms at 21.1 T. For the 9.4 T magnet, the corresponding measurement gave T1 of 39.5 ± 0.7 ms (n = 3). The in vivo difference in sodium T1 was again statistically non-significant (p = 0.8).
Discussion
Proton MRI
The MR images presented in this study demonstrate the initial results using an ultra high field of 21.1 T for the in vivo studies of rodents. MR images at a high magnetic field yielded enhanced resolution and the capability to detect many small brain features. The resolution of the proton MR images was sufficient to identify blood vessels in the mouse brain with a diameter of ~ 100 μm, which can be seen throughout the brain as areas with signal hypo-intensities (Fig. 1). Rat proton images (Fig. 7) demonstrate a more enhanced sensitivity to the susceptibility differences (or T2*) inside an animal brain at 21.1 T, which may help in distinguishing brain anatomy features. No motion compensation was used in the present imaging experiments, thus, some blur of MR images could be present because of the incidence of in vivo motion (31).
It was our intention to reach a maximum available resolution using a volume coil during the limited time available in vivo. The selected resolutions of our MRI scans were limited by two factors. The first factor was our gradient coil which did not allow us to have less than a 50 μm (mouse) or 100 μm (rat) slice thickness for a long scan time. Secondly, the close spacing of thin slices was introducing extra losses to the MR signal. The implementation of three multi-slice set imaging allowed us to achieve the currently presented resolution. Further improvement in resolution could be reached by using a surface coil or multi-coil RF probe design.
All animals were sedated during the MRI experiments and no visible changes in their behavior were observed after our MRI scans. Nevertheless, the effects of strong magnetic fields on rodents are unknown, especially without anesthesia, and therefore, are under investigation by others (32,33).
Sodium MRI
High resolution sodium images of the mouse demonstrate a large variability in sodium intensity throughout the mouse and rat brains. An increase in sodium is noticeable at the edges of the brain in the cortex areas. The most intense sodium signals can be seen in the ventricular cerebrospinal fluid (CSF), large blood vessels and eyes.
Measurements of sodium T1 relaxation times at two different fields showed practically no change in relaxation times for saline, as well as for in vivo sodium, in vivo. Thus, at short echo times, usually used for sodium MRI, it is anticipated that the high field sodium images will gain mainly in sensitivity and the sodium image contrast will be unaffected (Fig. 6). The absence of field dependence in T1 relaxation time can often be found in situations when the relaxation mechanism is based on the modulation of quadrupolar interactions (34) and was also demonstrated for 17O (35).
It was especially interesting to obtain the initial valuation of the high field gain in sensitivity for both sodium and proton MRI. The in vivo RF coil load for sodium is usually less than for proton and the corresponding SNR gain was expected to be higher for sodium than for proton MRI. It was anticipated that the sensitivity gain for sodium would have a field dependence greater than B0 and less than B07/4 (36). In other words, the sodium MR signal sensitivity at 21.1 T was expected to be greater than 2.2 and less than 4.1 times relative to the 9.4 T. Thus, for the measured high field sensitivity, gains for sodium in saline solution and during the in vivo rat MRI were well within the expected range. However, for nuclei with low gyro-magnetic ratios, one can still expect close to the power of 7/4 enhancement in sensitivity with the magnetic field as was observed for oxygen by others (35). The high field gain in proton sensitivity was 2.1 which is slightly less than 2.25, which is expected from linear gain with field strength (37).
PRESS Localized Spectroscopy
The large frequency range of the proton MR spectrum at 21.1 T requires short and high power for RF pulses to cover the entire frequency range without losses. Very short RF pulses of 0.41 ms and power transmission of 1 kW were used in our case. The use of a volume coil resulted in a lower sensitivity than would be expected for a surface coil. However, these experiments illustrate the main features of in vivo spectrum at 21.1 T. Sensitivity could be further improved by using corresponding surface RF coils which was beyond our initial goals. In comparison to the 9.4 T (30,38) more metabolites close to the water peak can be detected at 21.1 T, such as separate peaks for phosphocholine (PCho) and GPC, as well as NAA peak. Our first localized spectra are comparable to the results received at 14.1 T, but in their case a surface RF coil was used for MR detection (16). Typical water line at 21.1 T was ~35 Hz, which is much larger than a corresponding value of ~17 Hz at 14.1 T (16) for a comparable voxel size of ~50 μL. It is also noticeable that line width of metabolites are larger at 21.1 T than at 9.4 T. This tendency could be expected because of an increased contribution of susceptibility differences to MR signals from the brain tissue. However, the large splitting between metabolites and sensitivity are encouraging. We anticipate that an improved line width could be attained at 21.1 T by using more powerful second order shims. The currently used second order shims were several times weaker than the suggested custom designed shims used at 9.4 T by others (38). Altogether, MR localized spectra in vivo demonstrate a reproducible performance of an ultra high field magnet of 21.1 T.
Conclusion
In vivo sodium and proton MR images of small and large rodents together with PRESS rat brain localized spectroscopy were attained using the ultra high magnetic field of 21.1 T. The high resolution in vivo MR images demonstrate the advanced MR sensitivity and imaging resolution which can be achieved in the limited time available for in vivo studies. The novel MR imaging capabilities are especially advantageous for non-proton nuclei, where the gains in sensitivity are much higher than for proton. The very important feature of the present 21.1 T magnet is its wide bore. Rat animal models are often used in many biomedical research projects. The capability to perform in vivo imaging of large animals, such as rats, at an ultra high magnetic field is expanding the frontiers for biomedical research. The NHMFL is a user facility and its high field MR imaging capabilities are available to scientists by means of a formal proposal submission and approval process.
Acknowledgments
The authors are grateful to Ashley K. Blue, Richard L. Desilets, Nathaniel Falconer, Jason Kitchen and Kiran K. Shetty for their technical support. Special thanks to Prof. Gregory S. Boebinger and Prof. Timothy A. Cross (NHMFL) for stimulating discussions. Many thanks to Prof. Thomas L. Chenevert and Prof. Brain D. Ross (University of Michigan, Ann Arbor) for consent to use the 9.4 T proton and sodium data. The authors appreciate the kind support of our colleagues Barbara Beck, Dan Clark, Dr. Stephen J. Blackband and Dr. Arthur S. Edison (AMRIS, Gainesville). WWB thanks Prof. Andrew Webb (Penn State) for helpful discussions. Thanks to Dr. F. David Doty for providing data on the 9.4 T double tuned Litz coil. The in vivo rodent studies were supported by NIH Grant R21 CA119177 and partially by U24-CA083099, P50-CA093990 and P01-CA085878. This work was supported by NSF Cooperative Agreement DMR-0084173 and the State of Florida.
Footnotes
Publisher's Disclaimer: This is a PDF file of an unedited manuscript that has been accepted for publication. As a service to our customers we are providing this early version of the manuscript. The manuscript will undergo copyediting, typesetting, and review of the resulting proof before it is published in its final citable form. Please note that during the production process errors may be discovered which could affect the content, and all legal disclaimers that apply to the journal pertain.
References
- 1.Benveniste H, Einstein G, Kim KR, Hulette C, Johnson GA. Detection of neuritic plaques in Alzheimer’s disease by magnetic resonance microscopy. Proc Natl Acad Sci U S A. 1999;96(24):14079–14084. doi: 10.1073/pnas.96.24.14079. [DOI] [PMC free article] [PubMed] [Google Scholar]
- 2.Wengenack TM, Jack CR, Jr, Garwood M, Poduslo JF. MR microimaging of amyloid plaques in Alzheimer’s disease transgenic mice. Eur J Nucl Med Mol Imaging. 2008;35 (Suppl 1):S82–88. doi: 10.1007/s00259-007-0706-9. [DOI] [PubMed] [Google Scholar]
- 3.Duyn J, Koretsky AP. Magnetic resonance imaging of neural circuits. Nat Clin Pract Cardiovasc Med. 2008;5 (Suppl 2):S71–78. doi: 10.1038/ncpcardio1248. [DOI] [PMC free article] [PubMed] [Google Scholar]
- 4.Benveniste H, Ma Y, Dhawan J, Gifford A, Smith SD, Feinstein I, Du C, Grant SC, Hof PR. Anatomical and functional phenotyping of mice models of Alzheimer’s disease by MR microscopy. Ann N Y Acad Sci. 2007;1097:12–29. doi: 10.1196/annals.1379.006. [DOI] [PubMed] [Google Scholar]
- 5.Choi IY, Lee SP, Guilfoyle DN, Helpern JA. In vivo NMR studies of neurodegenerative diseases in transgenic and rodent models. Neurochem Res. 2003;28(7):987–1001. doi: 10.1023/a:1023370104289. [DOI] [PubMed] [Google Scholar]
- 6.Jack CR, Jr, Marjanska M, Wengenack TM, Reyes DA, Curran GL, Lin J, Preboske GM, Poduslo JF, Garwood M. Magnetic resonance imaging of Alzheimer’s pathology in the brains of living transgenic mice: a new tool in Alzheimer’s disease research. Neuroscientist. 2007;13(1):38–48. doi: 10.1177/1073858406295610. [DOI] [PubMed] [Google Scholar]
- 7.Maril N, Rosen Y, Reynolds GH, Ivanishev A, Ngo L, Lenkinski RE. Sodium MRI of the human kidney at 3 Tesla. Magn Reson Med. 2006;56(6):1229–1234. doi: 10.1002/mrm.21031. [DOI] [PubMed] [Google Scholar]
- 8.Christensen JD, Barrere BJ, Boada FE, Vevea JM, Thulborn KR. Quantitative tissue sodium concentration mapping of normal rat brain. Magn Reson Med. 1996;36(1):83–89. doi: 10.1002/mrm.1910360115. [DOI] [PubMed] [Google Scholar]
- 9.Thulborn KR, Davis D, Adams H, Gindin T, Zhou J. Quantitative tissue sodium concentration mapping of the growth of focal cerebral tumors with sodium magnetic resonance imaging. Magn Reson Med. 1999;41(2):351–359. doi: 10.1002/(sici)1522-2594(199902)41:2<351::aid-mrm20>3.0.co;2-h. [DOI] [PubMed] [Google Scholar]
- 10.Thulborn KR, Gindin TS, Davis D, Erb P. Comprehensive MR imaging protocol for stroke management: tissue sodium concentration as a measure of tissue viability in nonhuman primate studies and in clinical studies. Radiology. 1999;213(1):156–166. doi: 10.1148/radiology.213.1.r99se15156. [DOI] [PubMed] [Google Scholar]
- 11.Kalyanapuram R, Seshan V, Bansal N. Three-dimensional triple-quantum-filtered 23Na imaging of the dog head in vivo. J Magn Reson Imaging. 1998;8(5):1182–1189. doi: 10.1002/jmri.1880080527. [DOI] [PubMed] [Google Scholar]
- 12.Alecci M, Romanzetti S, Kaffanke J, Celik A, Wegener HP, Shah NJ. Practical design of a 4 Tesla double-tuned RF surface coil for interleaved 1H and 23Na MRI of rat brain. J Magn Reson. 2006;181(2):203–211. doi: 10.1016/j.jmr.2006.04.011. [DOI] [PubMed] [Google Scholar]
- 13.Tkac I, Dubinsky JM, Keene CD, Gruetter R, Low WC. Neurochemical changes in Huntington R6/2 mouse striatum detected by in vivo 1H NMR spectroscopy. J Neurochem. 2007;100(5):1397–1406. doi: 10.1111/j.1471-4159.2006.04323.x. [DOI] [PMC free article] [PubMed] [Google Scholar]
- 14.Mangia S, Giove F, Tkac I, Logothetis NK, Henry PG, Olman CA, Maraviglia B, Di Salle F, Ugurbil K. Metabolic and hemodynamic events after changes in neuronal activity: current hypotheses, theoretical predictions and in vivo NMR experimental findings. J Cereb Blood Flow Metab. 2009;29(3):441–463. doi: 10.1038/jcbfm.2008.134. [DOI] [PMC free article] [PubMed] [Google Scholar]
- 15.Morgenthaler FD, van Heeswijk RB, Xin L, Laus S, Frenkel H, Lei H, Gruetter R. Non-invasive quantification of brain glycogen absolute concentration. J Neurochem. 2008;107(5):1414–1423. doi: 10.1111/j.1471-4159.2008.05717.x. [DOI] [PMC free article] [PubMed] [Google Scholar]
- 16.Mlynarik V, Cudalbu C, Xin L, Gruetter R. 1H NMR spectroscopy of rat brain in vivo at 14.1Tesla: improvements in quantification of the neurochemical profile. J Magn Reson. 2008;194(2):163–168. doi: 10.1016/j.jmr.2008.06.019. [DOI] [PubMed] [Google Scholar]
- 17.van Zijl PC, Zhou J, Mori N, Payen JF, Wilson D, Mori S. Mechanism of magnetization transfer during on-resonance water saturation. A new approach to detect mobile proteins, peptides, and lipids. Magn Reson Med. 2003;49(3):440–449. doi: 10.1002/mrm.10398. [DOI] [PubMed] [Google Scholar]
- 18.Fu R, Brey WW, Shetty K, Gor’kov P, Saha S, Long JR, Grant SC, Chekmenev EY, Hu J, Gan Z, Sharma M, Zhang F, Logan TM, Bruschweller R, Edison A, Blue A, Dixon IR, Markiewicz WD, Cross TA. Ultra-wide bore 900 MHz high-resolution NMR at the National High Magnetic Field Laboratory. J Magn Reson. 2005;177(1):1–8. doi: 10.1016/j.jmr.2005.07.013. [DOI] [PubMed] [Google Scholar]
- 19.Dobre MC, Ugurbil K, Marjanska M. Determination of blood longitudinal relaxation time (T1) at high magnetic field strengths. Magn Reson Imaging. 2007;25(5):733–735. doi: 10.1016/j.mri.2006.10.020. [DOI] [PubMed] [Google Scholar]
- 20.Harel N, Ugurbil K, Uludag K, Yacoub E. Frontiers of brain mapping using MRI. J Magn Reson Imaging. 2006;23(6):945–957. doi: 10.1002/jmri.20576. [DOI] [PubMed] [Google Scholar]
- 21.Rooney WD, Johnson G, Li X, Cohen ER, Kim SG, Ugurbil K, Springer CS., Jr Magnetic field and tissue dependencies of human brain longitudinal 1H2O relaxation in vivo. Magn Reson Med. 2007;57(2):308–318. doi: 10.1002/mrm.21122. [DOI] [PubMed] [Google Scholar]
- 22.Wiesinger F, Van de Moortele PF, Adriany G, De Zanche N, Ugurbil K, Pruessmann KP. Potential and feasibility of parallel MRI at high field. NMR Biomed. 2006;19(3):368–378. doi: 10.1002/nbm.1050. [DOI] [PubMed] [Google Scholar]
- 23.Boada FE, LaVerde G, Jungreis C, Nemoto E, Tanase C, Hancu I. Loss of cell ion homeostasis and cell viability in the brain: what sodium MRI can tell us. Curr Top Dev Biol. 2005;70:77–101. doi: 10.1016/S0070-2153(05)70004-1. [DOI] [PubMed] [Google Scholar]
- 24.Clayton DB, Lenkinski RE. MR imaging of sodium in the human brain with a fast three-dimensional gradient-recalled-echo sequence at 4 T. Acad Radiol. 2003;10(4):358–365. doi: 10.1016/s1076-6332(03)80023-5. [DOI] [PubMed] [Google Scholar]
- 25.Behr VC, Kaufmann I, Haase A, Jakob PM. A novel modular probe base design. Concepts in Magnetic Resonance Part B-Magnetic Resonance Engineering. 2008;33B(1):55–61. [Google Scholar]
- 26.Gareis D, Neuberger T, Behr VC, Jakob PM, Faber C, Griswold MA. Transmit-receive coil-arrays at 17.6T, configurations for H-1, Na-23, and P-31 MRI. Concepts in Magnetic Resonance Part B-Magnetic Resonance Engineering. 2006;29B(1):20–27. [Google Scholar]
- 27.Gareis D, Wichmann T, Lanz T, MeIkus G, Horn M, Jakob PM. Mouse MRI using phased-array coils. Nmr in Biomedicine. 2007;20(3):326–334. doi: 10.1002/nbm.1156. [DOI] [PubMed] [Google Scholar]
- 28.Markiewicz WD, Dixon IR, Swenson CA, Marshall WS, Painter TA, Bole ST, Cosmus T, Parizh M, King M, Ciancetta G. 900 MHz wide bore NMR spectrometer magnet at NHMFL. Ieee Transactions on Applied Superconductivity. 2000;10(1):728–731. [Google Scholar]
- 29.Alderman DW, Grant DM. Efficient Decoupler Coil Design Which Reduces Heating in Conductive Samples in Superconducting Spectrometers. Journal of Magnetic Resonance. 1979;36(3):447–451. [Google Scholar]
- 30.Tkac I, Starcuk Z, Choi IY, Gruetter R. In vivo 1H NMR spectroscopy of rat brain at 1 ms echo time. Magn Reson Med. 1999;41(4):649–656. doi: 10.1002/(sici)1522-2594(199904)41:4<649::aid-mrm2>3.0.co;2-g. [DOI] [PubMed] [Google Scholar]
- 31.Mai W, Badea CT, Wheeler CT, Hedlund LW, Johnson GA. Effects of breathing and cardiac motion on spatial resolution in the microscopic imaging of rodents. Magn Reson Med. 2005;53(4):858–865. doi: 10.1002/mrm.20400. [DOI] [PubMed] [Google Scholar]
- 32.Houpt TA, Pittman DW, Barranco JM, Brooks EH, Smith JC. Behavioral effects of high-strength static magnetic fields on rats. J Neurosci. 2003;23(4):1498–1505. doi: 10.1523/JNEUROSCI.23-04-01498.2003. [DOI] [PMC free article] [PubMed] [Google Scholar]
- 33.Houpt TA, Cassell JA, Riccardi C, DenBleyker MD, Hood A, Smith JC. Rats avoid high magnetic fields: dependence on an intact vestibular system. Physiol Behav. 2007;92(4):741–747. doi: 10.1016/j.physbeh.2007.05.062. [DOI] [PMC free article] [PubMed] [Google Scholar]
- 34.Abragam A. The principles of nuclear magnetism. xvi. Oxford: Clarendon Press; 1961. p. 599. [Google Scholar]
- 35.Zhu XH, Merkle H, Kwag JH, Ugurbil K, Chen W. 17O relaxation time and NMR sensitivity of cerebral water and their field dependence. Magn Reson Med. 2001;45(4):543–549. doi: 10.1002/mrm.1073. [DOI] [PubMed] [Google Scholar]
- 36.Hoult DI, Richards RE. Signal-to-Noise Ratio of Nuclear Magnetic-Resonance Experiment. Journal of Magnetic Resonance. 1976;24(1):71–85. doi: 10.1016/j.jmr.2011.09.018. [DOI] [PubMed] [Google Scholar]
- 37.Vaughan JT, Garwood M, Collins CM, Liu W, DelaBarre L, Adriany G, Andersen P, Merkle H, Goebel R, Smith MB, Ugurbil K. 7T vs. 4T: RF power, homogeneity, and signal-to-noise comparison in head images. Magn Reson Med. 2001;46(1):24–30. doi: 10.1002/mrm.1156. [DOI] [PubMed] [Google Scholar]
- 38.Tkac I, Henry PG, Andersen P, Keene CD, Low WC, Gruetter R. Highly resolved in vivo 1H NMR spectroscopy of the mouse brain at 9.4 T. Magn Reson Med. 2004;52(3):478–484. doi: 10.1002/mrm.20184. [DOI] [PubMed] [Google Scholar]