Abstract
OBJECTIVE
We examined in insulin-resistant muscle if, in contrast to long-standing dogma, mitochondrial fatty acid oxidation is increased and whether this is attributed to an increased nuclear content of peroxisome proliferator–activated receptor (PPAR) γ coactivator (PGC) 1α and the adaptations of specific mitochondrial subpopulations.
RESEARCH DESIGN AND METHODS
Skeletal muscles from male control and Zucker diabetic fatty (ZDF) rats were used to determine 1) intramuscular lipid distribution, 2) subsarcolemmal and intermyofibrillar mitochondrial morphology, 3) rates of palmitate oxidation in subsarcolemmal and intermyofibrillar mitochondria, and 4) the subcellular localization of PGC1α. Electotransfection of PGC1α cDNA into lean animals tested the notion that increased nuclear PGC1α preferentially targeted subsarcolemmal mitochondria.
RESULTS
Transmission electron microscope analysis revealed that in ZDF animals the number (+50%), width (+69%), and density (+57%) of subsarcolemmal mitochondria were increased (P < 0.05). In contrast, intermyofibrillar mitochondria remained largely unchanged. Rates of palmitate oxidation were ∼40% higher (P < 0.05) in ZDF subsarcolemmal and intermyofibrillar mitochondria, potentially as a result of the increased PPAR-targeted proteins, carnitine palmitoyltransferase-I, and fatty acid translocase (FAT)/CD36. PGC1α mRNA and total protein were not altered in ZDF animals; however, a greater (∼70%; P < 0.05) amount of PGC1α was located in nuclei. Overexpression of PGC1α only increased subsarcolemmal mitochondrial oxidation rates.
CONCLUSIONS
In ZDF animals, intramuscular lipids accumulate in the intermyofibrillar region (increased size and number), and this is primarily associated with increased oxidative capacity in subsarcolemmal mitochondria (number, size, density, and oxidation rates). These changes may result from an increased nuclear content of PGC1α, as under basal conditions, overexpression of PGC1α appears to target subsarcolemmal mitochondria.
Skeletal muscle, due to its mass and high rate of glucose disposal, is an important tissue in the development of insulin resistance. While the etiology of skeletal muscle insulin resistance remains uncertain, it has been proposed that an accumulation of intramuscular lipids, particularly diacylglycerol (DAG) (1) and ceramides (2,3), may attenuate the insulin-signaling cascade. Kelley and colleagues (4,5) and others (6–8) have speculated that a dysfunction in mitochondrial fatty acid oxidation, due to either a reduction in the number of mitochondria and/or a reduction in their intrinsic activity, may account for intramuscular lipid accumulation. However, support for mitochondrial dysfunction as a mechanism to induce lipid accumulation and insulin resistance has begun to wane, as recent reports have shown that despite the presence of skeletal muscle insulin resistance in animals (9–11) and in humans (12–14), the capacity for fatty acid oxidation by mitochondria is not downregulated. In addition, reductions in mitochondrial content have not been consistently observed in insulin-resistant muscle (10,15). Clearly, whether compromised fatty acid oxidation can account for intramuscular lipid accumulation has been questioned. However, whether there are alterations in fatty acid oxidation in subpopulations of mitochondria with insulin-resistant muscles has received little attention.
Mitochondria in skeletal muscle are present in two distinct locations, below the sarcolemma and between the myofibrils, and are known as subsarcolemmal and intermyofibrillar mitochondria, respectively. Their subcellular distribution and lipid accumulation near intermyofibrillar mitochondria (16) suggest that the metabolic roles of subsarcolemmal and intermyofibrillar mitochondria may differ. Functional studies (17,18) have shown that mitochondrial subpopulations do not respond uniformly to selected physiological stimuli, and therefore it is possible that divergent metabolic responses could occur in mitochondrial subpopulations from insulin-resistant muscle, particularly with respect to fatty acid oxidation. Although Kelley et al. (5) suggested, based on changes in mitochondrial size and enzymatic ratios in insulin-resistant muscle, that there was a preferential dysfunction in subsarcolemmal mitochondrial fatty acid oxidation, it is unknown whether these parameters scale with rates of mitochondrial fatty acid oxidation. Studies in insulin-resistant muscles of obese Zucker rats indicated that fatty acid oxidation was increased in red skeletal muscle subsarcolemmal and not intermyofibrillar mitochondria (10). Thus, the muscle fiber type, as well as the subpopulation of mitochondria, may influence fatty acid oxidation in insulin-resistant muscle. Whether such differences are related to peroxisome proliferator–activated receptor (PPAR) γ coactivator (PGC) 1α, which is well known to differ in red and white muscle, is uncertain.
PGC1α, a transcriptional cofactor regulating mitochondrial biogenesis, has been linked to mitochondrial proliferation (19,20) and lipid oxidation (20). This coactivator may therefore represent an important mechanism in the context of mitochondrial oxidative capacity and the development of insulin resistance. Indeed, PGC1α mRNA is reduced in selected models of insulin resistance (21,22), although others have shown that PGC1α mRNA (6,23) and protein contents (23,24) are not reduced with insulin resistance and that PGC1α overexpression in muscle has not improved insulin sensitivity (25). In contrast, more recent work (20) in healthy muscle has shown that overexpression of PGC1α within physiologic limits improved insulin-stimulated glucose transport and selected steps in the insulin-signaling cascade. Interestingly, PGC1α also upregulated fatty acid oxidation but only in subsarcolemmal mitochondria (20). This suggested that PGC1α preferentially targeted this mitochondrial subpopulation. Since PGC1α can be induced to translocate from the cytosol into nuclei (26), it is possible that the subcellular distribution of PGC1α in insulin-resistant muscles is altered, which may contribute to changes in fatty acid utilization in subsarcolemmal mitochondria. This remains to be determined.
In the present study, we have examined in red and white muscles of Zucker diabetic fatty (ZDF) rats, a model of type 2 diabetes (27), 1) lipid droplet distribution and 2) morphological as well as functional differences in subsarcolemmal and intermyofibrillar mitochondria and whether these mitochondrial changes are 3) associated with changes in the nuclear content of PGC1α. Our results demonstrate that in ZDF rats 1) subsarcolemmal mitochondrial size, number, and oxidation rates are preferentially increased in accordance with 2) an increased nuclear content of PGC1α protein that preferentially targets subsarcolemmal mitochondria.
RESEARCH DESIGN AND METHODS
Male control (n = 5, weighing ∼400 g) and ZDF (n = 5, weighing ∼400 g) rats were purchased from Charles River. Animals were housed in a climate- and temperature-controlled room, on a 12:12-h light-dark cycle, with rat diet and water provided ad libitum. Twenty-four–week-old animals were anesthetized with an intraperitoneal injection of sodium pentobarbital (60 mg/kg), and subsequently blood was sampled from nonfasted animals using a cardiac puncture, and muscles were rapidly excised for various measurements (described below). For the PGC1α electotransfection experiments, Sprague-Dawley rats (∼300 g) from our breeding colony were used. All facets of this study were approved by the University of Guelph Animal Care Committee.
Blood metabolite assays.
Serum samples were analyzed for glucose using a spectrophotometric method (Sigma, St. Louis), insulin by radioimmunoassay using a rat-specific antibody (Linco, St. Charles, MO), and fatty acid concentrations using a spectrophotometric procedure (Wako Chemicals, Richmond, VA).
Transmission electron microscope analysis of mitochondria.
Samples from the red and white portions of the tibialis anterior muscle were rapidly immersed in a fixing buffer (2.5% glutaraldehyde, 1.0% parafermaldehyde in PBS) and incubated at 4°C overnight. Tissue was then washed three times in 0.1 mol/l Hepes and subsequently suspended in 1.0% osmium tetroxide for 4 h. Thereafter, tissue was washed three times in 100 mmol/l Hepes and suspended in 2% uranyl acetate for 3 h, washed three times in 0.1% Hepes, and dehydrated by incubating in a graded ethanol series (i.e., 25, 50, 75, 95, and twice in 100% ethanol). Tissue was infiltrated with resin by suspending in 50/50 ethanol/resin (London Resin Company White) for 4 h on a rotating mixer and subsequently suspended in pure resin for 4 h on a rotating mixer. Tissue was then placed in an embedding capsule containing pure resin and incubated overnight at 60°C to polymerize. Sections (100 nm) were cut and laid onto 200 mesh formvar/carbon copper grids and then stained with 2% uranyl acetate and Reynold's lead citrate. Samples were viewed on a Philips CM 10 transmission electron microscope (TEM) at 80 kV, and images were obtained with an Olympus/SIS Morada CCD camera using the Olympus/SIS iTEM software. Images were analyzed using the measurement tools provided by this software. Individual lipid droplet and mitochondrial sizes were determined repeatedly and averaged for a given image taken at 25,000× magnification. Mitochondrial subpopulation densities were determined within a defined region (10-μm2 area) at a minimum of three locations within an image taken at 5,800× magnification, similar to methodologies previously published (28). Several fibers (3–5) were imaged for each animal. Mitochondrial number and density were not determined in white muscle because of their infrequent presence within our defined region.
Triacylglycerol concentrations.
Intracellular triacylglycerol concentrations were determined biochemically as previously described (29). Lipids were extracted in a standard Folch solution and subsequently separated by high-performance thin-layer chromatography and quantified against known standards.
Mitochondrial enzymatic activities.
Muscle samples were homogenized in 100 vol/wt of a 100 mmol/l potassium phosphate buffer and citrate synthase (CS) activity was assayed spectrophotometrically at 412 nm (37°C) (30).
Mitochondrial DNA.
mtDNA was determined using real-time PCR, as previously reported (10), using the following primers: NADH dehydrogenase subunit 5 forward, 5′-GCAGCCACAGGAAAATCCG-3′ and reverse, 5′-GTAGGGCAGAGACGGGAGTTG-3′; and the solute carrier family 16 member 1 forward, 5′-TAGCTGGATCCCTGATGCGA-3′ and reverse, 5′-GCATCAGACTTCCCAGCTTCC-3′.
Isolation of mitochondria from skeletal muscle.
Differential centrifugation was used to obtain both subsarcolemmal and intermyofibrillar mitochondrial fractions from the red and white portions of the tibialis anterior, as we have previously published (20,31). Mitochondria were further purified using a Percoll gradient for Western blotting analysis.
Western blotting.
Whole-muscle homogenates were prepared as previously described (20) (n = 4). Isolated mitochondria (5 μg), whole muscle (30 μg), nuclear extract (45 μg), and cytosolic protein (25 μg) were analyzed. Samples were separated by electrophoresis by SDS-PAGE and transferred to polyvinylidene difluoride membranes. The MO-25 antibody has been used previously (10,12) to detect fatty acid translocase (FAT)/CD36 (a gift from Dr. N.N. Tandon), and commercially available antibodies were used to detect cytochrome c oxidase complex IV (COXIV; Invitrogen, Burlington, ON, Canada), PGC1α (Calbiochem, LA Jolla, CA), lactate dehydrogenase (LDH; Abcam; Cambridge, MA), and histone H2B (H2B; Abcam). Blots were visualized and quantified using chemiluminescence and the ChemiGenius 2 Bioimaging System (SynGene, Cambridge, U.K.).
Carnitine palmitoyltransferase I activity.
The forward radioisotope assay was used for the determination of carnitine palmitoyltransferase I (CPTI) activity as described by McGarry et al. (32), with minor modifications as we have previously reported (20,33). Briefly, the assay was conducted in the presence of 75 μmol/l P-CoA (l-[3H]carnitine (Amersham Bioscience, Buckinghamshire, England). Palmitoyl-[3H] carnitine was extracted in water-saturated butanol and the radioactivity determined.
Mitochondrial palmitate oxidation.
Palmitate oxidation was measured in the presence [1-14C] palmitate, as previously described (34). Briefly, gaseous 14CO2 production and isotopic fixation were determined following a 30-min reaction at 37°C in the presence of 77 μmol/l palmitate.
PGC-1α mRNA.
PGC-1α mRNA was determined in the tibialis anterior muscle using real-time PCR as we have previously reported (20). The following primer sets were used: PGC-1α forward 5′-CAATGAGCCCGCGAACATAT-3′, PGC-1α reverse 5′-CAATCCGTCTTCATCCACCG-3′ and 18S forward 5′-GTTGGTTTTCGGAACTGAGGC-3′, 18S reverse ‘5-GTCGGCATCGTTTATGGTCG-3′.
Isolation of nuclear extracts.
Nuclear extraction was performed using a commercial kit (Pierce Biotechnology, Rockford, IL) according to the manufacturer's specifications, as done previously (26). Harvested muscles were immediately placed in 750 μl of PBS, minced, and briefly homogenized. Cytosolic and nuclear extraction was performed using supplied reagents supplemented with 1 mmol/l sodium orthovanadate, 1 mmol/l phenylmethylsulfonyl fluoride, and 10 μg/ml of pepstain A, aprotinin, and leupeptin. Isolated nuclei were washed 15 times in alternating PBS or PBS supplemented with 0.1% Nonidet P-40. To confirm the purity of nuclear extracts, both fractions were analyzed by Western blotting for cytosolic (LDH) and nuclear proteins (H2B).
Electrotransfection of PGC1α.
Electrotransfection experiments were performed as described by us (20,35) and others (36,37), with minor modifications. The PGC1α expression construct (a gift from Dr. B. Spiegelman, Harvard University, Boston, MA) was produced by subcloning the PGC1α coding sequence into a mammalian expression vector (pcDNA 3.0) (Invitrogen, Burlington, ON, Canada). Plasmid stocks were produced by large-scale plasmid isolation from transformed Escherichia coli cells (One-Shot; Invitrogen) using commercially available kits (GIGA-prep kits; Invitrogen).
For electrotransfection, animals were anesthetized with isoflurane and the tibialis anterior muscle injected with 100 μl hyaluronidase (0.15 units/μl in 50% vol/vol saline). Two hours later, muscles were electrotransfected with 1) PGC1α-pcDNA plasmid (500 μg PGC1α in 50% vol/vol saline) or 2) empty pcDNA3.0 plasmid (500 μg pcDNA in 50% vol/vol saline) as described previously (20,38,39). Thereafter, rats were provided with an analgesic (Temgesic) and allowed to recover for 2 weeks (40).
Statistics.
All data are presented as means ± SE. Unpaired t tests, paired t tests, and two-way ANOVA were used where appropriate. When significance was obtained, a Fisher's least-significant-difference post hoc analysis was completed. Statistical significance was accepted at P < 0.05.
RESULTS
Blood characteristics.
In ZDF animals, serum insulin concentrations were markedly lower (4.8 ± 0.8 vs. 1.5 ± 0.4 ng/ml; P < 0.05), while glucose (14 ± 1 vs. 37 ± 1 mmol/l) and fatty acid (0.3 ± 0.1 vs. 0.9 ± 0.2 mmol/l) concentrations were higher (P < 0.05).
Lipid droplet characteristics.
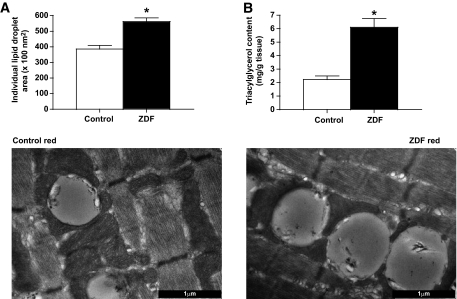
In red ZDF muscle, the area of individual lipid droplets was +47% larger than in red control muscle (P < 0.05) (Fig. 1A). In addition, TEM images revealed a large number of lipid droplets in red ZDF muscle, which were largely in contact with intermyofibrillar mitochondria, while the subsarcolemmal mitochondrial region was devoid of lipids (Figs. 2 and 3). Biochemical extraction revealed that triacylglycerol concentration was approximately threefold higher (P < 0.05) in ZDF muscle (Fig. 1B). In white muscle, lipid droplets were not quantifiable.
FIG. 1.
Intramyocellular lipids in red muscle of control and ZDF animals, determined in TEM images (A) and biochemically (B). Data are expressed as the means ± SE. Images were taken at 25,000× magnification and the black bar = 1 μm. n = 5 animals for each measure. *Significantly different (P < 0.05) from control mitochondria.
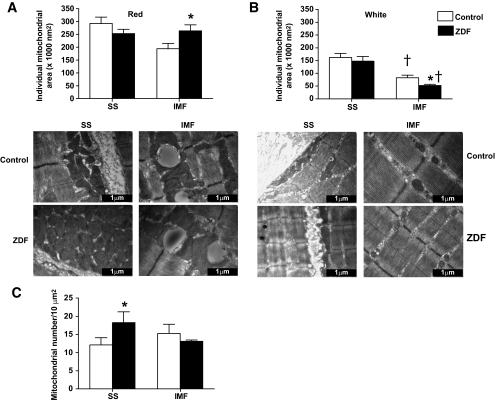
FIG. 2.
Subsarcolemmal (SS) and intermyofibrillar (IMF) mitochondrial area (A and B) and number (C) in red and white muscle of control and ZDF animals. Data are expressed as the means ± SE. Images were taken at 25,000× magnification and the black bar = 1 μm. n = 5 animals for each measure. *Significantly different (P < 0.05) from control mitochondria. †Significantly different (P < 0.05) from subsarcolemmal mitochondria. Mitochondrial number was not determined in white muscle because of the infrequent presence in our defined region.
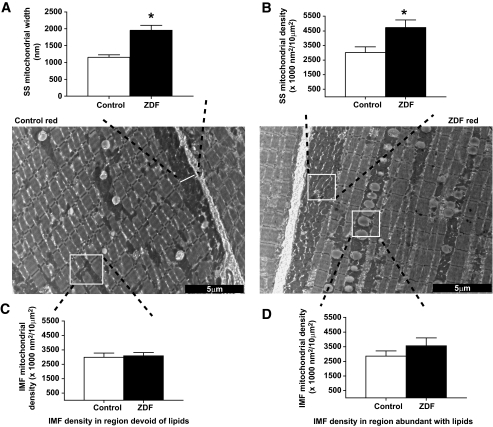
FIG. 3.
Subsarcolemmal (SS) mitochondrial width (A) and density (B) and intermyofibrillar (IMF) mitochondrial density in close proximity of (D) or distant from (C) lipid droplets, in red muscle of control and ZDF animals. Data are expressed as the means ± SE. Images were taken at 5,800× magnification and the black bar = 5 μm. Width of intermyofibrillar mitochondria was not determined, as this was largely influenced by lipid droplet diameter and not reflective of mitochondrial volume changes. n = 5 animals for each measure. *Significantly different (P < 0.05) from control mitochondria.
Mitochondrial morphology in ZDF animals
Mitochondrial area.
In red and white ZDF muscles, subsarcolemmal mitochondrial size was not altered (Fig. 2A and B). However, compared with control animals, red intermyofibrillar mitochondria in ZDF animals were +35% larger (P < 0.05) (Fig. 2A), while white muscle intermyofibrillar mitochondria in ZDF animals were −37% smaller (P < 0.05) (Fig. 2B).
Mitochondrial number.
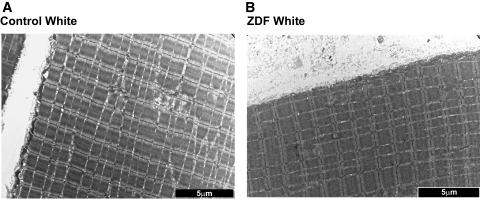
In red muscle, the number of subsarcolemmal mitochondria in ZDF animals was markedly increased (+50%; P < 0.05) (Fig. 2C), but the number of intermyofibrillar mitochondria was unaltered (Fig. 2C). In white muscle, this parameter was not determined because of the scarcity and diffuse nature of mitochondria in this tissue (Figs. 2 and 4).
FIG. 4.
Representative images of white muscle in control (A) and ZDF (B) animals. Note the absence of lipid droplets and the diffuse nature of mitochondria. Images were taken at 5,800× magnification and the black bar = 5 μm.
Mitochondrial density.
The width of the red muscle subsarcolemmal mitochondrial subpopulation was +69% larger (P < 0.05) (Fig. 3A), and the density of red muscle subsarcolemmal mitochondria was +57% larger (P < 0.05) (Fig. 3B) in ZDF animals. In contrast, the density of intermyofibrillar mitochondria was not different (P > 0.05) when analyzed in regions devoid (Fig. 3C) or abundant (Fig. 3D) in lipid droplets.
Enzyme activities, protein expression, and mitochondrial DNA
Whole muscle.
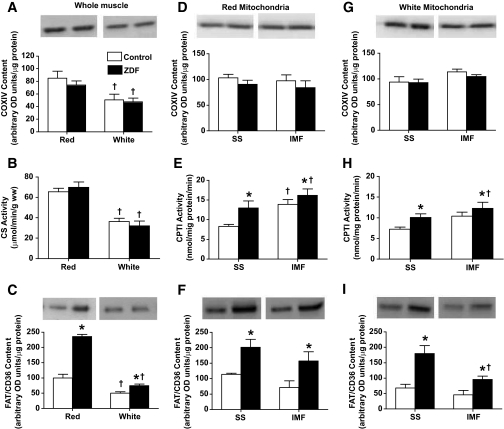
Whole-muscle COXIV protein (Fig. 5A) and CS maximal activity (Fig. 5B) were not different in ZDF animals. The amount of mitochondrial DNA (mtDNA) was also not altered in ZDF rats in either red (control: 2.23 ± 0.25 vs. ZDF: 2.13 ± 0.63 arbitrary units) or white (control: 1.31 ± 0.23 vs. ZDF: 0.91 ± 0.28 arbitrary units) muscles, suggesting that mitochondrial content was unaltered. In contrast, FAT/CD36 was increased +2.4-fold in red, and +50% in white, ZDF muscles (Fig. 5C).
FIG. 5.
Whole-muscle, subsarcolemmal (SS), and intermyofibrillar (IMF) mitochondrial enzymatic activities and protein contents in red and white muscle of control and ZDF animals. COXIV (whole muscle [A]; red mitochondria [D]; white mitochondria [G]); CS (whole muscle [B]); CPTI (red mitochondria [E]; white mitochondria [H]); FAT/CD36 (whole muscle [C]; red mitochondria [F]; white mitochondria [I]). Data are expressed as the means ± SE. n = 4–5 for each measure. *Significantly different (P < 0.05) from control animals. †Significantly different (P < 0.05) from red muscle or subsarcolemmal mitochondria.
Isolated mitochondria.
In isolated mitochondria, COXIV protein was constant across all mitochondrial subpopulations (Fig. 5D and G), while in contrast, CPTI activity (Fig. 5E and H) and FAT/CD36 protein (Fig. 5F and I) were greater (P < 0.05) in all mitochondrial subpopulations in ZDF animals.
Mitochondrial palmitate oxidation.
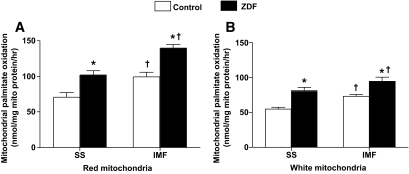
In both red and white muscle, ZDF animals displayed higher (P < 0.05) rates of palmitate oxidation in isolated subsarcolemmal (∼40%) and intermyofibrillar (∼40%) mitochondria (Fig. 6A and B). Increased ratios of 14C -acid soluble intermediates (ASMs) to 14CO2 have previously been used to infer incomplete oxidation of 14C-palmitate (41). In red intermyofibrillar mitochondria, the ASM/CO2 ratio was unchanged. In contrast, this ratio was decreased (∼30%; P < 0.05) in red muscle subsarcolemmal mitochondria and in white muscle subsarcolemmal and intermyofibrillar mitochondria, indicating greater complete fatty acid oxidation in these mitochondria (data not shown).
FIG. 6.
Red (A) and white (B) muscle subsarcolemmal (SS) and intermyofibrillar (IMF) mitochondrial palmitate oxidation rates in control and ZDF animals. Data are expressed as the means ± SE. n = 5 for each measure. *Significantly different (P < 0.05) from control mitochondria. †Significantly different (P < 0.05) from subsarcolemmal mitochondria.
PGC1α subcellular location
PGC1α mRNA.
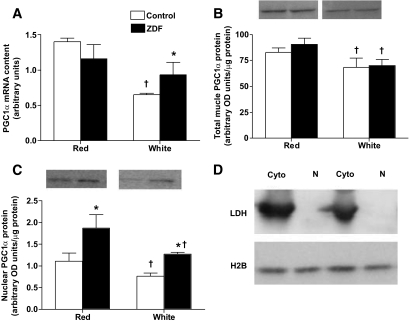
In red muscle, PGC1α mRNA was not different (P > 0.05) between control and ZDF animals (Fig. 7A). In control animals, PGC1α mRNA was −54% lower (P < 0.05) in white, compared with red, muscle (Fig. 7A). In contrast, this fiber type difference was lost in ZDF animals as a result of the increase (P < 0.05) in white muscle PGC1α mRNA (Fig. 7A).
FIG. 7.
PGC1α mRNA (A) and total (B) and nuclear (C) protein in control and ZDF animals. LDH, H2B representative blots (D). Data are expressed as the means ± SE. n = 4 for each measure. *Significantly different (P < 0.05) from control muscle. †Significantly different (P < 0.05) from red muscle.
PGC1α total protein.
Whole-muscle PGC1α protein was not altered in ZDF animals in either red or white muscles (Fig. 7B). White muscle, compared with red muscle, had less (P < 0.05) PGC1α protein in both control (−19%) and ZDF (−23%) animals (Fig. 7B).
Nuclear PGC1α protein.
Purified nuclear extracts were devoid of LDH and contained high levels of H2B (Fig. 7D), indicating successful enrichment of nuclear proteins and the absence of cytosolic contamination. The amount of PGC1α protein located in the nuclei was higher (P < 0.05) in both red (+68%) and white (+67%) muscles of ZDF animals (Fig. 7C). A fiber type difference existed in nuclear PGC1α protein, as white muscle contained less (P < 0.05) PGC1α nuclear protein in both control (−32%) and ZDF (−32%) animals (Fig. 7C).
Targeting of PGC1α to subsarcolemmal mitochondria.
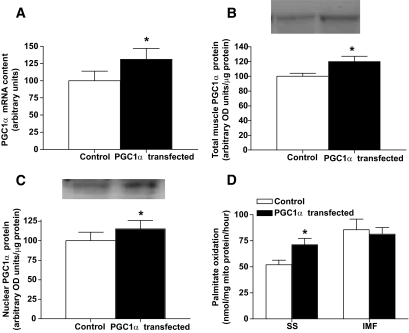
To test the notion that PGC1α preferentially targets subsarcolemmal mitochondria, we electrotransfected PGC1α cDNA into the tibialis anterior muscle of lean animals and determined the effect on FAT/CD36, a target protein. Transfection increased the mRNA (+29%) (Fig. 8A), total protein (+22%) (Fig. 8B), and the nuclear content of PGC1α (+15%) (Fig. 8C). Subsequently, whole-muscle FAT/CD36 content was increased (P < 0.05) +30% (control: 100 ± 6.1 vs. transfected: 130 ± 18.4 arbitrary units), as was subsarcolemmal mitochondrial FAT/CD36 content (control: 100 ± 10.5 vs. transfected: 117 ± 15.5 arbitrary units) but not intermyofibrillar FAT/CD36 (control: 105.4 ± 6.3 vs. transfected: 98 ± 3.9 arbitrary units). Rates of palmitate oxidation increased (P < 0.05) +37% in subsarcolemmal mitochondria, but PGC1α transfection had no effect (P > 0.05) on intermyofibrillar mitochondria (Fig. 8D). Around 30% of muscle fibers are transfected with our procedures (data not shown), and therefore we could not determine mitochondrial content in various subpopulations in transfected muscle fibers, as with TEM imaging one cannot determine which fibers have been affected.
FIG. 8.
PGC1α mRNA (A) and total (B) and nuclear (C) protein and subsarcolemmal (SS) and intermyofibrillar (IMF) mitochondrial palmitate oxidation rates (D) in control and PGC1α-transfected muscles. Data are expressed as the means ± SE. n = 4 for each measure. *Significantly different (P < 0.05) from control muscle. †Significantly different (P < 0.05) from subsarcolemmal muscle.
DISCUSSION
The novel findings of the current study are that skeletal muscle from ZDF rats 1) have larger and more prevalent lipid droplets and 2) preferentially display compensatory increases in subsarcolemmal mitochondrial number, width, density, as well as fatty acid oxidation rates, which potentially result from 3) an increased nuclear content of PGC1α that appears to target subsarcolemmal mitochondria.
Mitochondrial morphology.
The original hypothesis of a mitochondrial dysfunction in fatty acid oxidation was partially based on observations of smaller subsarcolemmal mitochondria in insulin-resistant muscle (4). However, the current TEM images do not support the notion of smaller mitochondria with insulin resistance, as in red muscle subsarcolemmal mitochondrial size, was unchanged and intermyofibrillar mitochondrial size was actually increased in ZDF animals. In addition, it was not previously understood if mitochondrial size directly impacted mitochondrial oxidation rates, making the previous observations of reduced mitochondrial size (4) difficult to interpret. The current data suggests that mitochondrial size does not influence mitochondrial palmitate oxidation, as these rates were increased when the size of mitochondria were unaltered (red and white subsarcolemmal mitochondria), increased (red intermyofibrillar mitochondria), as well as decreased (white intermyofibrillar mitochondria).
Analysis of TEM images showed that the number (+50%), width (+69%), and density (+57%) of subsarcolemmal mitochondria were increased in ZDF animals. In contrast, ZDF intermyofibrillar mitochondrial number and density were not changed, nor were markers of mitochondrial content (mtDNA, CS, and COXIV). These data show that mitochondrial subpopulations can respond differently in insulin-resistant muscle, and whole-muscle measures of mitochondrial content cannot reveal the subtle differences of various signals that induce mitochondrial proliferation.
Mitochondrial content and rates of palmitate oxidation.
Previously, indirect assessments suggested that there was an intrinsic dysfunction in fatty acid oxidation within mitochondria (4). However, the current data do not support this notion, as subsarcolemmal and intermyofibrillar mitochondria, from both red and white muscles of ZDF animals, displayed ∼40% increased rates of palmitate oxidation. These data are consistent with more contemporary mitochondrial literature, as it has recently been shown that mitochondrial fatty acid oxidation, when measured in isolated mitochondria or permeabilized fibers, is not reduced in mitochondria of obese and type 2 diabetic individuals (12–14). Rodent models of insulin resistance have also supported the notion that downregulation of mitochondrial fatty acid oxidation is not a requirement for lipid accumulation and impairments in insulin signaling. High-fat feeding has been shown to induce insulin resistance while increasing mitochondrial content (9,11). Magnetic resonance spectroscopy has suggested that fatty acid oxidation is not compromised in diabetic animals (42), and we have recently shown in both red and white muscles of obese Zucker rats that fatty acid oxidation was increased, not decreased, in subsarcolemmal mitochondria (10). Thus, our work (10,12) and that of others (9,13,14,43), indicates that in both human (12–14) and animal models of insulin resistance (9,43) there is little evidence to support the view that an intrinsic impairment in the ability of mitochondria to oxidize fatty acids accounts for the increased intramuscular lipid accumulation associated with insulin resistance. Instead, evidence in both human (44) and rodent (10,45) models of insulin resistance suggests that plasma membrane fatty acid transport is increased as a result of an increased content of fatty acid transport proteins. Despite the potential compensatory adaptations in mitochondrial fatty acid oxidation, the large changes in plasma membrane fatty acid transport have been proposed to create an imbalance between delivery and utilization such that lipids accumulate (10).
Mitochondrial CPTI activity and FAT/CD36 protein.
In the current study, the increase in palmitate oxidation in ZDF mitochondria may result from the observed increase in 1) CPTI activity and/or 2) mitochondrial FAT/CD36 protein. The rate-limiting step in fatty acid transport/oxidation has long been attributed to CPTI activity, and the changes in CPTI activity mimicked the trends in mitochondrial fatty acid oxidation in both red and white muscle. However, the notion that CPTI activity represents the only regulatory site in mitochondrial fatty acid oxidation has been challenged, as several laboratories have recently found the fatty acid transport protein FAT/CD36 on mitochondrial membranes. Gain-of-function (46) and loss-of-function (34) molecular approaches, as well as physiological perturbations (31), have suggested that mitochondrial FAT/CD36 has a role in regulating mitochondrial fatty acid oxidation. While FAT/CD36 appears to have a role in regulating mitochondrial fatty acid oxidation, this is likely mediated in a concerted fashion with additional proteins, as mitochondrial FAT/CD36 and palmitate oxidation rates do not correlate under basal conditions (47) but rather multiple regression approaches that take into consideration both CPTI and mitochondrial FAT/CD36 highly correlate with mitochondrial fatty acid oxidation rates (47). Therefore, in the current study, the increase in both CPTI activity and mitochondrial FAT/CD36 may account for the observed changes in mitochondrial palmitate oxidation rates in ZDF animals, both of which are transcribed by PPARs and mediated by PGC1α.
PGC1α mRNA and total and nuclear protein.
It has been suggested that reductions in PGC1α expression has a role in the etiology of insulin resistance (21,22). However, in the current study we have found that PGC1α mRNA and total muscle protein were not reduced in ZDF muscles. However, the subcellular distribution of PGC1α did differ, as the nuclear content was markedly increased (∼70%). Others (6,23,24) have also now found that PGC1α is not reduced with insulin resistance in human skeletal muscle. The mechanism(s) triggering the PGC1α translocation to the nucleus are unknown. However, muscle contraction, through calcium-mediated signaling, has previously been shown to induce nuclear translocation of PGC1α (26), and therefore alterations in cytosolic calcium levels represent a potential mechanism of action.
Interestingly, the increase in nuclear PGC1α was associated with increased proliferation of the ZDF subsarcolemmal mitochondria not intermyofibrillar mitochondria. PGC1α overexpression experiments revealed that PGC1α targets subsarcolemmal mitochondria, as palmitate oxidation rates and FAT/CD36 content were only increased in subsarcolemmal, not intermyofibrillar, mitochondria. This was also observed previously in another study (20). However, in ZDF animals in the current study, intermyofibrillar mitochondrial CPTI, FAT/CD36, and rates of fatty acid oxidation were also all increased in conjunction with increased nuclear PGC1α. Proliferation of intermyofibrillar mitochondria is also possible in PGC1α transgenic animals (25). This may suggest that a greater increase in nuclear PGC1α is required to upregulate intermyofibrillar mitochondria, as transfection only had a modest affect on nuclear PGC1α (+15%) compared with the in vivo ZDF (+70%) and, arguably, the transgenic conditions. Alternatively, the apparent argeting of PGC1α to subsarcolemmal mitochondria may be a result of the proximity of nuclei to the subsarcolemmal subpopulation and differences in the rate of protein import into mitochondrial subpopulations (48). Regardless of the exact mechanism, more pronounced changes occur in subsarcolemmal mitochondria in response to increased nuclear PGC1α content in both ZDF and electrotransfected rats.
While ZDF animals share a number of similar traits with human type 2 diabetes, including hyperglycemia, insulin resistance (49), hyperlipidemia (50), increased plasmalemmal fatty acid transport, and intramuscular lipids (44), we recognize that the ZDF animal model is not fully representative of human type 2 diabetes. Therefore, it will be important to discern whether the current observation in ZDF animals extend to human type 2 diabetic individuals.
In summary, we show that in ZDF rats 1) intramuscular triacylglycerol accumulates, almost exclusively in the intermyofibrillar region, as a result of an increase in both the size and number of lipid droplets. In an attempt to compensate for the increased plasma membrane fatty acid transport and lipid delivery (as we have shown previously [45]), in ZDF muscle the there was an increase in 2) subsarcolemmal mitochondrial number, size, and density; 3) subsarcolemmal and intermyofibrillar CPTI activity and FAT/CD36 protein; and 4) mitochondrial palmitate oxidation rates in subsarcolemmal and intermyofibrillar mitochondria. The increase in ZDF mitochondrial oxidative capacity was greater in subsarcolemmal mitochondria, as the increase in mitochondrial fatty acid oxidation rates is amplified by the increase in subsarcolemmal mitochondrial number. These changes may result in part from 5) an increased nuclear translocation of PGC1α protein, which preferentially targets subsarcolemmal mitochondria.
ACKNOWLEDGMENTS
This work was funded by the Canadian Institutes of Health Research (to A.B.) and the Natural Sciences and Engineering Research Council of Canada (to A.B. and G.H.).
No potential conflicts of interest relevant to this article were reported.
We express our appreciation to Robert Harris for his assistance with the TEM experiments.
Footnotes
The costs of publication of this article were defrayed in part by the payment of page charges. This article must therefore be hereby marked “advertisement” in accordance with 18 U.S.C. Section 1734 solely to indicate this fact.
REFERENCES
- 1.Timmers S, Schrauwen P, de Vogel J: Muscular diacylglycerol metabolism and insulin resistance. Physiol Behav 2008; 94: 242– 251 [DOI] [PubMed] [Google Scholar]
- 2.Holland WL, Brozinick JT, Wang LP, Hawkins ED, Sargent KM, Liu Y, Narra K, Hoehn KL, Knotts TA, Siesky A, Nelson DH, Karathanasis SK, Fontenot GK, Birnbaum MJ, Summers SA: Inhibition of ceramide synthesis ameliorates glucocorticoid-, saturated-fat-, and obesity-induced insulin resistance. Cell Metab 2007; 5: 167– 179 [DOI] [PubMed] [Google Scholar]
- 3.Summers SA: Ceramides in insulin resistance and lipotoxicity. Prog Lipid Res 2006; 45: 42– 72 [DOI] [PubMed] [Google Scholar]
- 4.Kelley DE, He J, Menshikova EV, Ritov VB: Dysfunction of mitochondria in human skeletal muscle in type 2 diabetes. Diabetes 2002; 51: 2944– 2950 [DOI] [PubMed] [Google Scholar]
- 5.Ritov VB, Menshikova EV, He J, Ferrell RE, Goodpaster BH, Kelley DE: Deficiency of subsarcolemmal mitochondria in obesity and type 2 diabetes. Diabetes 2005; 54: 8– 14 [DOI] [PubMed] [Google Scholar]
- 6.Morino K, Petersen KF, Dufour S, Befroy D, Frattini J, Shatzkes N, Neschen S, White MF, Bilz S, Sono S, Pypaert M, Shulman GI: Reduced mitochondrial density and increased IRS-1 serine phosphorylation in muscle of insulin-resistant offspring of type 2 diabetic parents. J Clin Invest 2005; 115: 3587– 3593 [DOI] [PMC free article] [PubMed] [Google Scholar]
- 7.Kim JY, Hickner RC, Cortright RL, Dohm GL, Houmard JA: Lipid oxidation is reduced in obese human skeletal muscle. Am J Physiol Endocrinol Metab 2000; 279: E1039– E1044 [DOI] [PubMed] [Google Scholar]
- 8.Pongratz RL, Kibbey RG, Kirkpatrick CL, Zhao X, Pontoglio M, Yaniv M, Wollheim CB, Shulman GI, Cline GW: Mitochondrial dysfunction contributes to impaired insulin secretion in INS-1 cells with dominant-negative mutations of HNF-1alpha and in HNF-1alpha-deficient islets. J Biol Chem 2009; 284: 16808– 16821 [DOI] [PMC free article] [PubMed] [Google Scholar]
- 9.Turner N, Bruce CR, Beale SM, Hoehn KL, So T, Rolph MS, Cooney GJ: Excess lipid availability increases mitochondrial fatty acid oxidative capacity in muscle: evidence against a role for reduced fatty acid oxidation in lipid-induced insulin resistance in rodents. Diabetes 2007; 56: 2085– 2092 [DOI] [PubMed] [Google Scholar]
- 10.Holloway GP, Benton C, Mullen KL, Yoshida Y, Snook LA, Han XX, Glatz JF, Luiken JJ, Lally J, Dyck DJ, Bonen A: In obese rat muscle transport of palmitate is increased and is channeled to triacylglycerol storage despite an increase in mitochondrial palmitate oxidation. Am J Physiol Endocrinol Metab 2009; 296: E738– E747 [DOI] [PubMed] [Google Scholar]
- 11.Hancock CR, Han DH, Chen M, Terada S, Yasuda T, Wright DC, Holloszy JO: High-fat diets cause insulin resistance despite an increase in muscle mitochondria. Proc Natl Acad Sci U S A 2008; 105: 7815– 7820 [DOI] [PMC free article] [PubMed] [Google Scholar]
- 12.Holloway GP, Thrush AB, Heigenhauser GJ, Tandon NN, Dyck DJ, Bonen A, Spriet LL: Skeletal muscle mitochondrial FAT/CD36 content and palmitate oxidation are not decreased in obese women. Am J Physiol Endocrinol Metab 2007; 292: E1782– E1789 [DOI] [PubMed] [Google Scholar]
- 13.Mogensen M, Sahlin K, Fernstrom M, Glintborg D, Vind BF, Beck-Nielsen H, Hojlund K: Mitochondrial respiration is decreased in skeletal muscle of patients with type 2 diabetes. Diabetes 2007; 56: 1592– 1599 [DOI] [PubMed] [Google Scholar]
- 14.Boushel R, Gnaiger E, Schjerling P, Skovbro M, Kraunsoe R, Dela F: Patients with type 2 diabetes have normal mitochondrial function in skeletal muscle. Diabetologia 2007; 50: 790– 796 [DOI] [PMC free article] [PubMed] [Google Scholar]
- 15.Bruce CR, Mertz VA, Heigenhauser GJ, Dyck DJ: The stimulatory effect of globular adiponectin on insulin-stimulated glucose uptake and fatty acid oxidation is impaired in skeletal muscle from obese subjects. Diabetes 2005; 54: 3154– 3160 [DOI] [PubMed] [Google Scholar]
- 16.Hoppeler H, Howald H, Conley K, Lindstedt SL, Claassen H, Vock P, Weibel ER: Endurance training in humans: aerobic capacity and structure of skeletal muscle. J Appl Physiol 1985; 59: 320– 327 [DOI] [PubMed] [Google Scholar]
- 17.Hoppeler H: Exercise-induced ultrastructural changes in skeletal muscle. Int J Sports Med 1986; 7: 187– 204 [DOI] [PubMed] [Google Scholar]
- 18.Krieger DA, Tate CA, McMillin-Wood J, Booth FW: Populations of rat skeletal muscle mitochondria after exercise and immobilization. J Appl Physiol 1980; 48: 23– 28 [DOI] [PubMed] [Google Scholar]
- 19.Puigserver P, Wu Z, Park CW, Graves R, Wright M, Spiegelman BM: A cold-inducible coactivator of nuclear receptors linked to adaptive thermogenesis. Cell 1998; 92: 829– 839 [DOI] [PubMed] [Google Scholar]
- 20.Benton CR, Nickerson JG, Lally J, Han XX, Holloway GP, Glatz JF, Luiken JJ, Graham TE, Heikkila JJ, Bonen A: Modest PGC-1alpha overexpression in muscle in vivo is sufficient to increase insulin sensitivity and palmitate oxidation in SS, not IMF, mitochondria. J Biol Chem 2008; 283: 4228– 4240 [DOI] [PubMed] [Google Scholar]
- 21.Patti ME, Butte AJ, Crunkhorn S, Cusi K, Berria R, Kashyap S, Miyazaki Y, Kohane I, Costello M, Saccone R, Landaker EJ, Goldfine AB, Mun E, DeFronzo R, Finlayson J, Kahn CR, Mandarino LJ: Coordinated reduction of genes of oxidative metabolism in humans with insulin resistance and diabetes: Potential role of PGC1 and NRF1. Proc Natl Acad Sci U S A 2003; 100: 8466– 8471 [DOI] [PMC free article] [PubMed] [Google Scholar]
- 22.Mootha VK, Lindgren CM, Eriksson KF, Subramanian A, Sihag S, Lehar J, Puigserver P, Carlsson E, Ridderstrale M, Laurila E, Houstis N, Daly MJ, Patterson N, Mesirov JP, Golub TR, Tamayo P, Spiegelman B, Lander ES, Hirschhorn JN, Altshuler D, Groop LC: PGC-1alpha-responsive genes involved in oxidative phosphorylation are coordinately downregulated in human diabetes. Nat Genet 2003; 34: 267– 273 [DOI] [PubMed] [Google Scholar]
- 23.De Filippis E, Alvarez G, Berria R, Cusi K, Everman S, Meyer C, Mandarino LJ: Insulin resistant muscle is exercise resistant: Evidence for reduced response of nuclear encoded mitochondrial genes to exercise. Am J Physiol Endocrinol Metab 2008; 294: E607– E614 [DOI] [PubMed] [Google Scholar]
- 24.Holloway GP, Perry CG, Thrush AB, Heigenhauser GJ, Dyck DJ, Bonen A, Spriet LL: PGC-1alpha's relationship with skeletal muscle palmitate oxidation is not present with obesity despite maintained PGC-1alpha and PGC-1beta protein. Am J Physiol Endocrinol Metab 2008; 294: E1060– E1069 [DOI] [PubMed] [Google Scholar]
- 25.Choi CS, Befroy DE, Codella R, Kim S, Reznick RM, Hwang YJ, Liu ZX, Lee HY, Distefano A, Samuel VT, Zhang D, Cline GW, Handschin C, Lin J, Petersen KF, Spiegelman BM, Shulman GI: Paradoxical effects of increased expression of PGC-1alpha on muscle mitochondrial function and insulin-stimulated muscle glucose metabolism. Proc Natl Acad Sci U S A 2008; 105: 19926– 19931 [DOI] [PMC free article] [PubMed] [Google Scholar]
- 26.Wright DC, Han DH, Garcia-Roves PM, Geiger PC, Jones TE, Holloszy JO: Exercise-induced mitochondrial biogenesis begins before the increase in muscle PGC-1alpha expression. J Biol Chem 2007; 282: 194– 199 [DOI] [PubMed] [Google Scholar]
- 27.Corsetti JP, Sparks JD, Peterson RG, Smith RL, Sparks CE: Effect of dietary fat on the development of non-insulin dependent diabetes mellitus in obese Zucker diabetic fatty male and female rats. Atherosclerosis 2000; 148: 231– 241 [DOI] [PubMed] [Google Scholar]
- 28.Marchand I, Tarnopolsky M, Adamo KB, Bourgeois JM, Chorneyko K, Graham TE: Quantitative assessment of human muscle glycogen granules size and number in subcellular locations during recovery from prolonged exercise. J Physiol 2007; 580: 617– 628 [DOI] [PMC free article] [PubMed] [Google Scholar]
- 29.Han XX, Chabowski A, Tandon NN, Calles-Escandon J, Glatz JF, Luiken JJ, Bonen A: Metabolic challenges reveal impaired fatty acid metabolism and translocation of FAT/CD36 but not FABPpm in obese zucker rat muscle. Am J Physiol Endocrinol Metab 2007; 293: E566– E575 [DOI] [PubMed] [Google Scholar]
- 30.Srere PA: Citrate Synthase. In Methods in Enzymology New York, Academid, 1969 [Google Scholar]
- 31.Campbell SE, Tandon NN, Woldegiorgis G, Luiken JJ, Glatz JF, Bonen A: A novel function for fatty acid translocase (FAT)/CD36: involvement in long chain fatty acid transfer into the mitochondria. J Biol Chem 2004; 279: 36235– 36241 [DOI] [PubMed] [Google Scholar]
- 32.McGarry JD, Mills SE, Long CS, Foster DW: Observations on the affinity for carnitine, and malonyl-CoA sensitivity, of carnitine palmitoyltransferase I in animal and human tissues: demonstration of the presence of malonyl-CoA in non-hepatic tissues of the rat. Biochem J 1983; 214: 21– 28 [DOI] [PMC free article] [PubMed] [Google Scholar]
- 33.Benton C, Holloway GP, Campbell SE, Yoshida Y, Tandon NN, Glatz JF, Luiken JJ, Spriet LL, Bonen A: Rosiglitazone increases fatty acid oxidation and fat/CD36 but not CPTI in rat muscle subsarcolemmal and intermyofibrillar mitochondria. J Physiol 2008; 586: 1755– 1766 [DOI] [PMC free article] [PubMed] [Google Scholar]
- 34.Holloway GP, Jain SS, Bezaire VS, Han XX, Glatz JF, Luiken JJ, Harper ME, Bonen A: FAT/CD36 null mice reveal that mitochondrial FAT/CD36 is required to up-regulate mitochondrial fatty acid oxidation in contracting muscle. Am J Physiol Regul Integr Comp Physiol 2009; 297: R960– R967 [DOI] [PubMed] [Google Scholar]
- 35.Holloway GP, Lally J, Nickerson JG, Alkhateeb H, Snook LA, Heigenhauser GJF, Calles-Escandon J, Glatz JFC, Luiken JJFP, Spriet LL, Bonen A: Fatty acid binding protein facilitates sarcolemmal fatty acid transport but not mitochondrial oxidation in rat and human skeletal muscle. J Physiol 2007; 582: 393– 405 [DOI] [PMC free article] [PubMed] [Google Scholar]
- 36.Kramer HF, Witczak CA, Taylor EB, Fujii N, Hirshman MF, Goodyear LJ: AS160 regulates insulin- and contraction-stimulated glucose uptake in mouse skeletal muscle. J Biol Chem 2006; 281: 31478– 31485 [DOI] [PubMed] [Google Scholar]
- 37.Schertzer JD, Plant DR, Lynch GS: Optimizing plasmid-based gene transfer for investigating skeletal muscle structure and function. Mol Ther 2006; 13: 795– 803 [DOI] [PubMed] [Google Scholar]
- 38.Mir LM, Bureau MF, Gehl J, Rangara R, Rouy D, Caillaud JM, Delaere P, Branellec D, Schwartz B, Scherman D: High-efficiency gene transfer into skeletal muscle mediated by electric pulses. Proc Natl Acad Sci U S A 1999; 96: 4262– 4267 [DOI] [PMC free article] [PubMed] [Google Scholar]
- 39.Dona M, Sandri M, Rossini K, Dell'Aica I, Podhorska-Okolow M, Carraro U: Functional in vivo gene transfer into the myofibers of adult skeletal muscle. Biochem Biophys Res Commun 2003; 312: 1132– 1138 [DOI] [PubMed] [Google Scholar]
- 40.Bertrand A, Ngo-Muller V, Hentzen D, Concordet JP, Daegelen D, Tuil D: Muscle electrotransfer as a tool for studying muscle fiber-specific and nerve-dependent activity of promoters. Am J Physiol Cell Physiol 2003; 285: C1071– C1081 [DOI] [PubMed] [Google Scholar]
- 41.Koves TR, Ussher JR, Noland RC, Slentz D, Mosedale M, Ilkayeva O, Bain J, Stevens R, Dyck JR, Newgard CB, Lopaschuk GD, Muoio DM: Mitochondrial overload and incomplete fatty acid oxidation contribute to skeletal muscle insulin resistance. Cell Metab 2008; 7: 45– 56 [DOI] [PubMed] [Google Scholar]
- 42.De Feyter HM, Lenaers E, Houten SM, Schrauwen P, Hesselink MK, Wanders RJ, Nicolay K, Prompers JJ: Increased intramyocellular lipid content but normal skeletal muscle mitochondrial oxidative capacity throughout the pathogenesis of type 2 diabetes. FASEB J 2008; 22: 3947– 3955 [DOI] [PubMed] [Google Scholar]
- 43.Garcia-Roves P, Huss JM, Han DH, Hancock CR, Iglesias-Gutierrez E, Chen M, Holloszy JO: Raising plasma fatty acid concentration induces increased biogenesis of mitochondria in skeletal muscle. Proc Natl Acad Sci U S A 2007; 104: 10709– 10713 [DOI] [PMC free article] [PubMed] [Google Scholar]
- 44.Bonen A, Parolin ML, Steinberg GR, Calles-Escandon J, Tandon NN, Glatz JF, Luiken JJ, Heigenhauser GJ, Dyck DJ: Triacylglycerol accumulation in human obesity and type 2 diabetes is associated with increased rates of skeletal muscle fatty acid transport and increased sarcolemmal FAT/CD36. FASEB J 2004; 18: 1144– 1146 [DOI] [PubMed] [Google Scholar]
- 45.Bonen A, Holloway GP, Tandon NN, Han XX, McFarlan J, Glatz JF, Luiken JJ: Cardiac and skeletal muscle fatty acid transport and transporters and triacylglycerol and fatty acid oxidation in lean and Zucker diabetic fatty rats. Am J Physiol Regul Integr Comp Physiol 2009; 297: R1202– R1212 [DOI] [PubMed] [Google Scholar]
- 46.Sebastian D, Guitart M, Garcia-Martinez C, Mauvezin C, Orellana-Gavalda JM, Serra D, Gomez-Foix AM, Hegardt FG, Asins G: Novel role of FATP1 in mitochondrial fatty acid oxidation in skeletal muscle cells. J Lipid Res 2009; 50: 1789– 1799 [DOI] [PMC free article] [PubMed] [Google Scholar]
- 47.Bezaire V, Bruce CR, Heigenhauser GJ, Tandon NN, Glatz JF, Luiken JJ, Bonen A, Spriet LL: Identification of fatty acid translocase on human skeletal muscle mitochondrial membranes: essential role in fatty acid oxidation. Am J Physiol Endocrinol Metab 2006; 290: E509– E515 [DOI] [PubMed] [Google Scholar]
- 48.Takahashi M, Hood DA: Protein import into subsarcolemmal and intermyofibrillar skeletal muscle mitochondria: differential import regulation in distinct subcellular regions. J Biol Chem 1996; 271: 27285– 27291 [DOI] [PubMed] [Google Scholar]
- 49.Johnson JH, Ogawa A, Chen L, Orci L, Newgard CB, Alam T, Unger RH: Underexpression of beta cell high Km glucose transporters in noninsulin-dependent diabetes. Science 1990; 250: 546– 549 [DOI] [PubMed] [Google Scholar]
- 50.Greene SF, Johnson PR, Eiffert KC, Greenwoodt MR, Stern JS: The male obese Wistar diabetic fatty rat is a new model of extreme insulin resistance. Obes Res 1994; 2: 432– 443 [DOI] [PubMed] [Google Scholar]


