Abstract
OBJECTIVE
Hypothalamic leptin resistance is found in most common forms of obesity, such as diet-induced obesity, and is associated with increased expression of suppressor of cytokine signaling 3 (Socs3) in the hypothalamus of diet-induced obese animals. This study aims to determine the functional consequence of Socs3 upregulation on leptin signaling and obesity, and to investigate whether Socs3 upregulation affects energy balance in a cell type–specific way.
RESEARCH DESIGN AND METHODS
We generated transgenic mice overexpressing Socs3 in either proopiomelanocortin (POMC) or leptin receptor–expressing neurons, at levels similar to what is observed in diet-induced obesity.
RESULTS
Upregulation of Socs3 in POMC neurons leads to impairment of STAT3 and mammalian target of rapamycin (mTOR)–S6K-S6 signaling, with subsequent leptin resistance, obesity, and glucose intolerance. Unexpectedly, Socs3 upregulation in leptin receptor neurons results in increased expression of STAT3 protein in mutant hypothalami, but does not lead to obesity.
CONCLUSIONS
Our study establishes that Socs3 upregulation alone in POMC neurons is sufficient to cause leptin resistance and obesity. Socs3 upregulation impairs both STAT3 and mTOR signaling before the onset of obesity. The lack of obesity in mice with upregulated Socs3 in leptin receptor neurons suggests that Socs3's effect on energy balance could be cell type specific. Our study indicates that POMC neurons are important mediators of Socs3's effect on leptin resistance and obesity, but that other cell types or alteration of other signaling regulators could contribute to the development of obesity.
Consumption of fat-rich diets has contributed to an increase in obesity. Leptin, an adipose-derived hormone, acts in the brain to decrease feeding and increase energy expenditure. However, leptin's anorexigenic effects are diminished in diet-induced obese animals despite an increase in circulating levels, a condition termed leptin resistance. This phenomenon is observed in the majority of obese patients who are unresponsive to exogenous leptin treatment (1). Leptin binds to the long form of the leptin receptor (LepRb) activating signal transducer and activator of transcription 3 (STAT3) (2). Leptin also activates phosphatidylinositol 3 kinase–mammalian target of rapamycin (mTOR)–S6K signaling in hypothalamic neurons (3–5). A hallmark of diet-induced leptin resistance is impairment of leptin signaling in hypothalamic neurons (6–10). Intriguingly, leptin resistance appears to be region specific with the arcuate nucleus being more severely affected (8,10).
To date, the mechanism of leptin resistance remains poorly understood. Socs3 is a plausible causal factor, as its expression is elevated in the hypothalamus during early stages of high-fat feeding (8). Socs3 binds to Tyr985 of leptin receptor and Janus kinase 2, inhibiting leptin-induced STAT3 signaling (11). Mice with deletion of Socs3 in the whole brain or proopiomelanocortin (POMC) neurons, key leptin target neurons in the arcuate nucleus of the hypothalamus, are resistant to diet-induced obesity (12,13). However, there are other negative regulators of leptin signaling, such as protein tyrosine phosphatase 1B, whose deletion protects against diet-induced obesity (14–17). Thus, it is unclear whether leptin resistance requires the action of multiple factors, or whether it can be induced by Socs3 upregulation alone. It is also unknown whether Socs3 upregulation in different subsets of leptin target neurons acts additively to induce leptin resistance. Although Socs3 is known to inhibit phosphorylation of STAT3 (pSTAT3) signaling, it is not clear whether Socs3 affects other leptin signaling pathways in hypothalamic neurons. In this study, we generated transgenic mice in which Socs3 is modestly overexpressed in either POMC or LepRb neurons. We show that Socs3 upregulation in POMC neurons antagonizes pSTAT3 and mTOR-S6K signaling with subsequent leptin resistance and obesity. Surprisingly, overexpression of Socs3 in LepRb neurons does not cause obesity, suggesting that Socs3 plays a cell type–specific role in energy balance regulation.
RESEARCH DESIGN AND METHODS
Generation of transgenic mice that express Cre-activatable Socs3 allele.
A DNA fragment containing the cytomegalovirus (CMV) promoter was released from plasmid PHMCMV5 and subcloned into the BamHI site of the pΔE1sp1A vector (kindly provided by Dr. Mark Kay, Stanford University). A full-length mouse Socs3 cDNA was placed behind a loxP-flanked polyadenylation cassette (4xpA; floxed “stop” cassette) derived originally from pROSA26-R (18). The resulting fragment was subcloned into the pΔE1sp1A downstream of the CMV promoter. The stop cassette's effectiveness has been validated (4). A linear 10-kilobase DNA fragment containing CMV-floxed stop-Socs3-polyA sequences was purified and microinjected into fertilized eggs from C57BL6/J donors. The sequence of the entire Socs3 cDNA was verified by sequencing. Transgenic mice were genotyped using TATTAGGTCCCTCGACCTGCAGCC and TACACAGTCGAAGCGGGGAACTGG.
Mouse genetics.
Tg.Nestin-Cre mice were purchased from The Jackson Laboratory. Generation and use of the LepRb-Cre mice were previously described (19,20). Tg.Pomc-Cre mice have been validated by multiple research groups (4,20–24). These mice were backcrossed to C57BL6/J background for eight generations. LepRb-Cre/+ or Tg.Pomc-Cre/+ female mice were crossed with Tg.CMV-Flox-stop-Socs3 male mice described above. The control cohort contains three different genotypes: +/+;+/+ mice, +/+;Tg.CMV-Flox-stop-Socs3/+ mice, and Tg.LepRb-Cre or Tg.Pomc-Cre/+;+/+ mice. No phenotypic differences were seen among different control groups so they were pooled for analysis. Mutant mice are doubly heterozygous for the Socs3 allele and the POMC-Cre or LepRb-Cre allele, and are designated POMC-Socs3-OE or LepRb-Socs3-OE. For all experiments, male age-matched controls and mutants were used with the exception of Fig. 1D and Fig. 1E, for which both males and females were used. Mice were housed in barrier facility with a 0700-light/1900-dark cycle. Mice were fed standard mouse chow (21.6% kcal from fat; Purina mouse diet 5058) or high-fat diet (60% kcal from fat; Research Diet D12492). All experiments were performed under a protocol approved by University of California San Francisco Institutional Animal Care and Use Committee.
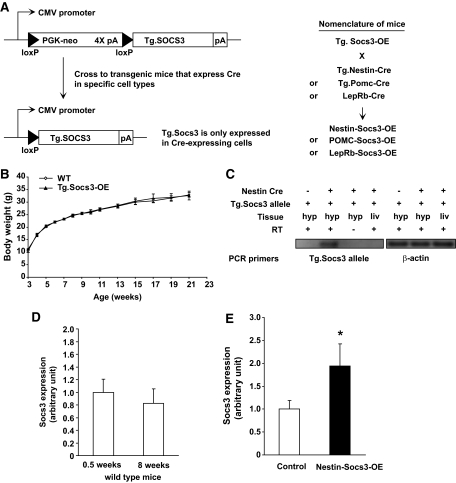
FIG. 1.
Generation and characterization of transgenic mice that express Cre-activatable Socs3. A: Transgenic construct to overexpress Socs3 in a Cre-activatable way. In cells in which Cre is absent, Socs3 is not expressed because of the upstream stop cassette, which consists of four copies of polyadenylation signal (pA). In cells in which Cre is expressed, the stop cassette is removed and Socs3 expression is driven by the CMV promoter. Nomenclature of mice used in this study is listed. B: Transgenic mice carrying the Tg.Socs3-OE allele did not show a difference in body weight (Tg.Socs3-OE/+) compared with wild-type (+/+) controls (controls n = 6–30, Tg.Socs3-OE n = 5–20). C: Transgenic Socs3 expression is Cre dependent. Tg.Socs3-OE mice were crossed with mice carrying Nestin-Cre. Semiquantitative real-time RT-PCR showing differential expression of transgenic Socs3 (Tg.Socs3) in the hypothalamus where Nestin-Cre is expressed, and in liver where Nestin-Cre is not expressed. Primers were specific to the Socs3 transgene. Hyp, hypothalamus; Liv, liver. D: Socs3 mRNA expression was analyzed in 0.5-week-old control and Nestin-Socs3-OE mutant mice (controls n = 12, mutants n = 6). E: Hypothalamic Socs3 mRNA expression was analyzed in 0.5- and 8-week-old wild-type C57BL6/J mice (n = 6–8). All mice were fed a chow diet. *P < 0.05 by Student t test.
Body composition analysis.
Lean and fat mass in live mice was determined by dual-energy X-ray absorptiometry (DEXA) using a PIXImus II (Lunar). The DEXA apparatus was calibrated with a phantom mouse with manufacturer-set value of bone density and fat mass. Fat pad weights were determined by postmortem dissection.
Leptin sensitivity and indirect calorimetry.
Mice were injected intraperitoneally twice daily (0900 and 1700) with saline for 3 days and leptin 2.5 mg/kg (National Hormone Peptide Program) twice on the fourth day. Food intake was calculated as the average of the 3-day saline treatment and compared with the 24-h period after the first leptin injection. To measure oxygen consumption, mice were analyzed for body composition, placed into an Oxymax Respirometer (Columbus Instruments), and allowed 24 h to acclimatize before taking measurements. Oxygen consumption is normalized to lean body mass as determined by DEXA analysis.
Measurement of leptin, insulin, and glucose levels.
Blood was collected via mandibular vein puncture under either fed (leptin) or 4- to 6-h–fasted (insulin) conditions. Hormones were measured with a leptin ELISA kit (Crystal Chem) and an insulin ELISA kit (Alpco). For glucose tolerance tests, mice were fasted for 6 h, and injected intraperitoneally with glucose (1.5 g/kg). Blood glucose was measured with a glucometer (Freestyle; Abbott Diabetes Care) at indicated times. For insulin tolerance tests, mice were fasted for 2 h, and intraperitoneally injected with insulin (1 U/kg, Novolin R). Blood glucose was measured as above.
Western blotting analysis.
Mice were injected with either saline or leptin 3 mg/kg i.p., and after 1 h the hypothalamus was dissected and lysed by sonication in cell lysis buffer (Cell Signaling). Lysates were quantified with Bradford reagent (Bio-Rad Laboratories). Membranes were blocked with 5% milk in Tris-buffered saline with Tween for 1 h and incubated with primary antibody overnight at 4°C. Blots were incubated in secondary antibody (1:2000 goat anti-rabbit–conjugated horseradish peroxidase) for 1 h at room temperature. Primary antibodies used are as follows: polyclonal anti-STAT3 1:1,000, polyclonal anti–phospho (Tyr-705)-STAT3 1:1,000 (Cell Signaling Technology), and polyclonal anti–glyceraldehyde-3-phosphate dehydrogenase (GAPDH) 1:2000 (Santa Cruz Biotechnology).
mRNA expression.
Extraction of hypothalamic RNA was performed as previously described (20,25). RNA (1 μg) was reverse transcribed, then PCR amplified using a 7900HT Fast Real-Time PCR System (Applied Biosystems). β-actin was used as internal control. TaqMan gene expression assays (Applied Biosystems) were used for Pomc, Agrp, Npy, Socs3, and β-actin detection. A custom TaqMan gene expression assay (Applied Biosystems) was used for Tg.Socs3 detection: CTTATCGATACCGTCGACCTC and ACTTGCTGTGGGTGACCA and probe: AGATCCACGCTGGCTCCGTG.
Immunofluorescence analysis.
LepRb-Soc3-OE or POMC-Socs3-OE fed mutant and control mice were injected intraperitoneally with leptin 3 mg/kg or saline, and perfused with 4% paraformaldehyde 45 min later. Immunofluorescence analysis was carried out as previously described (25).
Cell size and cell counting.
All immunofluorescence images were blinded before analysis. ACTH-, pSTAT3-, or pS6-positive cells from matched sections ranging from bregma −1.22 to −1.58 (Paxinos Mouse Brain Atlas) were counted. For cell size determination, the average area and perimeter of ACTH-positive cells were analyzed using the “analyze particles” function in ImageJ software. Results were verified by investigators to rule out nonspecific signals.
Statistics.
Analysis of compared groups was performed by either two-tailed Student t test or two-way ANOVA (J.M.P.) as specified in figure legends. Values represent mean ± SEM.
RESULTS
Generation of transgenic mice to overexpress Socs3 in a cell type–specific manner.
To investigate Socs3 upregulation in specific neuronal subtypes, we generated transgenic mice carrying a wild-type Socs3 transgene (Tg.Socs3) placed downstream of a floxed transcriptional stop cassette (Fig. 1A). The stop cassette is removed upon Cre-mediated recombination, allowing Tg.Socs3 to be expressed under the constitutively active CMV promoter. Mice carrying the conditional Socs3 allele (Tg.Socs3-OE) were born in Mendelian ratio and were indistinguishable from their wild-type littermates in growth and body weight (Fig. 1B). By weaning, Nestin-Socs3-OE mice were 33% smaller than Tg.Nestin-Cre control mice (mutants 6.46 ± 0.24 g, controls 9.62 ± 0.37). This reduction in body weight was observed in two independent Tg.Socs3-OE lines derived from different transgenic founders, suggesting that the phenotype was not due to position effects of transgene integration.
Hypothalamic Socs3 expression is very low under basal conditions (26), making it difficult to quantify a modest change by in situ approach. We thus crossed Tg.Socs3-OE with Tg.Nestin-Cre mice (the resultant mutants were named Nestin-Socs3-OE) so that Tg.Socs3 would be overexpressed in the entire brain, making quantitative assays possible. Using PCR primers specific for the Tg.Socs3 transgene, Tg.Socs3 mRNA expression was detected in the brain where Nestin-Cre was expressed, but not in peripheral tissues, such as liver, where Nestin-Cre was not expressed (Fig. 1C). This result confirms that expression of Tg.Socs3 is Cre dependent. By real-time RT-PCR, Socs3 expression was elevated about twofold in the hypothalamus of 0.5-week-old Nestin-Socs3-OE mutants (Fig. 1D). This age was chosen because no phenotypic difference was detected between controls and mutants at this age. This increase in Socs3 expression would likely persist into adulthood because CMV promoter activity is constitutive and endogenous Socs3 expression does not change significantly between 0.5 and 8 weeks (Fig. 1E) and in mid-adulthood (27). This magnitude of Socs3 overexpression is within the physiologic range of Socs3 upregulation (twofold) observed in diet-induced obesity (8,28). However, it should be acknowledged that this quantification method could potentially lead to slight overestimation or underestimation of Socs3 overexpression in certain cells.
Socs3 upregulation in POMC neurons does not affect POMC number, cell size, projection outgrowth, or mRNA expression. If diet-induced leptin resistance and obesity are caused by the upregulation of Socs3, then upregulating Socs3 in neuronal cell types important for energy balance under normal chow-fed conditions should lead to leptin resistance and obesity. To explore this, we crossed Tg.Socs3-OE mice with Tg.Pomc-Cre mice (4,20–24). POMC-Socs3-OE mutant mice (Tg.Pomc-Cre/+, Tg.Socs3-OE/+) were born at Mendelian ratio and were phenotypically indistinguishable from control littermates in early adulthood. Cre-mediated recombination was observed in developing Tg.Pomc-Cre embryos as early as embryonic day 13.5 postcoitus, indicating the timing of Socs3 upregulation in these neurons.
We investigated whether Socs3 upregulation in POMC neurons resulted in any developmental defects. Hypothalamic sections were prepared from 6-week-old weight-matched control and POMC-Socs3-OE mice. The number and size of POMC neurons were identical (supplementary Fig. 1, available in an online appendix at http://diabetes.diabetesjournals.org/cgi/content/full/db09-1024/DC1), as were POMC projection patterns (supplementary Fig. 2). We also examined whether Socs3 upregulation in POMC neurons altered POMC expression. POMC-Socs3-OE mutants and controls were killed at 8 weeks and 25–26 weeks of age. RNA was extracted from hypothalamic tissues and expression of Pomc and Agrp was analyzed by real-time PCR. No significant difference in Pomc or Agrp expression was detected at 8 weeks, although a slight but not significant decrease in Pomc expression was detected at 25–26 weeks (supplementary Fig. 3A and B). No difference in pituitary Pomc expression was observed (supplementary Fig. 3C). Socs3 expression was not altered (supplementary Fig. 3E). This is likely due to the fact that POMC neurons represent only a very small fraction of total cells in the arcuate nucleus, and the modest overexpression of Socs3 in these neurons would be masked when whole hypothalamus was analyzed.
Overexpression of Socs3 in POMC neurons results in increased body weight and adiposity.
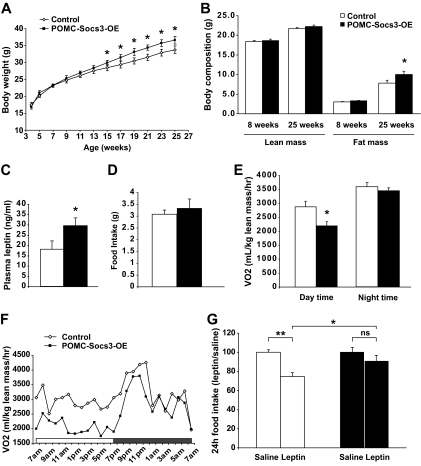
At 8 weeks of age, both lean and fat mass did not differ in controls and POMC-Socs3-OE mutants as determined by DEXA analysis (Fig. 2B). Body length was also identical (controls 91.3 ± 0.6 mm vs. mutants 92.8 ± 1.0). However, starting from 15 weeks, mutant mice displayed a modest but significant increase in body weight (Fig. 2A), attributable to a significant increase in fat mass (Fig. 2B). Plasma leptin levels were elevated nearly twofold in mutants, consistent with elevated body adiposity (Fig. 2C). Thus, upregulation of Socs3 in POMC neurons results in an age-dependent increase in body weight and adiposity.
FIG. 2.
Socs3 overexpression in POMC neurons leads to increased body weight and adiposity, decreased resting energy expenditure, and resistance to leptin's anorexigenic effects. A: Body weight of POMC-Socs3-OE on chow diet at indicated ages. Mutants became significantly heavier at 15 weeks of age (controls n = 9–13, mutants n = 7–10). B: Analysis of lean mass and fat mass by DEXA of POMC-Socs3-OE at 8 and 25 weeks of age (controls n = 10, mutants n = 8). (C) Plasma leptin levels under fed conditions for 25-week-old POMC-Socs3-OE mice were significantly higher (controls n = 9, mutants n = 8). D: A 24-h food intake was measured in 8-week-old controls and POMC-Socs3-OE mutant mice (controls n = 11, mutants n = 7). E and F: Oxygen consumption was measured in 8-week-old mice, and the values were normalized to lean body mass of each mouse. Daytime: 1100–1700; nighttime: 1900–0700. A representative trace is shown in F. G: The 9-week-old POMC-Socs3-OE and control mice were injected intraperitoneally with saline twice daily for 3 consecutive days and leptin (2.5 mg/kg) twice on the fourth day. A 24-h food intake after leptin treatment was reported as a ratio of food intake after saline treatment (controls n = 11, mutants n = 7). Data represent mean ± SEM. *P < 0.05, **P < 0.01, between controls and mutants as determined by 2-way ANOVA using litters and genotypes as variables. ns, nonsignificant.
We measured food intake in 8-week-old weight- and fat-matched mice and found no significant difference (Fig. 2D). However, mutant mice showed significantly lower oxygen consumption during daytime resting period, suggesting that POMC-Socs3-OE mice have lower resting energy expenditure (Fig. 2E and F). Decreased energy expenditure preceding the onset of obesity suggests that it may be causal for subsequent weight gain.
Socs3 upregulation in POMC neurons leads to resistance to leptin's anorexigenic effect.
To assess whether Socs3 upregulation in POMC neurons antagonizes leptin function, POMC-Socs3-OE and control littermates were analyzed at 9 weeks of age, a time before any difference in body weight and adiposity could be detected. DEXA analysis confirmed that experimental groups were indistinguishable in body weight (controls 26.1 ± 1.0 g vs. mutants 26.4 ± 0.6) and percentage of adiposity (controls 14.5 ± 1.1 vs. mutants 14.4 ± 0.7). Leptin (2.5 mg/kg) treatment caused a significant decrease in food intake in the controls compared with saline, but it had no effect on POMC-Socs3-OE mice (Fig. 2G). This result suggests that Socs3 expression in POMC neurons causes acute leptin resistance, an effect that is not secondary to increased adiposity.
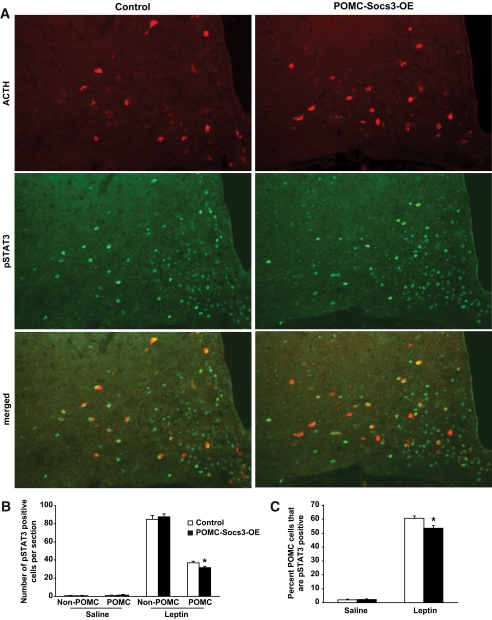
Socs3 upregulation in POMC neurons antagonizes leptin-stimulated STAT3 signaling. We next investigated the signaling mechanisms by which Socs3 regulates leptin function. Six-week-old POMC-Socs3-OE and weight-matched controls were treated with leptin or saline, and perfused 45 min later. Hypothalamic sections were prepared and double immunofluorescence analysis was carried out to examine pSTAT3 in POMC neurons. Whereas pSTAT3 immunoreactivity was barely detectable in saline-treated animals (supplementary Fig. 4), leptin treatment dramatically activated pSTAT3 in hypothalamic neurons, and to a significantly lesser extent in the mutant POMC neurons (Fig. 3A–C). This reduction was not seen in non-POMC neurons within the arcuate nucleus. This result suggests that Socs3 upregulation in POMC neurons antagonizes leptin-induced STAT3 signaling prior to the obesity phenotype.
FIG. 3.
Leptin-induced STAT3 signaling is reduced in POMC neurons of POMC-Socs3-OE mice. A: The 6-week-old control and POMC-Socs3-OE mice were injected with either saline or leptin (3 mg/kg), and perfused 45 min later. Double immunofluorescence analysis was carried out to examine pSTAT3 in the POMC neurons using antibodies against Tyr705-STAT3 (green) and ACTH (red). B: Number of pSTAT3-positive cells showed that leptin-induced pSTAT3 was reduced in the POMC but not other arcuate neurons in the mutant mice. C: Percentage of POMC neurons that are pSTAT3 positive upon saline or leptin treatment in control and mutant mice. n = 3–5 sections per mouse from 3–5 mice per group between bregma −1.22 and −1.58. Data represent mean ± SEM. *P < 0.05, between controls and mutants as determined by Student t test. (A high-quality digital representation of this figure is available in the online issue.)
Socs3 upregulation in POMC neurons antagonizes mTOR-S6 signaling.
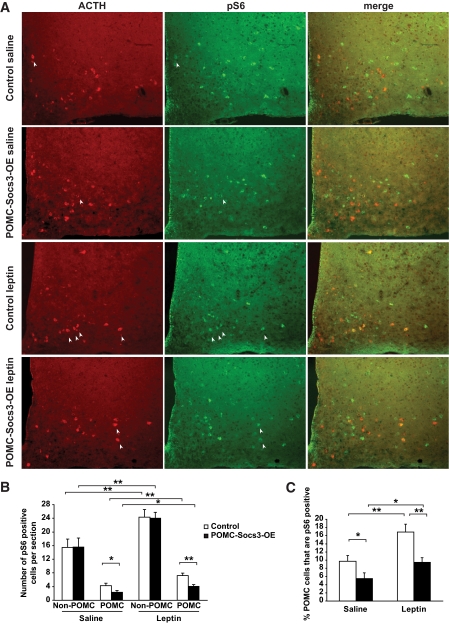
A recent study shows that leptin-stimulated mTOR signaling is reduced in the hypothalamus of diet-induced obese rodents (10). We therefore explored whether this pathway could be modulated by Socs3 upregulation in POMC neurons. mTOR activation leads to activation of S6K, which phosphorylates its downstream target S6. Thus, phosphorylation of S6 protein (pS6) marks the activation of this pathway. A subset of cells within the arcuate nucleus expressed pS6 under basal, fed conditions, and leptin treatment induced a modest but significant increase in the number of pS6-positive cells in this region (Fig. 4A and B). Interestingly, we found that mutant animals exhibited a 50% reduction in pS6 signaling in POMC neurons, and such a reduction was not observed in non-POMC cells in the arcuate (Fig. 4B and C). This result indicates that Socs3 upregulation in POMC neurons causes specific downregulation of the mTOR-S6 pathway. The fact that downregulation of pS6 was observed in only POMC neurons before the onset of obesity suggests that it is a direct consequence of Socs3 upregulation.
FIG. 4.
mTOR-S6 signaling is impaired in POMC neurons of POMC-Socs3-OE mice. A: The 6-week-old control and POMC-Socs3-OE mice were injected with either saline or leptin (3 mg/kg), and perfused 45 min later. Double immunofluorescence analysis was carried out to examine phosphorylation of S6 (pS6) in POMC neurons using antibodies against Ser235/236-S6 (green) and ACTH (red). B: Quantification of POMC and pS6-positive cells showed that pS6 was specifically reduced in POMC neurons but not in other cells in the arcuate nucleus of mutant mice. C: Percentage of POMC neurons that is positive for pS6 after either saline or leptin treatment. n = 3–5 sections per mouse from 3–5 mice per group between bregma −1.22 and −1.58. Data represent mean ± SEM. *P < 0.05, **P < 0.01 for comparisons shown as determined by Student t test. (A high-quality digital representation of this figure is available in the online issue.)
Upregulation of Socs3 in leptin receptor neurons does not cause obesity.
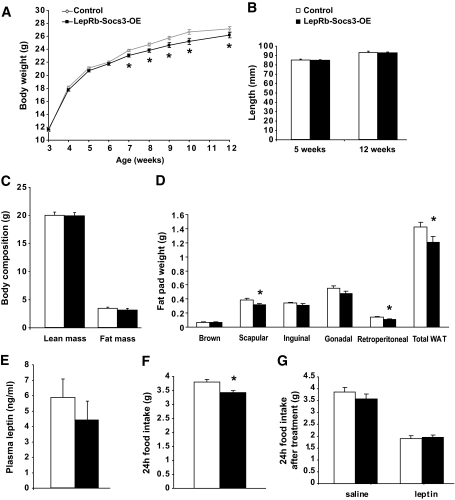
LepRb is expressed in many brain regions (19,29), and POMC neurons represent only a subset of leptin target neurons. Because upregulation of Socs3 in POMC neurons causes modest obesity, we anticipated that upregulation of Socs3 in the entire cohort of leptin receptor neurons would cause a more severe obesity phenotype. To this end, we crossed the Tg.Socs3-OE mice with LepRb-Cre mice (19,25). Cre-mediated recombination first appears in the hypothalamus of LepRb-Cre mice around postnatal days 2–3, and recombination is complete by 8 weeks of age. Mutant mice, designated LepRb-Socs3-OE, were born at Mendelian ratio with no gross abnormalities. To our surprise, mutant mice fed a chow diet did not show a body weight increase, but rather exhibited a subtle but significant reduction in weight starting at 7 weeks of age (Fig. 5A). Body length and lean mass were identical between controls and mutants, suggesting that growth was not impaired (Fig. 5B and C). DEXA analysis revealed a small decrease in fat mass (Fig. 5C), which was consistent with smaller isolated fat depots (Fig. 5D). Leptin levels in the mutants also trended toward a decrease (Fig. 5E). In addition, a small but significant decrease in food intake was observed in 6- to 8-week-old mutants (Fig. 5F).
FIG. 5.
Upregulation of Socs3 in leptin receptor neurons does not result in obesity but rather in a subtle lean phenotype. A: Body weight of LepRb-Socs3-OE on chow diet at indicated ages. Mutants became slightly leaner at 7 weeks of age (controls n = 16–44, mutants n = 10–27). B: Length of LepRb-Socs3-OE at 5 weeks of age (controls n = 14, mutants n = 8) and 12 weeks of age (controls n = 12, mutants n = 7) was identical. C: Analysis of lean mass and fat mass by DEXA at 10 weeks of age (controls n = 12, mutants n = 8). D: The 12-week-old LepRb-Socs3-OE mutants showed significantly decreased interscapular, retroperitoneal, and total white adipose tissue on a chow diet (controls n = 11, mutants n = 8). E: Plasma leptin levels under fed conditions for LepRb-Socs3-OE mice at 12 weeks of age (controls n = 9, mutants n = 5). F: 24-h food intake of LepRb-Socs3-OE mice at 6–8 weeks of age was reduced (controls n = 6, mutants n = 6). G: The 6- to 8-week-old LepRb-Socs3-OE and control mice were injected intraperitoneally with saline twice daily for 3 consecutive days and leptin (2.5 mg/kg) twice on the fourth day. 24-h food intake after leptin treatment was reported as a ratio of food intake after saline treatment (controls n = 6, mutants n = 6). Data represent mean ± SEM. WAT, white adipose tissue. *P < 0.05, between controls and mutants as determined by 2-way ANOVA.
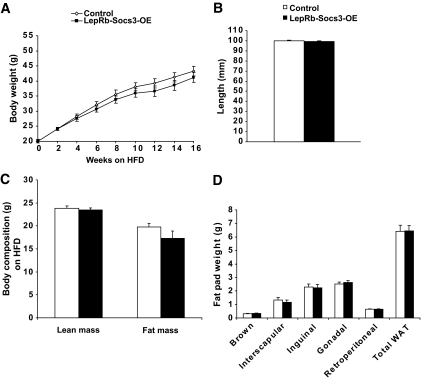
To determine whether Socs3 overexpression in leptin receptor neurons affects leptin's inhibitory effect on food intake, 8-week-old LepRb-Socs3-OE mice and weight-matched controls were given leptin (2.5 mg/kg) or saline, and 24-h food intake was measured. Both controls and mutants ate less in response to leptin treatment (Fig. 5G). Taken together, overexpression of Socs3 in leptin receptor neurons does not augment the obesity phenotype. Absence of obesity was also observed in LepRb-Socs3-OE mutants when fed a high-fat diet (Fig. 6).
FIG. 6.
Upregulation of Socs3 in leptin receptor neurons does not result in obesity when fed a high-fat diet. A: Control and LepRb-Socs3-OE mice were placed on a high-fat diet (60% kcal from fat; Research Diet D12492) at 5 weeks of age for a total of 16 weeks (controls n = 16–19, mutants n = 9–10). B: Body length (nose to anus) of control and mutants was identical after 16 weeks on high-fat diet (controls n = 11, mutants n = 6). C: Body composition analysis by DEXA after 16 weeks on high-fat diet (controls n = 14, mutants n = 8). D: Weight of individual fat pads after 16 weeks on high-fat diet (controls n = 13, mutants n = 9). Data represent mean ± SEM. WAT, white adipose tissue.
Upregulation of Socs3 in leptin receptor neurons leads to upregulation of total STAT3 protein and increased pSTAT3 signaling.
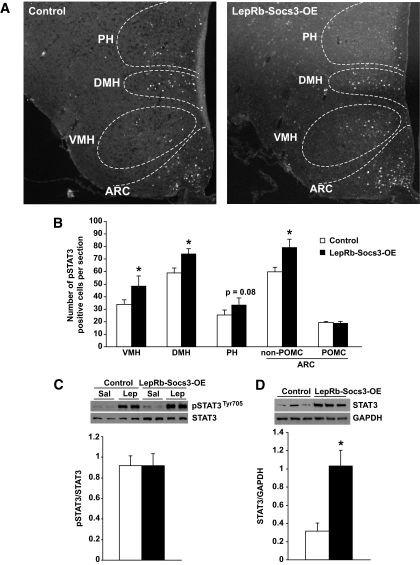
We next investigated whether leptin-induced STAT3 signaling was altered in LepRb-Socs3-OE mice and whether this was region specific. The 6-week-old control and weight-matched LepRb-Socs3-OE mutants were injected intraperitoneally with leptin (3 mg/kg) and perfused 45 min later. pSTAT3 immunoreactive cells were quantified in arcuate nucleus, ventromedial hypothalamus, dorsomedial hypothalamus, and posterior hypothalamic area (Fig. 7A). A small but significant increase in leptin-induced pSTAT3 signal was found in all regions examined except POMC neurons (Fig. 7B). In a parallel experiment, control and mutant mice were fasted overnight, injected intraperitoneally with saline or leptin, and killed 1 h later. Western blot analysis of hypothalamic protein extracts was carried out using equal total protein input. Consistent with our immunofluorescence data, an increase in leptin-induced pSTAT3 signal was observed in both controls and mutants (Fig. 7C). Intriguingly, total STAT3 protein also appeared to increase in mutants, such that leptin-induced pSTAT3 was not enhanced when normalized to total STAT3 (Fig. 7C). To confirm the increase in STAT3 expression, a separate cohort of controls and LepRb-Socs3-OE mutants was analyzed under basal, fed conditions. When normalized to total protein level (GAPDH), a significant increase in total STAT3 was observed (Fig. 7D).
FIG. 7.
Steady-state levels of total STAT3 and phosphorylated STAT3 are increased in LepRb-Socs3-OE mice. A: The 6-week-old control and LepRb-Socs3-OE mice were injected with either saline or leptin (3 mg/kg), and perfused 45 min later. Double immunofluorescence analysis was carried out to examine pSTAT3 in different areas of hypothalamus and in POMC neurons. ARC, arcuate nucleus; VMH, ventromedial hypothalamus; DMH, dorsomedial hypothalamus; PH, posterior hypothalamic area. Representatives of leptin-injected mice are shown to illustrate different regions of the hypothalamus. B: Quantification of pSTAT3-positive cells in different areas of the hypothalamus and in POMC neurons. n = 3–5 sections per mouse from 3–4 mice per group between bregma −1.94 and −2.30. C: LepRb-Socs3-OE and control mice were fasted overnight and injected with leptin (3 mg/kg). Mice were killed 1 h later; hypothalamic protein extract was prepared. Western blot analysis was performed with equal amount of total protein input, and pSTAT3 was examined. The same blots were stripped and blotted with an antibody to detect total STAT3 protein levels. Sal, saline; Lep, leptin. D: Free-fed LepRb-Socs3-OE and control mice were killed, and hypothalamic protein extracts were prepared. Western blot analysis was performed to examine total STAT3 expression levels. The same blot was stripped and subsequently blotted with GAPDH. *P < 0.05, between controls and mutants as determined by Student t test.
Regulation of glucose homeostasis in response to Socs3 upregulation in POMC or LepRb neurons.
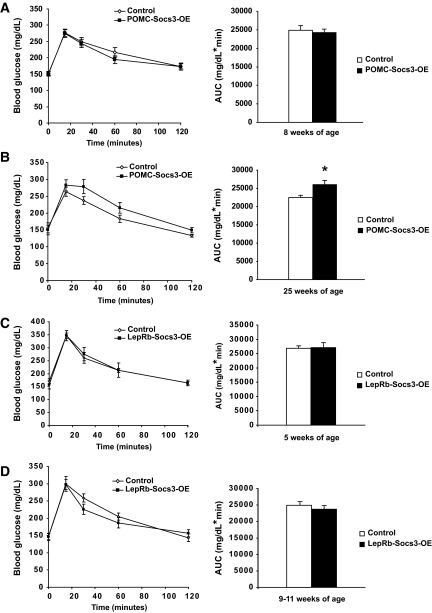
To assess whether Socs3 upregulation affects glucose homeostasis, glucose tolerance tests were carried out. POMC-Socs3-OE mutant mice exhibited similar glucose tolerance as controls at 8 weeks of age prior to obesity, but this was impaired in 25-week-old mutants after exhibiting a modest obesity phenotype (Fig. 8A and B). Fasting insulin levels were slightly but not significantly higher in the mutants (controls 3.57 ± 0.65 μg/l; mutants 4.63 ± 0.88; n = 8–9), and both genotypes exhibited similar insulin tolerance (supplementary Fig. 5). Similarly, LepRb-Socs3-OE mutants showed identical glucose tolerance at 5 weeks of age, and a slight trend toward improved glucose tolerance in older age (Fig. 8C and D). At 12 weeks of age, insulin levels were not significantly different on chow diet (controls 1.02 ± 0.14 μg/l; mutants 1.25 ± 0.21, n = 5–6) or after 16 weeks on high-fat diet (controls 7.94 ± 1.34; mutants 7.46 ± 0.66, n = 8–12). Fasting glucose levels were similar at all ages in all genotypes (Fig. 8A–D). Thus, Socs3 upregulation in either POMC or leptin receptor neurons does not result in abnormal glucose homeostasis, and the impaired glucose tolerance seen in older POMC-Socs3-OE mice is likely secondary to increased adiposity.
FIG. 8.
Effects of Socs3 upregulation on glucose homeostasis. A and B: POMC-Socs3-OE and control mice at 8 weeks (A) or 25 weeks (B) of age were fasted for 6 h and injected with 1.5 g/kg glucose. Glucose levels were measured from tail blood using a glucometer. Area under the curve (AUC) was presented. Control n = 32 (A), n = 6 (B); mutants n = 19 (A), n = 5 (B). C and D: LepRb-Socs3-OE and control mice at 5 (C) or 9–11 (D) weeks of age were fasted for 6 h, and injected with 1.5 g/kg glucose. Glucose levels were measured from tail blood using a glucometer. AUC was presented. Control n = 9–11, mutants n = 7–10. Data represent mean ± SEM. *P < 0.05 between controls and mutants. Analysis was performed by Student t test.
DISCUSSION
In this study, we developed a transgenic mouse model to moderately upregulate Socs3 in POMC or leptin receptor neurons. We show that Socs3 upregulation alone in POMC neurons is sufficient to cause leptin resistance and obesity. In contrast, the lack of obesity in LepRb-Socs3-OE mice was unexpected. Several possible mechanisms exist to explain this paradox. First, Socs3 may exert different functions in different leptin receptor neurons. For example, deletion of LepRb from POMC or SF1 neurons results in a similar increase in body weight (30,31). However, deletion of Socs3 gene from POMC neurons results in resistance to diet-induced obesity, whereas deletion of Socs3 in SF1 neurons affects glucose homeostasis but not body weight (13,32). Alternatively, Socs3 may regulate energy balance in a leptin-independent way. It has been shown that cytokine expression increases in diet-induced obesity, and neuroinflammation may play an important role in the etiology of diet-induced obesity (33–36). Thus, upregulation of Socs3 could diminish cytokine signaling in specific neuronal subtypes, thereby reducing neuroinflammation and mitigating weight gain. Finally, compensatory mechanisms may have developed in the LepRb-Socs3-OE mice, thus masking the development of obesity. We have detected increased expression of STAT3 protein in the hypothalamus of the LepRb-Socs3-OE mice, suggesting that this may represent a compensatory mechanism to counter the negative effect of Socs3 upregulation on STAT3 signaling. At present, the mechanism underlying increased STAT3 expression is unclear. It has been shown that leptin-deficient ob/ob mice, which are obese, have reduced Stat3 expression in the hypothalamus, although the underlying molecular mechanism has not been elucidated (37). mTOR has been shown to regulate STAT3 protein expression in breast cancer cell lines (38), and we show here that Socs3 regulates mTOR-S6 signaling pathway in POMC neurons. However, regulation of mTOR-S6 signaling is complex in that mTOR activities in different hypothalamic neurons are differentially regulated by leptin (39). Thus, it is possible that Socs3 upregulation could differentially regulate mTOR activity in a cell type–specific manner, which in turn affects STAT3 expression in discrete cell populations. However, it is equally possible that altered Stat3 expression in the hypothalamus is a secondary effect of altered whole-body physiology.
It is intriguing that upregulation of Socs3 in POMC neurons results in leptin resistance and obesity. Among all the brain regions that express leptin receptor, the arcuate nucleus is uniquely situated next to the median eminence, a circumventricular organ with an incomplete blood-brain barrier. Neurons located within the arcuate have direct contact with circulating leptin, and can respond more rapidly and sensitively (40). Because of their constant communication with leptin, insulin, fatty acids, cytokines, and other inflammatory molecules, all of which would modulate Socs3 expression, POMC neurons likely experience regular dynamic changes in Socs3 expression. In contrast, Socs3 expression in other brain regions is normally low, and any elevation may be perceived as pathologic, which could trigger compensatory regulation. Consistent with this notion, diet-induced Socs3 upregulation as well as leptin resistance are observed primarily in the arcuate but not other hypothalamic sites (8,10). Taken together, our results suggest that POMC neurons play an important role in mediating Socs3's effects on leptin resistance and obesity. Although no data are available to address whether Socs3 is upregulated in a cell type–specific fashion during the development of obesity, our study does not exclude the possibility that Socs3 upregulation in certain subsets of LepRb neurons or in non–LepRb-expressing cells contributes to obesity. It is also possible that the concerted action of multiple negative regulators of leptin signaling is required for development of severe obesity. In addition, low levels of leptin receptor are present in some peripheral tissues, although the importance of peripheral leptin action in energy balance remains controversial (41,42). Because minimal Cre-mediated recombination is detected in peripheral tissues of LepRb-Cre mice, our current data could not address the contribution of peripheral Socs3 expression to diet-induced obesity.
Diet-induced leptin resistance manifests as reduced leptin signaling in hypothalamic neurons, but the timing of downregulation of different pathways is controversial. It has been shown that leptin-induced pSTAT3 is reduced in the arcuate nucleus after 6 days of high-fat feeding (8). However, in other studies, leptin-induced phosphatidylinositol 3 kinase and mTOR signaling is impaired prior to defects in pSTAT3 signaling (9,10). Although some of these discrepancies may be due to differences in diet composition, age, genetic background, housing condition, or dose and time course of leptin, these studies suggest that downregulation of a specific signaling pathway may trigger functional leptin resistance and obesity, which in turn causes downregulation of other leptin signaling pathways. We show that upregulation of Socs3 in POMC neurons inhibits pSTAT3 and mTOR pathways concurrently, which precedes the onset of weight gain. Thus, Socs3 may induce leptin resistance and obesity by downregulating multiple leptin pathways concomitantly. It has been shown that different leptin signaling pathways mediate specific subsets of leptin functions, such as energy balance, glucose homeostasis, growth, reproduction, and immunity (5,25,28,43,44). Thus, downregulation of multiple leptin signaling pathways by Socs3 could effectively inhibit these leptin functions, most of which are impaired in diet-induced obesity. In summary, our study establishes a causal role for Socs3 in leptin resistance and obesity, and elucidates its underlying signaling mechanisms. In light of the current obesity epidemic, this study sheds light on the etiology of diet-induced leptin resistance and obesity in humans.
Supplementary Material
ACKNOWLEDGMENTS
A.W.X. was supported by research grant from the American Diabetes Association (ADA 7-07-JF-68). A.S.R. was supported in part by a Pediatric Endocrine Training Grant T32 DK07161. L.E.O. was supported by the Swedish Research Council. This work was also supported in part by University of California, San Francisco core facilities funded by National Institutes of Health DERC P30 DK-063720.
No potential conflicts of interest relevant to this article were reported.
Footnotes
The costs of publication of this article were defrayed in part by the payment of page charges. This article must therefore be hereby marked “advertisement” in accordance with 18 U.S.C. Section 1734 solely to indicate this fact.
REFERENCES
- 1.Farooqi IS, O'Rahilly S: Monogenic obesity in humans. Annu Rev Med 2005; 56: 443– 458 [DOI] [PubMed] [Google Scholar]
- 2.Vaisse C, Halaas JL, Horvath CM, Darnell JE, Jr, Stoffel M, Friedman JM: Leptin activation of Stat3 in the hypothalamus of wild-type and ob/ob mice but not db/db mice. Nat Genet 1996; 14: 95– 97 [DOI] [PubMed] [Google Scholar]
- 3.Niswender KD, Morrison CD, Clegg DJ, Olson R, Baskin DG, Myers MG, Jr, Seeley RJ, Schwartz MW: Insulin activation of phosphatidylinositol 3-kinase in the hypothalamic arcuate nucleus: a key mediator of insulin-induced anorexia. Diabetes 2003; 52: 227– 231 [DOI] [PubMed] [Google Scholar]
- 4.Xu AW, Kaelin CB, Takeda K, Akira S, Schwartz MW, Barsh GS: PI3K integrates the action of insulin and leptin on hypothalamic neurons. J Clin Invest 2005; 115: 951– 958 [DOI] [PMC free article] [PubMed] [Google Scholar]
- 5.Cota D, Proulx K, Smith KA, Kozma SC, Thomas G, Woods SC, Seeley RJ: Hypothalamic mTOR signaling regulates food intake. Science 2006; 312: 927– 930 [DOI] [PubMed] [Google Scholar]
- 6.Myers MG, Cowley MA, Münzberg H: Mechanisms of leptin action and leptin resistance. Annu Rev Physiol 2008; 70: 537– 556 [DOI] [PubMed] [Google Scholar]
- 7.El-Haschimi K, Pierroz DD, Hileman SM, Bjørbaek C, Flier JS: Two defects contribute to hypothalamic leptin resistance in mice with diet-induced obesity. J Clin Invest 2000; 105: 1827– 1832 [DOI] [PMC free article] [PubMed] [Google Scholar]
- 8.Münzberg H, Flier JS, Bjørbaek C: Region-specific leptin resistance within the hypothalamus of diet-induced obese mice. Endocrinology 2004; 145: 4880– 4889 [DOI] [PubMed] [Google Scholar]
- 9.Metlakunta AS, Sahu M, Sahu A: Hypothalamic phosphatidylinositol 3-kinase pathway of leptin signaling is impaired during the development of diet-induced obesity in FVB/N mice. Endocrinology 2008; 149: 1121– 1128 [DOI] [PMC free article] [PubMed] [Google Scholar]
- 10.Cota D, Matter EK, Woods SC, Seeley RJ: The role of hypothalamic mammalian target of rapamycin complex 1 signaling in diet-induced obesity. J Neurosci 2008; 28: 7202– 7208 [DOI] [PMC free article] [PubMed] [Google Scholar]
- 11.Bjorbak C, Lavery HJ, Bates SH, Olson RK, Davis SM, Flier JS, Myers MG, Jr: SOCS3 mediates feedback inhibition of the leptin receptor via Tyr985. J Biol Chem 2000; 275: 40649– 40657 [DOI] [PubMed] [Google Scholar]
- 12.Mori H, Hanada R, Hanada T, Aki D, Mashima R, Nishinakamura H, Torisu T, Chien KR, Yasukawa H, Yoshimura A: Socs3 deficiency in the brain elevates leptin sensitivity and confers resistance to diet-induced obesity. Nat Med 2004; 10: 739– 743 [DOI] [PubMed] [Google Scholar]
- 13.Kievit P, Howard JK, Badman MK, Balthasar N, Coppari R, Mori H, Lee CE, Elmquist JK, Yoshimura A, Flier JS: Enhanced leptin sensitivity and improved glucose homeostasis in mice lacking suppressor of cytokine signaling-3 in POMC-expressing cells. Cell Metab 2006; 4: 123– 132 [DOI] [PubMed] [Google Scholar]
- 14.Elchebly M, Payette P, Michaliszyn E, Cromlish W, Collins S, Loy AL, Normandin D, Cheng A, Himms-Hagen J, Chan CC, Ramachandran C, Gresser MJ, Tremblay ML, Kennedy BP: Increased insulin sensitivity and obesity resistance in mice lacking the protein tyrosine phosphatase-1B gene. Science 1999; 283: 1544– 1548 [DOI] [PubMed] [Google Scholar]
- 15.Klaman LD, Boss O, Peroni OD, Kim JK, Martino JL, Zabolotny JM, Moghal N, Lubkin M, Kim YB, Sharpe AH, Stricker-Krongrad A, Shulman GI, Neel BG, Kahn BB: Increased energy expenditure, decreased adiposity, and tissue-specific insulin sensitivity in protein-tyrosine phosphatase 1B-deficient mice. Mol Cell Biol 2000; 20: 5479– 5489 [DOI] [PMC free article] [PubMed] [Google Scholar]
- 16.Cheng A, Uetani N, Simoncic PD, Chaubey VP, Lee-Loy A, McGlade CJ, Kennedy BP, Tremblay ML: Attenuation of leptin action and regulation of obesity by protein tyrosine phosphatase 1B. Dev Cell 2002; 2: 497– 503 [DOI] [PubMed] [Google Scholar]
- 17.Zabolotny JM, Bence-Hanulec KK, Stricker-Krongrad A, Haj F, Wang Y, Minokoshi Y, Kim YB, Elmquist JK, Tartaglia LA, Kahn BB, Neel BG: PTP1B regulates leptin signal transduction in vivo. Dev Cell 2002; 2: 489– 495 [DOI] [PubMed] [Google Scholar]
- 18.Soriano P: Generalized lacZ expression with the ROSA26 Cre reporter strain. Nat Genet 1999; 21: 70– 71 [DOI] [PubMed] [Google Scholar]
- 19.Leshan RL, Bjornholm M, Munzberg H, Myers MG, Jr: Leptin receptor signaling and action in the central nervous system. Obesity (Silver Spring) 2006; 14( Suppl. 5): 208S– 212S [DOI] [PubMed] [Google Scholar]
- 20.Xu AW, Ste-Marie L, Kaelin CB, Barsh GS: Inactivation of signal transducer and activator of transcription 3 in proopiomelanocortin (Pomc) neurons causes decreased pomc expression, mild obesity, and defects in compensatory refeeding. Endocrinology 2007; 148: 72– 80 [DOI] [PubMed] [Google Scholar]
- 21.Xu AW, Kaelin CB, Morton GJ, Ogimoto K, Stanhope K, Graham J, Baskin DG, Havel P, Schwartz MW, Barsh GS: Effects of hypothalamic neurodegeneration on energy balance. PLoS Biol 2005; 3: e415. [DOI] [PMC free article] [PubMed] [Google Scholar]
- 22.Choudhury AI, Heffron H, Smith MA, Al-Qassab H, Xu AW, Selman C, Simmgen M, Clements M, Claret M, Maccoll G, Bedford DC, Hisadome K, Diakonov I, Moosajee V, Bell JD, Speakman JR, Batterham RL, Barsh GS, Ashford ML, Withers DJ: The role of insulin receptor substrate 2 in hypothalamic and beta cell function. J Clin Invest 2005; 115: 940– 950 [DOI] [PMC free article] [PubMed] [Google Scholar]
- 23.Davenport JR, Watts AJ, Roper VC, Croyle MJ, van Groen T, Wyss JM, Nagy TR, Kesterson RA, Yoder BK: Disruption of intraflagellar transport in adult mice leads to obesity and slow-onset cystic kidney disease. Curr Biol 2007; 17: 1586– 1594 [DOI] [PMC free article] [PubMed] [Google Scholar]
- 24.Claret M, Smith MA, Batterham RL, Selman C, Choudhury AI, Fryer LG, Clements M, Al-Qassab H, Heffron H, Xu AW, Speakman JR, Barsh GS, Viollet B, Vaulont S, Ashford ML, Carling D, Withers DJ: AMPK is essential for energy homeostasis regulation and glucose sensing by POMC and AgRP neurons. J Clin Invest 2007; 117: 2325– 2336 [DOI] [PMC free article] [PubMed] [Google Scholar]
- 25.Piper ML, Unger EK, Myers MG, Jr, Xu AW: Specific physiological roles for signal transducer and activator of transcription 3 in leptin receptor-expressing neurons. Mol Endocrinol 2008; 22: 751– 759 [DOI] [PMC free article] [PubMed] [Google Scholar]
- 26.Bjørbaek C, Elmquist JK, Frantz JD, Shoelson SE, Flier JS: Identification of SOCS-3 as a potential mediator of central leptin resistance. Mol Cell 1998; 1: 619– 625 [DOI] [PubMed] [Google Scholar]
- 27.Peralta S, Carrascosa JM, Gallardo N, Ros M, Arribas C: Ageing increases SOCS-3 expression in rat hypothalamus: effects of food restriction. Biochem Biophys Res Commun 2002; 296: 425– 428 [DOI] [PubMed] [Google Scholar]
- 28.Enriori PJ, Evans AE, Sinnayah P, Jobst EE, Tonelli-Lemos L, Billes SK, Glavas MM, Grayson BE, Perello M, Nillni EA, Grove KL, Cowley MA: Diet-induced obesity causes severe but reversible leptin resistance in arcuate melanocortin neurons. Cell Metab 2007; 5: 181– 194 [DOI] [PubMed] [Google Scholar]
- 29.Scott MM, Lachey JL, Sternson SM, Lee CE, Elias CF, Friedman JM, Elmquist JK: Leptin targets in the mouse brain. J Comp Neurol 2009; 514: 518– 532 [DOI] [PMC free article] [PubMed] [Google Scholar]
- 30.Balthasar N, Coppari R, McMinn J, Liu SM, Lee CE, Tang V, Kenny CD, McGovern RA, Chua SC, Jr, Elmquist JK, Lowell BB: Leptin receptor signaling in POMC neurons is required for normal body weight homeostasis. Neuron 2004; 42: 983– 991 [DOI] [PubMed] [Google Scholar]
- 31.Dhillon H, Zigman JM, Ye C, Lee CE, McGovern RA, Tang V, Kenny CD, Christiansen LM, White RD, Edelstein EA, Coppari R, Balthasar N, Cowley MA, Chua S, Jr, Elmquist JK, Lowell BB: Leptin directly activates SF1 neurons in the VMH, and this action by leptin is required for normal body-weight homeostasis. Neuron 2006; 49: 191– 203 [DOI] [PubMed] [Google Scholar]
- 32.Zhang R, Dhillon H, Yin H, Yoshimura A, Lowell BB, Maratos-Flier E, Flier JS: Selective inactivation of Socs3 in SF1 neurons improves glucose homeostasis without affecting body weight. Endocrinology 2008; 149: 5654– 5661 [DOI] [PMC free article] [PubMed] [Google Scholar]
- 33.De Souza CT, Araujo EP, Bordin S, Ashimine R, Zollner RL, Boschero AC, Saad MJ, Velloso LA: Consumption of a fat-rich diet activates a proinflammatory response and induces insulin resistance in the hypothalamus. Endocrinology 2005; 146: 4192– 4199 [DOI] [PubMed] [Google Scholar]
- 34.Ozcan L, Ergin AS, Lu A, Chung J, Sarkar S, Nie D, Myers MG, Jr, Ozcan U: Endoplasmic reticulum stress plays a central role in development of leptin resistance. Cell Metab 2009; 9: 35– 51 [DOI] [PubMed] [Google Scholar]
- 35.Zhang X, Zhang G, Zhang H, Karin M, Bai H, Cai D: Hypothalamic IKKbeta/NF-kappaB and ER stress link overnutrition to energy imbalance and obesity. Cell 2008; 135: 61– 73 [DOI] [PMC free article] [PubMed] [Google Scholar]
- 36.Hosoi T, Sasaki M, Miyahara T, Hashimoto C, Matsuo S, Yoshii M, Ozawa K: Endoplasmic reticulum stress induces leptin resistance. Mol Pharmacol 2008; 74: 1610– 1619 [DOI] [PubMed] [Google Scholar]
- 37.Håkansson-Ovesjö ML, Collin M, Meister B: Down-regulated STAT3 messenger ribonucleic acid and STAT3 protein in the hypothalamic arcuate nucleus of the obese leptin-deficient (ob/ob) mouse. Endocrinology 2000; 141: 3946– 3955 [DOI] [PubMed] [Google Scholar]
- 38.Zhou J, Wulfkuhle J, Zhang H, Gu P, Yang Y, Deng J, Margolick JB, Liotta LA, Petricoin E, 3rd, Zhang Y: Activation of the PTEN/mTOR/STAT3 pathway in breast cancer stem-like cells is required for viability and maintenance. Proc Natl Acad Sci U S A 2007; 104: 16158– 16163 [DOI] [PMC free article] [PubMed] [Google Scholar]
- 39.Villanueva EC, Münzberg H, Cota D, Leshan RL, Kopp K, Ishida-Takahashi R, Jones JC, Fingar DC, Seeley RJ, Myers MG, Jr: Complex regulation of mammalian target of rapamycin complex 1 in the basomedial hypothalamus by leptin and nutritional status. Endocrinology 2009; 150: 4541– 4551 [DOI] [PMC free article] [PubMed] [Google Scholar]
- 40.Faouzi M, Leshan R, Björnholm M, Hennessey T, Jones J, Münzberg H: Differential accessibility of circulating leptin to individual hypothalamic sites. Endocrinology 2007; 148: 5414– 5423 [DOI] [PubMed] [Google Scholar]
- 41.Cohen P, Zhao C, Cai X, Montez JM, Rohani SC, Feinstein P, Mombaerts P, Friedman JM: Selective deletion of leptin receptor in neurons leads to obesity. J Clin Invest 2001; 108: 1113– 1121 [DOI] [PMC free article] [PubMed] [Google Scholar]
- 42.Guo K, McMinn JE, Ludwig T, Yu YH, Yang G, Chen L, Loh D, Li C, Chua S, Jr, Zhang Y: Disruption of peripheral leptin signaling in mice results in hyperleptinemia without associated metabolic abnormalities. Endocrinology 2007; 148: 3987– 3997 [DOI] [PubMed] [Google Scholar]
- 43.Hill JW, Williams KW, Ye C, Luo J, Balthasar N, Coppari R, Cowley MA, Cantley LC, Lowell BB, Elmquist JK: Acute effects of leptin require PI3K signaling in hypothalamic proopiomelanocortin neurons in mice. J Clin Invest 2008; 118: 1796– 1805 [DOI] [PMC free article] [PubMed] [Google Scholar]
- 44.De Rosa V, Procaccini C, Calì G, Pirozzi G, Fontana S, Zappacosta S, La Cava A, Matarese G: A key role of leptin in the control of regulatory T cell proliferation. Immunity 2007; 26: 241– 255 [DOI] [PubMed] [Google Scholar]
Associated Data
This section collects any data citations, data availability statements, or supplementary materials included in this article.


