Abstract
OBJECTIVE
Obesity induces a program of systemic inflammation that is implicated in the development of many of its clinical sequelae. Hepatic inflammation is a feature of obesity-induced liver disease, and our previous studies demonstrated reduced hepatic steatosis in obese mice deficient in the C-C chemokine receptor 2 (CCR2) that regulates myeloid cell recruitment. This suggests that a myeloid cell population is recruited to the liver in obesity and contributes to nonalcoholic fatty liver disease.
RESEARCH DESIGN AND METHODS
We used fluorescence-activated cell sorting to measure hepatic leukocyte populations in genetic and diet forms of murine obesity. We characterized in vivo models that increase and decrease an obesity-regulated CCR2-expressing population of hepatic leukocytes. Finally, using an in vitro co-culture system, we measured the ability of these cells to modulate a hepatocyte program of lipid metabolism.
RESULTS
We demonstrate that obesity activates hepatocyte expression of C-C chemokine ligand 2 (CCL2/MCP-1) leading to hepatic recruitment of CCR2+ myeloid cells that promote hepatosteatosis. The quantity of these cells correlates with body mass and in obese mice represents the second largest immune cell population in the liver. Hepatic expression of CCL2 increases their recruitment and in the presence of dietary fat induces hepatosteatosis. These cells activate hepatic transcription of genes responsible for fatty acid esterification and steatosis.
CONCLUSIONS
Obesity induces hepatic recruitment of a myeloid cell population that promotes hepatocyte lipid storage. These findings demonstrate that recruitment of myeloid cells to metabolic tissues is a common feature of obesity, not limited to adipose tissue.
Obesity induces hepatic accumulation of triglycerides (TGs) and, in a large proportion of obese individuals, leads to the development of nonalcoholic fatty liver disease (1). Liver TG storage in the context of obesity is achieved through a complex program coordinated by transcriptional regulators, including SREBP1c (2), PPAR-γ, (3,4), Foxo1 (5), and XBP1 (6). Obesity also increases delivery of free fatty acids (FFAs) to the liver from adipose tissue, which are esterified and deposited as TG in cytoplasmic lipid droplets, and decreases TG export by promoting endoplasmic reticulum stress (7).
Another cardinal feature of obesity and nonalcoholic fatty liver disease is hepatic inflammation. Similar to its effects on adipose tissue, obesity induces hepatic inflammation, as reflected by increased production of proinflammatory cytokines and acute-phase reactants and by activation of NF-κB and JNK regulated pathways (8,9). In addition, myeloid-macrophage populations are key mediators of obesity-induced inflammation. Recent data suggest a role for local immune cells in the regulation of hepatic insulin sensitivity in response to obesity. Deletion of Ppard within hematopoietic cells polarizes the liver resident macrophages, Kupffer cells (KCs), toward an M1/classically activated state and reduces systemic insulin sensitivity in high-fat–fed mice (10,11). Despite the evidence of a close relationship between hepatosteatosis and inflammation, this inflammatory state remains poorly characterized.
In adipose tissue, inflammation is caused in part by the recruitment and activation of CCR2+ adipose tissue macrophages (12,13). CCR2-deficient mice have improved whole-body insulin sensitivity and glucose homeostasis. Consistently, mice overexpressing CCL2, the primary ligand of CCR2, in adipose tissue accumulate more adipose tissue macrophages (ATMs) and are insulin resistant (14,15). Interestingly, CCR2 deficiency protects mice from nonalcoholic fatty liver disease after high-fat feeding, implying that a CCR2-bearing cell is critical for development of hepatosteatosis. Studies in humans have shown that hepatic expression of CCL2 is increased in obesity and nonalcoholic fatty liver disease (16). These observations lead us to hypothesize that obesity induces recruitment of a CCR2+ myeloid cell population that promotes hepatic steatosis.
RESEARCH DESIGN AND METHODS
Mice.
C57BL/6J and B6.V-Lep/obJ mice were from The Jackson Laboratory (Bar Harbor, ME) and housed in ventilated cages in a pathogen-free barrier facility with a 12-h light/dark cycle. Mice had free access to autoclaved water and irradiated pellet food. Ccr2−/− mice were described previously (17). High-fat diet feeding, with ∼60% of calories from lipids (D12492; Research Diets), began at 6 weeks of age, unless otherwise noted. Mice on a low-fat diet (LFD) received the standard food (PicoLab Rodent 20; LabDiet). Mice were killed by CO2 asphyxiation, and tissues were stored at −80°C. All animal experiments were approved by the Columbia Institutional Animal Care and Use Committee.
Expression profiling.
Microarray experiments were performed as previously described (18). Samples from 45 22- to 24-week-old mice were included: four from each of the following groups: C57BL/6J males, high-fat–fed C57BL/6J males, calorie-restricted C57BL/6J males, calorie-restricted B6.Cg Ay/+ males, B6.Cg Ay/+ females, B6.V Lepob/ob females, and exercised male B6.Cg Ay/+, as well as five male B6.Cg Ay/+ males. Three from each of the following groups were included: C57BL/6J females, B6.V Lepob/ob females treated with pioglitazone, B6.Cg Ay/+ females treated with pioglitazone (Takeda NA), and B6.V Lepob/ob females treated with CL316243 (Sigma-Aldrich). Data and experimental details have been deposited in the GEO database (www.ncbi.nlm.nih.gov/geo).
Liver perfusion.
Perfusion was performed as described previously with slight modification (19). Mice were anesthetized, and the vena cava was catheterized using a 23-gauge catheter. The thoracic vena cava was then clamped, and the perfusion was initiated at 5 ml/min with buffers described by Resseguie et al. (20) supplemented with 30 mg Collagenase Type I (Worthington Biochemical) and two Complete Protease Inhibitor tablets (Roche). Livers were disassociated in fluorescence-activated cell sorting (FACS) buffer (500 ml PBS, 1 g BSA) and passed through a cell strainer.
Immunophenotyping.
Liver cells were cooled on ice and counted using a hemocytometer. They were centrifuged at 500g for 5 min at 4°C and resuspended in FACS buffer at a concentration of 7 × 10⁶ cells/ml. Cells were incubated in the dark for 30 min in FcBlock (BD Pharmingen) and then for an additional 45 min with fluorophore-conjugated antibodies or isotype controls. The antibodies used were as follows: CD11b-PE and APC, CD11c-PE and PE-TR, CD3e-PE and FITC, and NK1.1-APC (eBioscience), B220-PE-TR (Caltag Laboratories), CD45.1-PE and CD45.2-Percp-Cy5.5 (BD Pharmingen), and F4/80-APC (AbD Serotec). After incubation with primary antibodies, cells were washed twice, resuspended in FACS buffer containing 4′,6-diamidino-2-phenylindole dihydrochloride (DAPI), and analyzed on an LSRII flow cytometer (Becton Dickson) equipped with four excitation lines. Data analysis was performed using Flowjo software (Tree Star). All samples were gated on DAPI− cells before quantification. Cells were sorted into Dulbecco's modified Eagle's medium (DMEM) containing 20% fetal bovine serum on a BD FACS Aria Cell Sorter.
Tissue culture.
Hepatocytes were isolated from disassociated livers by three 50g centrifugations followed by centrifugation over Percoll density gradient for 10 min at 50g. Hepatocytes were plated on Collagen I (Sigma-Aldrich) coated 24-well plates and were washed after 2 h in DMEM 10% fetal bovine serum, 1% penicillin/streptomycin. After 2 more hours, cells were washed and media were replaced with Hepatozyme (Invitrogen), a proprietary formulation with a glucose concentration of 4.5 g/l, and co-cultured with recruited myeloid cells (RMCs) for 18 h. RMCs were FACS sorted from obese mice after 20–25 weeks of high-fat feeding and cultured in macrophage medium (DMEM containing 20% L-cell conditioned medium, 10% fetal bovine serum, 1% penicillin/streptomycin) on cell culture inserts for 24 h before hepatocyte co-culture.
Adenoviral preparation.
Recombinant adenovirus encoding human CCL2 or LacZ (Vector BioLabs) was amplified in HEK293 cells (ATCC) and purified with an Adeno-X Maxi Purification Kit (Clontech Laboratories). The 7-week-old male mice were injected with recombinant adenovirus intravenously at a dose of 1.1 × 10⁶ pfu/g in a total volume of 0.1 ml. Livers were fixed and analyzed by hematoxylin and eosin staining to evaluate hepatic histology. Serum alanine transaminase and aspartate transaminase activity were measured using commercial assays (Thermo Electron). Serum levels of human CCL2 were measured using a commercial enzyme-linked immunosorbent assay (ELISA) (R&D Systems).
Metabolic studies.
Fasting glucose and insulin measurements were taken after a 6-h fast. Glucose was measured with the FreeStyle blood glucose meter (Abbott Laboratories). Insulin was measured using Ultrasensitive Mouse Insulin ELISA (Alpco Diagnostics).
The insulin tolerance test was performed 3 weeks after infection. Mice were fasted for 6 h before intraperitoneal injection of human regular insulin (0.75 units/kg) (Humulin R; Eli Lilly). For biochemical analysis of insulin signaling, mice were injected with insulin (5 units/kg) through tail vein after a 6-h fast, and livers were removed after 3 min. Homogenized proteins were immunoblotted for total Akt and phospho-Akt (Cell Signaling Technology). For SREBP1c Western blotting, nuclear and cytoplasmic protein fractions were isolated from whole tissue (Active Motif) and immunoblotted using anti-SREBP1c antibody (SC13551; Santa Cruz Biotechnology, Santa Cruz, CA).
Measurement of hepatic TG.
TG content was quantified using a colorimetric assay kit (Thermo Fisher Scientific) as previously described (3). Livers were snap-frozen and stained with oil red O to visualize lipids.
Serum lipid determinations.
Serum TG concentrations were measured using a colorimetric assay kit (Thermo Fischer Scientific). Serum concentrations of total cholesterol and FFAs were quantified using colorimetric assay kits from Wako Chemicals.
Quantitative RT-PCR.
Trizol reagent (Invitrogen) was used to extract RNA from tissues. RNeasy mini-kits (Qiagen) were used to extract RNA from cells. First-strand cDNA was synthesized using Superscript III reverse transcriptase and random hexamer (Invitrogen). Quantitative PCR (Q-PCR) assays were carried out as described previously (12). Supplemental Table 4 depicts PCR primers used (all supplemental tables and figures can be found in an online appendix at http://diabetes.diabetesjournals.org/cgi/content/full/db09-1403/DC1). Data were normalized to Ppib using the ΔΔC(t) method and are presented as relative transcript levels.
Bone marrow transplantation.
Bone marrow transplantation was performed as previously described with slight modification (18). Three recipient mice received marrow from one donor mouse. Bone marrow was injected into 8-week-old lethally irradiated (two times 6 Gy, separated by 3–4 h) recipient mice. Mice had free access to water supplemented with 10 μg/ml enrofloxacin for 3 weeks. Donor mice expressed CD45.2, while recipients expressed the antigenically distinguishable CD45.1. Engraftment was >90% as assessed by the ratio of CD45.2+ to CD45.1+ circulating cells.
Statistical analysis.
Data are presented as mean ± SD. For all comparisons, P values were calculated using a Student's t test (two-tailed distribution, unequal variance). To assess associations, Pearson correlation coefficients were calculated.
RESULTS
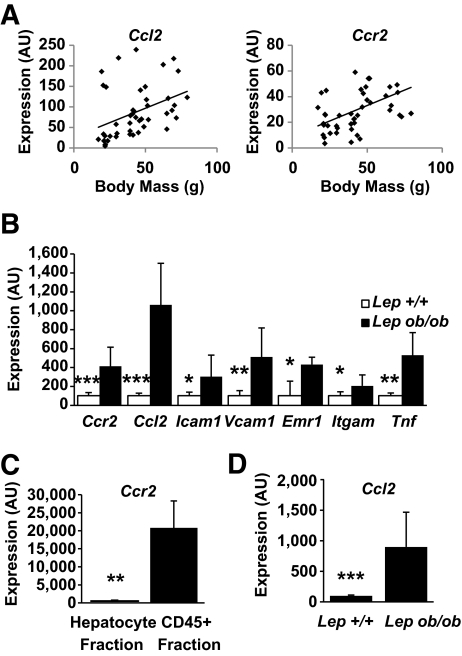
Chemokines direct the trafficking of immune cells to sites of inflammation. To determine whether obesity activates a chemokine-driven program in liver, we measured expression of chemokines and chemokine receptors in the livers of a cohort of mice with varying degrees of adiposity. We identified only one chemokine ligand and receptor pair whose expression was positively correlated with body mass in mice (supplemental Tables 1 and 2). Expression of the chemokine receptor Ccr2 (r = 0.46, P < 0.01) and Ccl2 (r = 0.40, P < 0.01) correlated positively with body mass (Fig. 1A). In addition, Ccr2 expression correlated with expression of known acute-phase response genes and inflammatory cytokines (supplemental Table 3), suggesting that Ccr2 is part of the larger obesity-induced inflammatory program in the liver.
FIG. 1.
Obesity induces a chemotactic program in the liver. A: Body mass correlates with hepatic expression of Ccl2 and Ccr2 among mice with varying body mass due to genetic mutations, sex, and diet (n = 45, P < 0.01 for Ccr2 and Ccl2). B: Obesity induces hepatic expression of genes involved in myeloid cell recruitment (n = 8–9). □, C57BL/6J Lep+/+; ■, Lepob/ob. C: Hepatic immune cells (CD45+) but not hepatocytes express Ccr2 (n = 4). D: Hepatocyte expression of Ccl2 is induced in obese leptin-deficient mice compared with lean mice (n = 4). *P < 0.05; **P < 0.01; ***P < 0.005. AU, arbitrary units.
The recruitment of macrophages to adipose tissue and other inflamed tissue is regulated by a subset of genes that includes chemokines, chemokine receptors, adhesion molecules, myeloid markers, and inflammatory cytokines. We looked for a similar expression profile in the livers of leptin-deficient obese mice. We confirmed the findings from our microarrays that hepatic Ccl2 and Ccr2 expression is increased in obese mice (Fig. 1B). In addition, these mice expressed greater amounts of adhesion molecules (Icam1, Vcam1) required for recruitment of immune cells to tissues, and markers expressed by macrophage and populations (Itgam, Emr1). Expression of the potent inflammatory cytokine Tnf was elevated as well. When hepatocytes and the immune cell (CD45+) fractions were isolated from livers of obese mice, Ccr2 expression was detected exclusively in the immune cell population (Fig. 1C). Furthermore, hepatocyte expression of Ccl2 was induced ninefold in hepatocytes isolated from obese compared with hepatocytes from lean mice (Fig. 1D).
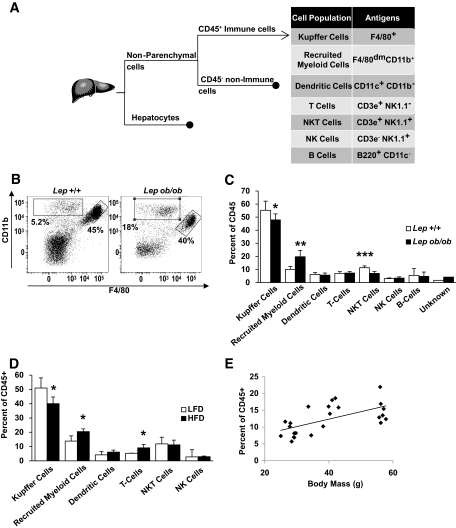
Despite these findings, we and others have previously shown that KCs are not increased by obesity (8,18). To determine whether obesity recruited non-KC immune cells to the liver, we cataloged immune cells using FACS (Fig. 2A) and accounted for >95% of hepatic immune cells. Among myeloid cells, KCs express the F4/80 (Emr1) macrophage antigen at high levels and were the largest immune cell population. However, we found another population of myeloid cells (CD11b+) that expressed F4/80 at low levels (Fig. 2B). Obesity modestly reduced the population of KCs (CD45+/F4/80+) but lead to a doubling in the distinct CD45+/CD11b+/F4/80dim cells from 10.0 to 19.7% (Fig. 2C) in C57BL/6J Lepob/ob. Only a small fraction of these expressed the granulocyte marker Ly6G (2–4% of cells). In addition, we confirmed a previous report (21) that leptin deficiency reduces the number of NKT cells (CD45+/CD3e+/NK1.1+). The increase in the CD45+/CD11b+/F4/80dim population did not represent a redistribution of immune cells but an increase in its absolute numbers in obese compared with lean mice (supplemental Fig. 1).
FIG. 2.
Obesity induces hepatic recruitment of a novel myeloid cell population. A: Strategy used to identify hepatic cell populations after collagenase digestion. B: Representative scatter plots depict relative cell surface expression of F4/80 (x-axis) and CD11b (y-axis) among hepatic CD45+ cells from lean (C57BL/6J Lep+/+) and obese (C57BL/6J Lepob/ob) mice. KCs were identified by high expression of the F4/80 (right gate), but a distinct population of CD11b+ F4/80dim cells (upper left gate) was also identified. Cataloging of hepatic immune cells reveals a decrease in the percent of KCs and an increase in CD11b+ F4/80dim in obese leptin-deficient (C57BL/6J Lepob/ob) (C) and HFD-fed obese (D) mice (n = 5–10) (□, lean; ■, obese). E: Liver RMC content is associated with body mass in a set of 23 male mice with varying degrees of adiposity resulting from dietary and genetic alterations (r = 0.611, P < 0.01). Data represent mean ± SD. *P < 0.05; **P < 0.01; ***P < 0.005.
To determine whether these changes were general features of obesity or specific to leptin deficiency, we cataloged immune cells from high-fat diet (HFD)-fed obese mice. As in the Lepob/ob model, HFD-fed C57BL/6J mice had reduced KC numbers and increased CD45+/CD11b+/F4/80dim cells compared with LFD-fed control mice (Fig. 2D); therefore, these changes are common features of obesity and not the consequence of a specific diet or genetic alteration. We refer to the CD45+/CD11b+/F4/80dim cells as “recruited myeloid cells” (RMCs), and consistent with our hypothesis, their number correlated with body mass (Fig. 2E).
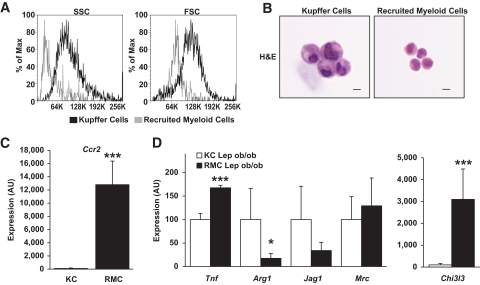
This population was morphologically and transcriptionally distinct from KCs. Forward and side light scatter profiles suggest that KCs are larger and more granular than RMCs (Fig. 3A). Likewise, isolated RMCs are smaller than resident KCs and contain less cytoplasm. Nonetheless, both cell types share the typical mononuclear myeloid morphology, with oval/kidney-shaped nuclei (Fig. 3B).
FIG. 3.
Hepatic RMCs are morphologically, functionally, and transcriptionally distinct from KCs. A: Representative histogram plot depicting the distribution of side (indicating relative granularity, left panel) and forward (indicating relative size, right panel) light scatter values obtained from FACS analysis of RMCs and KCs from lean (Lep+/+) and leptin-deficient obese (Lepob/ob) mice. B: KCs are larger than RMCs as seen in hematoxylin and eosin (H&E)-stained isolated cells (bar equals 10 microns). C: Relative expression of Ccr2 was more than 100× higher in RMCs than in KCs (KC expression is set at 100 arbitrary units [AU]) (n = 5–6). D: The relative expression of genes associated with classically (M1) or alternatively (M2) activated cells is not consistently associated with either RMCs or KCs isolated from livers of obese mice (Lepob/ob) mice (□, KC Lepob/ob; ■, RMC Lepob/ob) (n = 5–6). For C and D, data represent mean ± SD. *P < 0.05; ***P < 0.005. (A high-quality digital representation of this figure is available in the online issue.)
The transcriptional profile of RMCs was consistent with their being a monocytic-myeloid population recruited to the liver through CCR2. As expected based on our sorting criteria, KCs expressed high levels of Emr1 (F4/80), while RMCs expressed higher amounts of Itgam (CD11b) (supplemental Fig. 2). We hypothesized that the recruitment of RMCs is responsible for the increase in Ccr2 expression noted in livers of obese mice. Indeed, RMCs expressed Ccr2 at >100 times the level of KCs, indicating that this population is primarily responsible for hepatic Ccr2 expression (Fig. 3C).
Among monocytic lineages of myeloid cells, CCR2 expression is associated with the classically inflammatory (M1 polarized) phenotype. As expected, RMCs expressed greater amounts of Tnf than KCs (Fig. 3D). Conversely, the expression of the M2 markers Arg1 and Jag1 were higher in KCs. However, not all markers of M2 polarization were higher in KCs compared with RMCs. The expression of Chi3l3(Ym1), a heparin binding lectin that is induced by M2 polarization (22), was >30 times higher in RMCs than KCs (Fig. 3D). Although these data suggest that the activation/polarization state of KCs and RMCs cannot simply be described as M1 or M2, they do argue that activation phenotypes of KCs and RMCs are distinct.
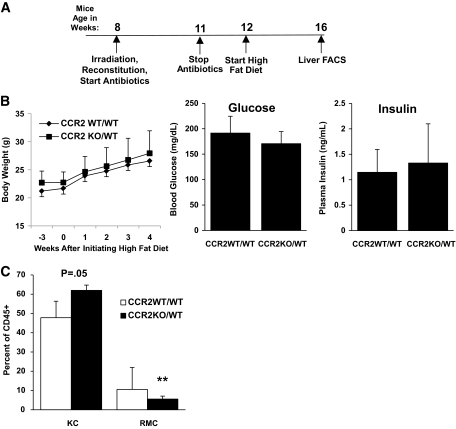
ATM accumulation in part depends on CCR2 (12). The elevated expression of CCL2 in obese liver, and the high level of expression of CCR2 in the RMCs, suggest that this chemokine ligand/receptor pair may be important for obesity-induced accumulation of RMCs. To test this possibility, bone marrow isolated from CCR2-deficient (C57BL/6J Ccr2−/−) or control (C57BL/6J Ccr2+/+) mice was adoptively transferred into irradiated C57BL6/J mice yielding CCR2-chimeric (CCR2KO/WT) and control (CCR2WT/WT) mice (schematic Fig. 4A). After recovery and short-term HFD feeding, there was no difference in body mass, fasting serum insulin, or blood glucose between CCR2KO/WT or CCR2WT/WT mice (Fig. 4B). However, CCR2WT/WT recipients accumulated twice the number of RMCs than weight-matched CCR2KO/WT mice (10.5 vs. 5.5%, respectively, Fig. 4C). As would be expected for a recruited and rapidly turning-over population of cells, the percentage of donor-derived RMCs in CCR2WT/WT and CCR2KO/WT recipients was 85% (± 6.3%) and 88% (± 7.7%), respectively, 8 weeks after bone marrow transplantation. In contrast, only 16% (± 22.4%) and 35.6% (± 20.6%) of KCs were donor-derived in CCR2WT/WT and CCR2KO/WT recipients, respectively. Bone marrow transplantation significantly reduces the susceptibility of mice to obesity (23). However, after becoming obese (body mass >40 g, ∼8 months), CCR2KO/WT accumulated less hepatic TG than weight-matched CCR2WT/WT mice (132 ± 54 vs. 204 ± 58 mg/g, respectively, P < 0.05; n = 5) (supplemental Fig. 4). Thus, obesity-induced accumulation of RMCs and hepatic steatosis both in part depend on hematopoietic CCR2.
FIG. 4.
Hepatic recruitment of RMCs is CCR2 chemokine receptor dependent. A: Timeline of experiments in which C57BL/6J CD45.1 mice were irradiated and reconstituted with bone marrow from either C57BL/6J Ccr2−/− (CCR2KO/WT) or wild-type CD45.2 siblings (CCR2WT/WT). B: Body mass, fasting blood glucose concentrations, and serum insulin concentrations of CCR2WT/WT and CCR2KO/WT after 4 weeks on an HFD were not different (P > 0.05). C: The size of the RMC population was reduced and KC population increased in mice that lacked hematopoietic Ccr2 (CCR2KO/WT) (□, CCR2WT/WT; ■, CCR2KO/WT). n = 7 for WT/WT and n = 5 for KO/WT. **P < 0.01.
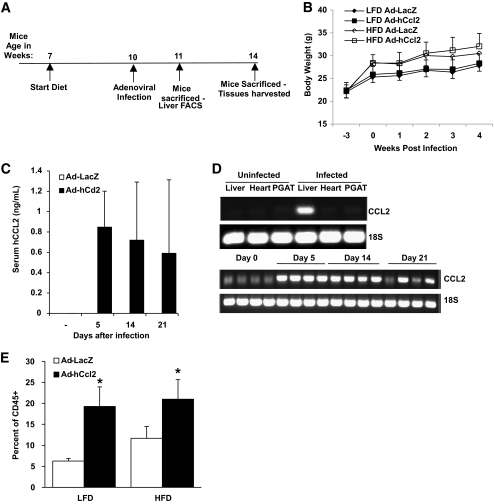
In mice, CCR2 has four known ligands (CCL2, CCL7, CCL8, and CCL12) that can induce chemotaxis in receptor-bearing cells (24); however, hepatic expression of only Ccl2 was elevated in obesity (supplemental Fig. 3). This suggests that liver-derived CCL2 is responsible for RMC recruitment in obesity. To test whether hepatic expression of CCL2 was sufficient to recruit RMCs to the liver, mice were injected with a recombinant adenovirus (Ad-hCcl2) designed to induce expression of human CCL2 (schematic, Fig. 5A). CCL2 binds and activates murine CCR2, albeit at a reduced affinity (25). Expression of human Ccl2 was detected in serum at 21 days and was expressed exclusively in the liver (Fig. 5C and D). One week after infection, RMCs were increased in livers of mice expressing human Ccl2 but not in the livers of control mice infected with a LacZ-containing adenovirus (Fig. 5E). As expected based on Fig. 2D, among Ad-LacZ–injected mice, those on an HFD accumulated more RMCs than those on an LFD (6.3 ± 0.6 vs. 11.7 ± 2.8%, P < 0.05). These data support the hypothesis that obesity-induced expression of CCL2/MCP1 is sufficient to increase recruitment of RMCs.
FIG. 5.
Hepatic recruitment of RMCs is enhanced by CCL2. A: Timeline of experiments in which human CCL2 (hCCL2) or LacZ was induced through use of adenoviral expression vectors. B: Growth chart of mice over the course of the study. C: Serum concentration of hCCL2 before injection and 5, 14, and 21 days after Ad-hCcl2 injection (results are mean of 6–8 animals ± SD). D: hCCL2 expression in liver, heart, and perigonadal adipose tissue (PGAT) of Ad-hCcl2–infected and control animals (top panel) 5, 14, and 21 days after Ad-hCcl2 injection. E: The RMC population of cells is increased in mice by hepatic expression of CCL2 (Ad-hCcl2) for 1 week in both LFD- and HFD-fed mice (□, Ad-LacZ; ■, Ad-hCcl2). Data represent mean ± SD. *P < 0.05.
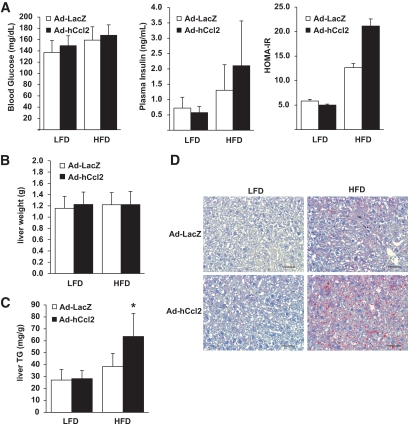
Genetic deficiency of Ccr2 in HFD-fed mice reduces hepatic steatosis (12). To test whether CCL2-dependent RMC recruitment was sufficient to replicate obesity-induced hepatic steatosis, we measured the effects of hepatic Ad-hCcl2 in mice. Body mass, insulin sensitivity, and serum lipids were not changed in mice overexpressing hepatic hCCL2 (Fig. 5B, Fig. 6A, and supplemental Fig. 6A and B). We found that in LFD-fed mice, increased hepatic RMC content did not affect hepatic TG concentration (Fig. 6C and D); thus, RMCs are not sufficient to induce steatosis. However, adenoviral-mediated expression of Ccl2 for 3 weeks in HFD-fed mice did increase hepatic TG content by 65% (P < 0.01; Fig. 6C and D) compared with HFD-fed controls. This occurred without evidence of liver hepatomegaly, steatohepatitis, or elevation of serum transaminase concentration (Fig. 6B and supplemental Fig. 5A and B). Thus, RMCs can induce the accumulation of hepatic TG, but only in the presence of excess dietary lipids.
FIG. 6.
RMCs regulate hepatic TG accumulation in the presence of excess lipid. Hepatic expression of hCCL2 and expansion of the RMC content did not alter insulin sensitivity (A) or liver mass (B) of mice on LFD or HFD (n = 4). C: Increased recruitment of RMCs did not increase hepatic TG in LFD-fed mice but did induce steatosis in mice with excess lipid intake (□, Ad-LacZ; ■, Ad-hCcl2). D: Hepatic expression of hCCL2 and recruitment of RMCs increased histologically visible hepatic steatosis and lipid droplets in HFD-fed mice (bar = 50 microns). *P < 0.05.
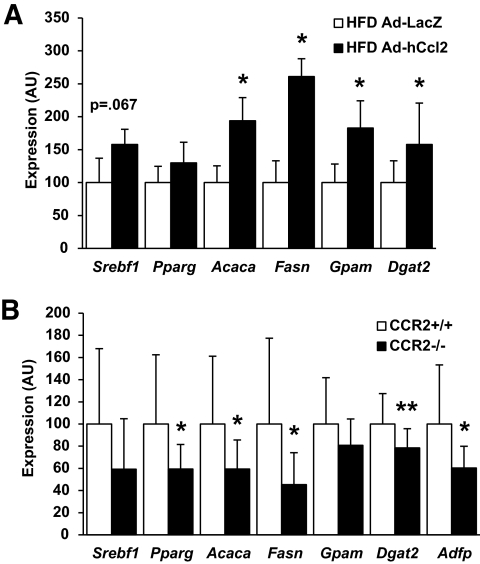
Hepatic expression of CCL2 in mice fed an HFD activated a lipogenic program that included upregulation of genes required for fatty acid synthesis and TG esterification (Fig. 7A, supplemental Fig. 7). We observed a trend for enhanced Srebf1 (SREBP1c) mRNA expression (P = 0.067) and nuclear localization (supplemental Fig. 8), consistent with changes seen in expression of its targets (Acaca, Fasn, and Gpam); however, expression of the lipogenic transcription factor Mlxipl (ChREBP) was not significantly elevated nor was its direct target Lpkr (L-PK) (P = 0.18 and P = 0.09, respectively). Expression of Dgat2, which catalyzes the final step in TG esterification, was increased in Ad-hCcl2 mice. Conversely, HFD-fed Ccr2−/− mice have diminished steatosis (12) and reduced expression of lipogenic and TG synthesis genes (Fig. 7B).
FIG. 7.
RMCs promote expression of lipogenic genes. A: Increased recruitment of RMCs through hepatic expression of hCCL2 increased lipogenic gene expression in HFD-fed mice (□, Ad-LacZ; ■, Ad-hCcl2). B: Deficiency of CCR2 in weight-matched mice fed an HFD for 9 weeks reduced lipogenic gene expression (□, CCR2+/+; ■, CCR2−/−) (n = 13). Data represent mean ± SD. *P < 0.05; **P < 0.01. AU, arbitrary units.
Obesity-induced steatosis is driven in part by hyperinsulinemia associated with hepatic insulin resistance (1); insulin's inhibition of gluconeogenesis is impaired, whereas insulin-regulated lipogenesis remains intact, resulting in increased TG production (2). These derangements in insulin signaling did not appear to contribute significantly to RMC-induced steatosis. Insulin tolerance tests in Ad-hCcl2 mice were not different from controls (supplemental Fig. 6A), and differences in homeostasis model assessment of insulin resistance (HOMA-IR) values did not reach significance (P = 0.2 HFD Ad-LacZ vs. Ad-hCcl2). Similarly, hepatic overexpression of hCCL2 did not impair hepatic insulin signaling in HFD-fed mice (supplemental Fig. 6C). These data suggest that RMC lead to increased lipogenic gene expression and TG deposition as a result of modulating SREBP1c-dependent and -independent transcriptional activity, likely in a manner not driven by alterations in insulin signaling. Dissociation of hepatic insulin resistance and steatosis is also seen when TG esterification genes are overexpressed in liver. Modest hepatic overexpression of Dgat2 or Gpam increases hepatic steatosis in mice without increasing fasting glucose or insulin (26,27). Conversely impaired hepatic lipid storage can lead to liver damage (28). Thus, TG formation can be adaptive and over the short term protect the liver from the adverse effects of increased FFAs. If RMCs facilitate TG esterification, then infusion of FFAs would be predicted to activate a program of RMC recruitment. Indeed, a 6-h infusion of oleate increased hepatic expression of Ccl2 (supplemental Fig. 9).
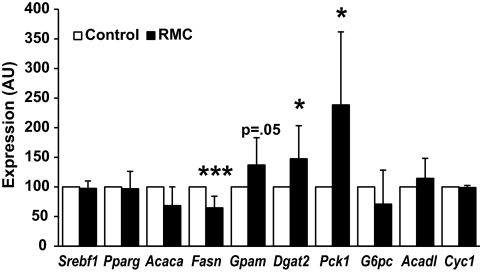
To test whether RMCs could activate a hepatocyte program of TG esterification, we co-cultured primary RMCs from HFD-fed obese mice with primary hepatocytes from lean mice for 18 h. The expression of both Dgat2 and Gpam was induced in hepatocytes co-cultured with RMCs (Fig. 8). In contrast, lipogenic and β-oxidation programs were unaffected by short-term co-culture with RMCs (Fig. 8). The esterification of fatty acid into TG requires glycerol-3-phosphate as a substrate, and recent evidence suggests that production of glycerol-3-phosphate from pyruvate (glyceroneogenesis) is the dominant source of liver TG glycerol (29). Co-cultured RMCs increase hepatocyte expression of Pck1 (PEPCK) without modulating the expression of G6pc (G6Pase). Whereas coordinately increasing Pck1and G6pc drives gluconeogenesis in hepatocytes, isolated upregulation of Pepck would drive pyruvate to glycerol rather than to glucose.
FIG. 8.
RMCs promote expression of lipogenic genes. RMCs from obese HFD-fed mice induce in hepatocytes from lean mice a program that would favor fatty acid esterification (□, control; ■, RMCs). Data represent mean ± SD. *P < 0.05; ***P < 0.005. AU, arbitrary units.
If the most proximal effect of RMCs on liver is to drive expression of genes involved in lipid storage, one would expect to find these differences in LFD-fed Ad-hCcl2–treated mice, despite there being no difference in TG per se. In fact, expression of Gpam and Dgat2 was elevated in standard diet–fed mice in which RMC numbers were increased by hepatic CCL2 expression, 2 weeks after adenoviral infection (supplemental Fig. 7).
DISCUSSION
The response of the immune system to foreign pathogens and injury is critical for restoring tissue function after an insult. However, recent studies suggest that the immune system has also evolved to respond to metabolic stresses and that immune cells have a role in maintaining metabolic homeostasis (30). Most of these studies have focused on populations of ATMs and their long-term maladaptive contributions to insulin resistance and impaired glucose homeostasis. Recent findings have implicated impairment of M2 polarization of KCs in the development of insulin resistance (11). Here we have identified a population of hepatic myeloid cells, distinct from KCs, that are recruited to the liver in proportion to body mass/adiposity in a CCR2/CCL2-dependent fashion.
We have provided three lines of evidence demonstrating a key role for these cells in the pathogenesis of obesity-induced steatosis. First, CCR2 deficiency impairs RMC accumulation and likewise reduces lipogenic gene expression and hepatic TG accumulation. It is difficult to assess the relative contributions of other CCR2-dependent populations, such as ATMs, to this phenotype. Other studies have directly implicated inflammatory signals from adipose tissue in modulating hepatic TG content and insulin sensitivity. Nevertheless, the proximity of RMCs to hepatocytes suggests that they contribute to the regulation of hepatic TG metabolism.
Second, hepatic CCL2 expression leads to recruitment of RMCs, induction of lipogenic genes, and, when accompanied by high-fat feeding, hepatic steatosis. However, when CCL2 is overexpressed in LFD-fed mice, RMCs are recruited (Fig. 5E) and expression levels of Gpam and Dgat2 are elevated (supplementary Fig. 7), but this is not associated with hepatic TG accumulation. These observations not only corroborate our primary hypothesis but imply that the mechanism through which RMCs induce steatosis is by elevating hepatic lipogenic gene expression. This alone is insufficient to drive lipid accumulation without the availability of excess circulating metabolic substrates (e.g., FFAs) to be channeled into this metabolic pathway; consequently, RMC recruitment is insufficient to induce steatosis in LFD-fed subjects.
Lastly, co-culture experiments suggest that a primary mechanism by which RMCs effect TG accumulation is by activating a transcriptional program that facilitates FFA esterification into TG. Over the short term, this effect may provide an adaptive mechanism to reduce local concentrations of the more biologically active FFAs and favor storage of more inert TG. However, in the setting of chronic lipid excess, this would compromise hepatocyte metabolic function. During the preparation of this work, an article appeared that provides parallel evidence for the changes in hepatic myeloid cell populations (31). The authors furthermore provide an alternative mechanism by which hepatic myeloid cells induce liver inflammation, namely by promoting NKT cell apoptosis, although it is unclear whether this would lead to metabolic dysfunction.
Accumulation of RMCs in part depends on the chemokine receptor CCR2. This suggests that this population derives from CCR2-expressing M1 polarized circulating monocytes. Likewise, RMCs express Tnf to a greater degree than KCs, an alternatively activated tissue resident macrophage population that is critical in maintaining hepatic insulin sensitivity in obese animals (11). However, expression of genes considered markers of M2-activated macrophages such as Chi3l3 and Mrc was inconsistent, with RMCs being categorized simply as M1 polarized. A likely conclusion based on this observation is that the activation state of the RMCs cannot be defined strictly as either M1 or M2 polarized. In the context of obesity, it is unknown what stimuli lead to macrophage activation, although it is certainly a complex process involving multiple metabolic signals (32) and possibly bacterial products (33). The complexity of this in vivo setting is unlikely to mirror completely the in vitro defined M1 and M2 states.
While RMCs are distinct from KCs, it is unclear whether they are ontologically related. If RMCs are indeed precursors to KCs, our data would imply that obesity accelerates the turnover of KCs, and RMCs are recruited at an accelerated rate to replenish the KC population. However, there appears to be a reciprocal relationship between the size of the RMC and KC populations: manipulations that increase RMCs, i.e., obesity or hepatic CCL2 expression, reduce the KC population. Therefore, if RMCs do serve as precursors to KCs or a subpopulation of KCs, the relationship would appear to be complex and our data would suggest that accelerated accumulation of RMCs can drive the efflux of KCs.
While we have demonstrated that RMCs contribute to the development of obesity-induced hepatic steatosis, hepatic TG storage is a feature of other diseases, including alcoholic fatty liver disease and lipodystrophy. If RMCs promote hepatocyte lipid storage more generally, RMCs may contribute to these disorders as well. We demonstrated that infusing oleate increases hepatic expression of CCL2/MCP1, and both obesity and lipodystrophy increase delivery of fatty acids to the liver, suggesting that RMCs may contribute to lipodystrophy-induced steatosis. In fact, a recent report found that CCR2 blockade reduces hepatic steatosis in lipodystrophic A-Zip mice (34).
RMCs also share characteristics with CCR2+ ATMs that are recruited to adipose tissue and the monocyte populations that are increased in response to obesity. Interestingly, as with ATMs, RMCs seem to increase with age (compare controls of Fig. 2C [12-week-old C57BL/6J, RMC = 10.3%] and Fig. 2D [21-week-old C57BL/6J, RMC = 13.8%, P = 0.06]), indicating that they may play a role in age-dependent metabolic alterations. Understanding the relationship of hepatic RMCs to other myeloid cell populations may provide insight into the mechanisms of obesity-induced inflammation in other tissues and thereby suggest novel therapeutic strategies for metabolic diseases.
Supplementary Material
ACKNOWLEDGMENTS
This work was supported by grants from the National Institutes of Health (DK066525 and DK063608).
No potential conflicts of interest relevant to this article were reported.
We thank I. Charo for providing CCR2-deficient mice and Vidya Subramanian and Rudy Leibel for comments and suggestions.
Footnotes
The costs of publication of this article were defrayed in part by the payment of page charges. This article must therefore be hereby marked “advertisement” in accordance with 18 U.S.C. Section 1734 solely to indicate this fact.
REFERENCES
- 1.Postic C, Girard J: The role of the lipogenic pathway in the development of hepatic steatosis. Diabete Metab 2008; 34: 643– 648 [DOI] [PubMed] [Google Scholar]
- 2.Shimomura I, Bashmakov Y, Horton JD: Increased levels of nuclear SREBP-1c associated with fatty livers in two mouse models of diabetes mellitus. J Biol Chem 1999; 274: 30028– 30032 [DOI] [PubMed] [Google Scholar]
- 3.Matsusue K, Haluzik M, Lambert G, Yim SH, Gavrilova O, Ward JM, Brewer B, Jr, Reitman ML, Gonzalez FJ: Liver-specific disruption of PPARgamma in leptin-deficient mice improves fatty liver but aggravates diabetic phenotypes. J Clin Invest 2003; 111: 737– 747 [DOI] [PMC free article] [PubMed] [Google Scholar]
- 4.Zhang YL, Hernandez-Ono A, Siri P, Weisberg S, Conlon D, Graham MJ, Crooke RM, Huang LS, Ginsberg HN: Aberrant hepatic expression of PPARgamma2 stimulates hepatic lipogenesis in a mouse model of obesity, insulin resistance, dyslipidemia, and hepatic steatosis. J Biol Chem 2006; 281: 37603– 37615 [DOI] [PubMed] [Google Scholar]
- 5.Matsumoto M, Han S, Kitamura T, Accili D: Dual role of transcription factor FoxO1 in controlling hepatic insulin sensitivity and lipid metabolism. J Clin Invest 2006; 116: 2464– 2472 [DOI] [PMC free article] [PubMed] [Google Scholar]
- 6.Lee AH, Scapa EF, Cohen DE, Glimcher LH: Regulation of hepatic lipogenesis by the transcription factor XBP1. Science 2008; 320: 1492– 1496 [DOI] [PMC free article] [PubMed] [Google Scholar]
- 7.Ota T, Gayet C, Ginsberg HN: Inhibition of apolipoprotein B100 secretion by lipid-induced hepatic endoplasmic reticulum stress in rodents. J Clin Invest 2008; 118: 316– 332 [DOI] [PMC free article] [PubMed] [Google Scholar]
- 8.Cai D, Yuan M, Frantz DF, Melendez PA, Hansen L, Lee J, Shoelson SE: Local and systemic insulin resistance resulting from hepatic activation of IKK-beta and NF-kappaB. Nat Med 2005; 11: 183– 190 [DOI] [PMC free article] [PubMed] [Google Scholar]
- 9.Tuncman G, Hirosumi J, Solinas G, Chang L, Karin M, Hotamisligil GS: Functional in vivo interactions between JNK1 and JNK2 isoforms in obesity and insulin resistance. Proc Natl Acad Sci U S A 2006; 103: 10741– 10746 [DOI] [PMC free article] [PubMed] [Google Scholar]
- 10.Kang K, Reilly SM, Karabacak V, Gangl MR, Fitzgerald K, Hatano B, Lee CH: Adipocyte-derived Th2 cytokines and myeloid PPARdelta regulate macrophage polarization and insulin sensitivity. Cell Metab 2008; 7: 485– 495 [DOI] [PMC free article] [PubMed] [Google Scholar]
- 11.Odegaard JI, Ricardo-Gonzalez RR, Red Eagle A, Vats D, Morel CR, Goforth MH, Subramanian V, Mukundan L, Ferrante AW, Chawla A: Alternative M2 activation of Kupffer cells by PPARdelta ameliorates obesity-induced insulin resistance. Cell Metab 2008; 7: 496– 507 [DOI] [PMC free article] [PubMed] [Google Scholar]
- 12.Weisberg SP, Hunter D, Huber R, Lemieux J, Slaymaker S, Vaddi K, Charo I, Leibel RL, Ferrante AW, Jr: CCR2 modulates inflammatory and metabolic effects of high-fat feeding. J Clin Invest 2006; 116: 115– 124 [DOI] [PMC free article] [PubMed] [Google Scholar]
- 13.Lumeng CN, Bodzin JL, Saltiel AR: Obesity induces a phenotypic switch in adipose tissue macrophage polarization. J Clin Invest 2007; 117: 175– 184 [DOI] [PMC free article] [PubMed] [Google Scholar]
- 14.Kanda H, Tateya S, Tamori Y, Kotani K, Hiasa K, Kitazawa R, Kitazawa S, Miyachi H, Maeda S, Egashira K, Kasuga M: MCP-1 contributes to macrophage infiltration into adipose tissue, insulin resistance, and hepatic steatosis in obesity. J Clin Invest 2006; 116: 1494– 1505 [DOI] [PMC free article] [PubMed] [Google Scholar]
- 15.Kamei N, Tobe K, Suzuki R, Ohsugi M, Watanabe T, Kubota N, Ohtsuka-Kowatari N, Kumagai K, Sakamoto K, Kobayashi M, Yamauchi T, Ueki K, Oishi Y, Nishimura S, Manabe I, Hashimoto H, Ohnishi Y, Ogata H, Tokuyama K, Tsunoda M, Ide T, Murakami K, Nagai R, Kadowaki T: Overexpression of monocyte chemoattractant protein-1 in adipose tissues causes macrophage recruitment and insulin resistance. J Biol Chem 2006; 281: 26602– 26614 [DOI] [PubMed] [Google Scholar]
- 16.Westerbacka J, Kolak M, Kiviluoto T, Arkkila P, Sirén J, Hamsten A, Fisher RM, Yki-Järvinen H: Genes involved in fatty acid partitioning and binding, lipolysis, monocyte/macrophage recruitment, and inflammation are overexpressed in the human fatty liver of insulin-resistant subjects. Diabetes 2007; 56: 2759– 2765 [DOI] [PubMed] [Google Scholar]
- 17.Boring L, Gosling J, Cleary M, Charo IF: Decreased lesion formation in CCR2−/− mice reveals a role for chemokines in the initiation of atherosclerosis. Nature 1998; 394: 894– 897 [DOI] [PubMed] [Google Scholar]
- 18.Weisberg SP, McCann D, Desai M, Rosenbaum M, Leibel RL, Ferrante AW, Jr: Obesity is associated with macrophage accumulation in adipose tissue. J Clin Invest 2003; 112: 1796– 1808 [DOI] [PMC free article] [PubMed] [Google Scholar]
- 19.Herman B, Nieminen AL, Gores GJ, Lemasters JJ: Irreversible injury in anoxic hepatocytes precipitated by an abrupt increase in plasma membrane permeability. FASEB J 1988; 2: 146– 151 [DOI] [PubMed] [Google Scholar]
- 20.Resseguie M, Song J, Niculescu MD, da Costa KA, Randall TA, Zeisel SH: Phosphatidylethanolamine N-methyltransferase (PEMT) gene expression is induced by estrogen in human and mouse primary hepatocytes. FASEB J 2007; 21: 2622– 2632 [DOI] [PMC free article] [PubMed] [Google Scholar]
- 21.Guebre-Xabier M, Yang S, Lin HZ, Schwenk R, Krzych U, Diehl AM: Altered hepatic lymphocyte subpopulations in obesity-related murine fatty livers: potential mechanism for sensitization to liver damage. Hepatology 2000; 31: 633– 640 [DOI] [PubMed] [Google Scholar]
- 22.Raes G, Noël W, Beschin A, Brys L, de Baetselier P, Hassanzadeh GH: FIZZ1 and Ym as tools to discriminate between differentially activated macrophages. Dev Immunol 2002; 9: 151– 159 [DOI] [PMC free article] [PubMed] [Google Scholar]
- 23.Ablamunits V, Weisberg SP, Lemieux JE, Combs TP, Klebanov S: Reduced adiposity in ob/ob mice following total body irradiation and bone marrow transplantation. Obesity (Silver Spring) 2007; 15: 1419– 1429 [DOI] [PubMed] [Google Scholar]
- 24.Proudfoot AE: Chemokine receptors: multifaceted therapeutic targets. Nat Rev Immunol 2002; 2: 106– 115 [DOI] [PMC free article] [PubMed] [Google Scholar]
- 25.Boring L, Gosling J, Monteclaro FS, Lusis AJ, Tsou CL, Charo IF: Molecular cloning and functional expression of murine JE (monocyte chemoattractant protein 1) and murine macrophage inflammatory protein 1alpha receptors: evidence for two closely linked C-C chemokine receptors on chromosome 9. J Biol Chem 1996; 271: 7551– 7558 [DOI] [PubMed] [Google Scholar]
- 26.Monetti M, Levin MC, Watt MJ, Sajan MP, Marmor S, Hubbard BK, Stevens RD, Bain JR, Newgard CB, Farese RV, Sr, Hevener AL, Farese RV, Jr: Dissociation of hepatic steatosis and insulin resistance in mice overexpressing DGAT in the liver. Cell Metab 2007; 6: 69– 78 [DOI] [PubMed] [Google Scholar]
- 27.Lindén D, William-Olsson L, Ahnmark A, Ekroos K, Hallberg C, Sjögren HP, Becker B, Svensson L, Clapham JC, Oscarsson J, Schreyer S: Liver-directed overexpression of mitochondrial glycerol-3-phosphate acyltransferase results in hepatic steatosis, increased triacylglycerol secretion and reduced fatty acid oxidation. FASEB J 2006; 20: 434– 443 [DOI] [PubMed] [Google Scholar]
- 28.Listenberger LL, Han X, Lewis SE, Cases S, Farese RV, Jr, Ory DS, Schaffer JE: Triglyceride accumulation protects against fatty acid-induced lipotoxicity. Proc Natl Acad Sci U S A 2003; 100: 3077– 3082 [DOI] [PMC free article] [PubMed] [Google Scholar]
- 29.Nye CK, Hanson RW, Kalhan SC: Glyceroneogenesis is the dominant pathway for triglyceride glycerol synthesis in vivo in the rat. J Biol Chem 2008; 283: 27565– 27574 [DOI] [PMC free article] [PubMed] [Google Scholar]
- 30.Ferrante AW, Jr: Obesity-induced inflammation: a metabolic dialogue in the language of inflammation. J Intern Med 2007; 262: 408– 414 [DOI] [PubMed] [Google Scholar]
- 31.Deng ZB, Liu Y, Liu C, Xiang X, Wang J, Cheng Z, Shah SV, Zhang S, Zhang L, Zhuang X, Michalek S, Grizzle WE, Zhang HG: Immature myeloid cells induced by a high-fat diet contribute to liver inflammation. Hepatology 2009; 50: 1412– 1420 [DOI] [PMC free article] [PubMed] [Google Scholar]
- 32.Kim F, Pham M, Luttrell I, Bannerman DD, Tupper J, Thaler J, Hawn TR, Raines EW, Schwartz MW: Toll-like receptor-4 mediates vascular inflammation and insulin resistance in diet-induced obesity. Circ Res 2007; 100: 1589– 1596 [DOI] [PubMed] [Google Scholar]
- 33.Cani PD, Amar J, Iglesias MA, Poggi M, Knauf C, Bastelica D, Neyrinck AM, Fava F, Tuohy KM, Chabo C, Waget A, Delmée E, Cousin B, Sulpice T, Chamontin B, Ferrières J, Tanti JF, Gibson GR, Casteilla L, Delzenne NM, Alessi MC, Burcelin R: Metabolic endotoxemia initiates obesity and insulin resistance. Diabetes 2007; 56: 1761– 1772 [DOI] [PubMed] [Google Scholar]
- 34.Yang SJ, IglayReger HB, Kadouh HC, Bodary PF: Inhibition of the chemokine (C-C motif) ligand 2/chemokine (C-C motif) receptor 2 pathway attenuates hyperglycaemia and inflammation in a mouse model of hepatic steatosis and lipoatrophy. Diabetologia 2009; 52: 972– 981 [DOI] [PubMed] [Google Scholar]
Associated Data
This section collects any data citations, data availability statements, or supplementary materials included in this article.


