Abstract
Objective
Measuring the structure, composition or suitability for bonding of the acid etched dentin substrate, especially in its hydrated state, has been a formidable problem. The purpose of this study was to determine the morphological and structural profiles of the dentin demineralized layer measured in its natural wet state using environmental scanning electron microscopy (ESEM) and micro-Raman imaging.
Materials and methods
The occlusal 1/3 of the crown was removed from 9 extracted, unerupted human third molars. Dentin surfaces were abraded with 600 grit SiC sandpaper under water to create smear layers. The prepared dentin surfaces were randomly selected for treatment with the self-etching agent (Adper™ Prompt L-Pop) or the total etching agent 35% H3PO4 gel (with/without agitation). Micro-Raman spectra and imaging were acquired at 1-1.5 μm spatial resolution at positions perpendicular to the treated surfaces; since this technique is non-destructive, the same specimens were also imaged with ESEM. Specimens were kept wet throughout spectral acquisition and ESEM observations.
Results
ESEM could be used to reveal demineralized layers in acid-etched dentin, but the resolution was low and no collagen fibrils were disclosed. The detailed chemical maps/profiles of demineralized dentin layers under wet conditions could be obtained using Raman imaging. It was shown that the mineral existed in the superficial layer of all etched dentin covered with smear layers. The mineral was much easier to be removed underneath the superficial layer. The depth, degree, and profile of dentin demineralization were dependent on the types of acids (self-etching vs. total etching) and application procedures (with vs. without agitation).
Significance
Most current adhesives are applied using wet bonding techniques in which the dentin is kept fully hydrated throughout the bonding. Our ability to fully characterize the hydrated, etched dentin substrates is very important for understanding bonding under in vivo conditions.
Keywords: Dentin, acid etching, demineralization, Raman, Environmental SEM
1. Introduction
Dentin is a complex, hydrated, dynamic bonding substrate [1, 2]. It has been speculated that regional differences in density and orientation of dentin tubules, mineral/collagen matrix content, presence of various forms of dentin, dentin permeability, varying smear layer thickness, and differences in dentin hydration state as a function of intratooth location would result in complex, nonuniform acid etching of dentin [3]. The complexity and nonuniformity of this demineralized dentin layer will directly affect subsequent penetration/infiltration of bonding agents and, ultimately, adhesive bond formation with the dentin substrate [4, 5].
Measuring the structure, composition, or suitability for bonding of this complex, etched dentin substrate, especially in its natural, hydrated state, has been a formidable problem and to date the most popular techniques for studying the etched dentin layer have relied on morphologic characterization of this layer after fixation by scanning electron microscopy (SEM) [6, 7]. The major drawback of this technique is that information regarding the depth of demineralization and morphology could have been changed during the specimen preparation procedure which involves fixation, dehydration, drying, and vacuum. Using atomic force microscopy (AFM), Marshall et. al. [8-11] studied the initial stages of dentin demineralization using dilute acidic solutions. Since AFM allows the examination of specimens in solution at high resolution, these studies provided new insight into the dynamics of dentin demineralization. They found that the peritubular dentin etched linearly over time for all agents studied, while intertubular matrix quickly reached a plateau in the hydrated state. This was the first time that investigators were able to directly observe the changes in the surface characteristics of wet dentin specimens during demineralization [11, 12]. The AFM has also been used to measure the depth changes of the demineralized layer resulting from dehydration and rehydration by comparing to a reference [8-11, 13] under wet conditions. However, the disadvantage associated with this technique is that it does not allow longitudinal evaluation of the demineralized layer. Little is known about the exact depth and chemical profile of the demineralized layer under its natural wet state.
Environmental SEM (ESEM) and Raman microscopy can potentially be used to obtain a longitudinal view of the demineralized dentin layer in its wet condition. In contrast to the abovementioned traditional SEM, there is no need for specimen preparation/metallization for ESEM [14, 15]. With this technique, the morphology/profile of the dentin demineralized layer can be observed under wet conditions, while taking advantages of SEM technique such as good depth of field and high magnification. In addition, the chemical profile of this layer can be obtained using Raman microscopy. In contrast to other microscopic techniques, Raman microscopy can be used to detect and quantify the molecular chemistry of microscopic specimens. By combining spectroscopy with microscopy, molecular information can be obtained with great spatial resolution at the microscopic level. Specimens can be analyzed directly in water at room temperature and pressure without destroying the sample when using a water immersion lens. The capability of performing spatially resolved chemical analyses of microscopic regions of specimens in situ has been applied to materials science and biological sciences. Raman micro-spectroscopy is an exceptional tool for investigating the chemistry of the interfaces or surface profiles because it does not rely on homogenization, but rather each structure is analyzed in situ.
Many of the current approaches to dentin bonding rely on acidic etching. A wide variety of conditioning agents such as self-etching or total etching are utilized with various bonding systems. They may induce different morphological effects and demineralization depths. However, many details of this important process are poorly understood. Little is known about the profile such as the mineral content changes as a function of depth. In this study, both ESEM and Raman microscopy were used in a longitudinal view aimed at studying the effects of different acid etching on the demineralization of dentin measured in its natural wet state. The null hypothesis tested was that there would be no differences in the morphological, chemical, and structural profiles of the dentin demineralized layer between the self-etching and total etching.
2. Materials and methods
2.1 Specimen preparation
Nine extracted, noncarious, unerupted human third molars stored at 4°C in 0.96% w/v phosphate buffered saline (PBS) containing 0.002% sodium azide were used in this study. The teeth were collected after the patient's informed consent was obtained under a protocol approved by the Adult Health Sciences Institutional Review Board of the University of Missouri - Kansas City. We prepared the dentin discs by first cutting the roots at the cementum–enamel junction with a water-cooled, low-speed diamond saw (Buehler, Lake Bluff, IL) and then removing the occlusal one-third of the crown with a second, parallel section. Dentin discs without any enamel remnants or exposure of the pulp chamber were prepared. We produced standardized smear layers by wet-sanding the dentin surface for 30 s with 600-grit silicon carbide sandpaper. These specimens were sectioned perpendicular and parallel to the smeared surface with a water-cooled, low-speed diamond saw. These slabs were 10 mm long, 2 mm wide, 2 mm thick. The individual rectangular slabs were randomly selected for treatment with the self-etching agent Adper™ Prompt L-Pop (in a triple lollipop-shaped aluminum foil package, 3M ESPE, St Paul, MN) or total-etching agent Scotchbond 35% H3PO4 gel (3M ESPE, St Paul, MN). The treated specimens were rinsed thoroughly with water, immediately submersed in liquid nitrogen, and cryo-fractured perpendicular to the treated dentin surface. These fractured slabs were kept in water and analyzed immediately by micro-Raman and Environmental SEM.
2.2 Evaluation of hydrated demineralized dentin substrate using ESEM
The wet fractured slabs were examined in the field emission environmental SEM (Philips XL 30, Philips, Eindhoven, Netherlands) in such a way that the effect of the treatments could be viewed occlusally as well as perpendicular to the treated surface. The environmental chamber was maintained at 95% humidity and the specimens were imaged at 10 kV with a gaseous secondary electron detector.
2.3 Evaluation of dentin demineralized layer under wet conditions using micro-Raman
The experimental apparatus used to collect the Raman spectra was a Jasco NRS 2000 Raman spectrometer equipped with Olympus lenses and a liquid nitrogen-cooled CCD detector. The optical microscope allowed for visual identification of the position at which the Raman spectrum was obtained. The excitation source was an Argon laser operating at 514.5 nm. Instrument fluctuation was evaluated by comparing spectra from standards such as silicon and each spectrum was frequency calibrated and corrected for chromatic variations in spectrometer system detection.
Etched dentin slabs recovered from the same tooth and adjacent to those slabs prepared for ESEM analysis were placed directly in petri dishes and covered with water. The specimen were placed at the focus of a 60 × water immersion lens and spectra were acquired at positions corresponding to 1 μm intervals across the interface of the acid-etched smear layer, demineralized dentin layer, and mineralized dentin by use of the computer-controlled x-y-z stage with a minimum step width of 50 nm. Spectra were obtained at a resolution of ∼6 cm-1 over the spectral region of 800-1800 cm-1, which spans the fingerprint region associated with collagen and mineral. The spectral features in smear/demineralized layer of dentin substrates following etching will be compared and analyzed. The relative mineral content, or the degree of demineralization as a function of spatial position, was determined from the ratios of the relative integrated intensities of spectral features associated with mineral (961 cm−1, P-O symmetric stretch) and collagen (1454 cm-1, CH2 deformation). Based on the calculated mineral content at different positions, the depth of demineralized and/or partially demineralized layer were determined.
3. Results
Figure 1A illustrates a side view of wet dentin, which had been etched with self-etching agent Adper™ Prompt L-Pop (APLP). The prepared dentin specimens were etched according to manufacturer's instructions. More specifically, the dentin surface was rubbed with moderate finger pressure for 15 s, air dried for 10 s, applied a second coat, rinsed with water, then fractured in liquid nitrogen. As shown in Fig. 1A, a layer of demineralized dentin above the unaffected, mineralized substrate was visible. This layer has a smooth, gel-like appearance in the wet mode ESEM. The width of this layer was ∼2 μm. Figures 1B and 1C depict representative lateral views of wet dentin, which had been etched with the total-etching agent phosphoric acid gel. The etching gel was spread on the dentin surfaces and was either left to stand undisturbed (Fig. 1B, without agitation, following the manufacturer's instructions) or agitated during the application (Fig. 1C). Both were etched for 15 s, then rinsed with water. Without agitation, the width of the layer was ∼2.0 μm. The width was increased to ∼5 μm with agitation. The detailed structure such as demineralized collagen fibrils within all these layers was not observed (Fig. 1).
Fig. 1.
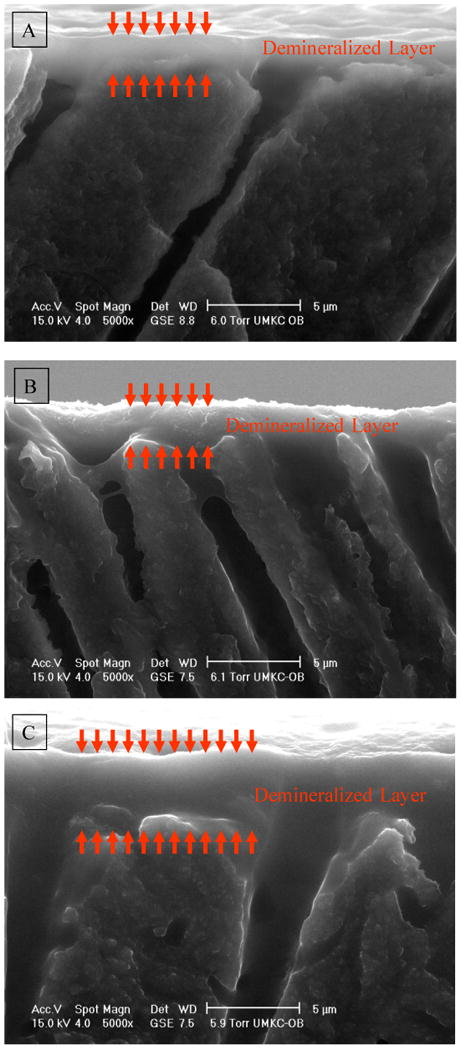
Representative micrographs of wet demineralized dentin layer collected using environmental scanning electron microscopy (ESEM). (A) Self etching agent Adper™ Prompt L-Pop (APLP), the dentin surface was rubbed with finger pressure for 15 s, air dried for 10 s, applied a second coat, rinsed with water; (B) Total-etching agent 35% phosphoric acid gel, the etching gel was spread on the dentin surface and left to stand undisturbed (without agitation, the manufacturer's instruction) for 15 s, rinsed with water; (C) Total-etching agent 35% phosphoric acid gel, the etching gel was spread on the dentin surface and agitated during the application for 15 s, then rinsed with water.
Etched dentin slabs recovered from the same tooth and adjacent to those slabs prepared for ESEM analysis were covered with water and were placed at the focus of a 60 × water immersion lens (Fig. 2). Raman imaging was collected across the demineralized layer of etched dentin. Figure 2C presents the total peak area image of a demineralized dentin layer collected from 20 μm × 16 μm area. While there is no chemical information in the full peak area image, it is a spatial representation of the energy impinging on the detectors. It is noted, however, that some features are observed, indicating weaker peak intensities (less energy impinging the detectors) in the left side (demineralized region) of the image. Since each pixel in a Raman image contains a spectrum, chemical images can be generated based on different strategies. For example, the maximum Raman peak shift associated with vibration of PO43- in mineral is at 961 (Fig. 3A). The images generated based on peak shift range (952-962 cm−1) can be used to identify the presence of mineral in the demineralized layer (Figs. 3B-D). The existence of mineral was observed in the regions across the demineralized/mineralized dentin within both APLP etched and H3PO4 gel etched (without agitation) dentin (Figs. 3B, 3C). The mineral disappeared in the middle region of the demineralized layer within the specimens etched H3PO4 gel with agitation (Fig. 3D).
Fig. 2.
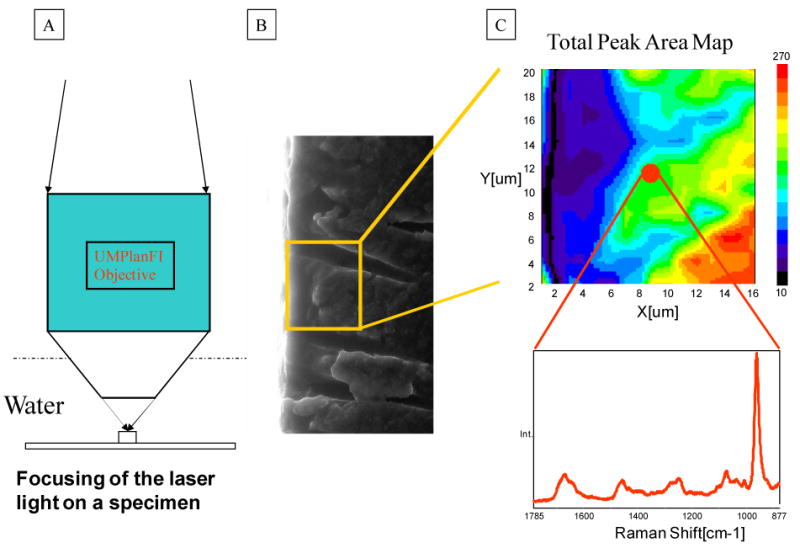
A schematic of the approach to Raman imaging collection of the demineralized dentin layer. (A) Etched dentin slabs recovered from the same tooth and adjacent to those slabs prepared for ESEM analysis were covered with water and placed at the focus of a 60 × water immersion lens; (B) Spectra were acquired at positions corresponding to 1 μm intervals across the interface of the acid-etched smear layer, demineralized dentin layer, and dentin); (C) representative total-peak-area image of a demineralized dentin layer collected from 20 μm × 16 μm area.
Fig. 3.
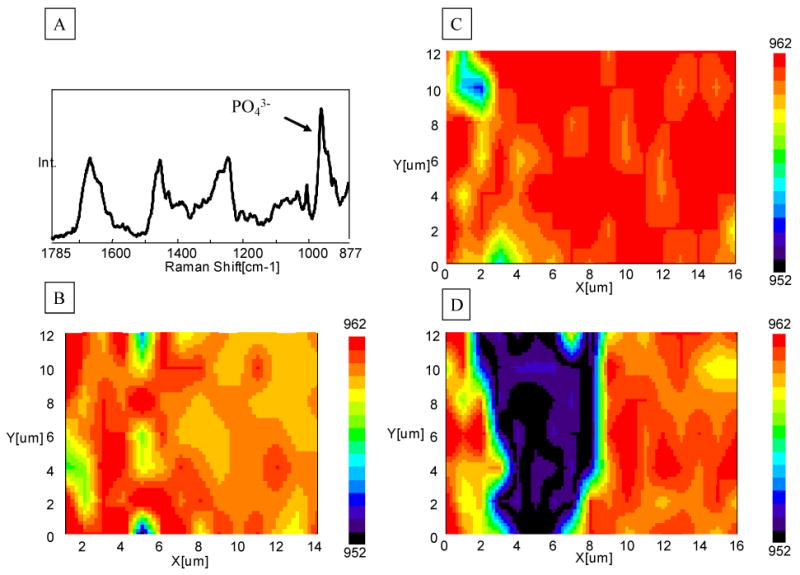
Representative micro-Raman peak shift (952-962 cm−1) imaging of the demineralized dentin layer. (A) The Raman peak shift in the range of 952-962 cm−1 is associated with ν1 vibration of PO43- in mineral; the images generated based on this peak range can be used to identify the presence of mineral in the demineralized layer; (B) Adper™ Prompt L-Pop (APLP), 15s with rubbing; (C) 35% phosphoric acid gel, 15 s, without agitation; (D) 35% phosphoric acid gel, 15 s, with agitation.
To put a figure on the relative mineral/matrix content, images of the ratios of intensities based on 961 (PO43-, mineral) and 1454 (CH2 deformation, matrix) were generated and presented in Fig. 4. Using this technique, the degree and/or depth of demineralization, as a function of spatial position (Fig. 4) were determined. The relative mineral/matrix contents were minimum/neglectable in the demineralized layer of APLP etched dentin (Fig. 4B). The width of this demineralized layer was ∼6 μm, and was similar to that in the H3PO4 gel etched dentin (without agitation) (Fig. 4C). However, the relative mineral contents in the H3PO4 gel etched dentin layer were not neglectable, but were actually little higher in the superficial region of the demineralized layer as compared to APLP etched dentin (Fig. 4C). Agitating gel during etching not only removed the mineral in the demineralized layer but also increased the width of dentin demineralization (∼10 μm) (Fig. 4D).
Fig. 4.
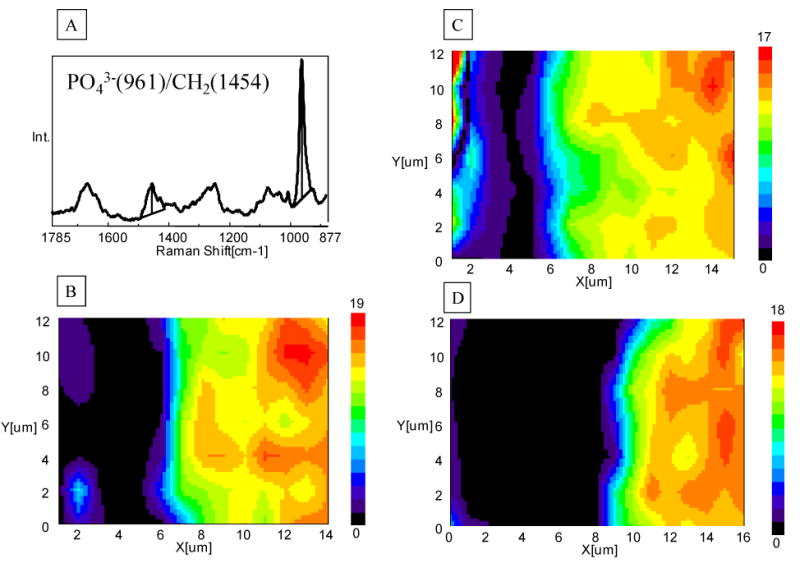
Representative micro-Raman imaging of the demineralized dentin layer based on the ratios of the 961 (ν1 PO43-, mineral) and 1454 (CH2 deformation, matrix). (A) The peak intensity ratios of 961/1454 represent the extent of dentin demineralization; (B) Adper Prompt L-Pop (APLP), 15s with rubbing; (C) 35% phosphoric acid gel, 15 s, without agitation; (D) 35% phosphoric acid gel, 15 s, with agitation.
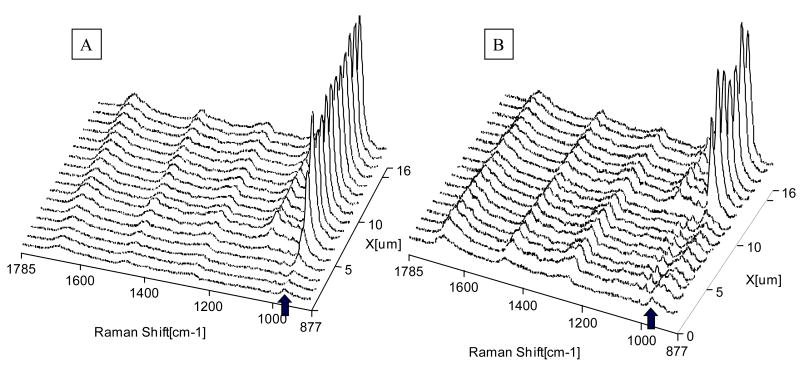
Since the preceding images contained hundreds of very high quality spectra at a resolution of 1-1.5 μm, the more detailed chemical information can be determined across the length and breadth of the demineralized/mineralized dentin interface. As an example, a series of micro-Raman mapping spectra across the interfaces (the position was represented by the dotted line) are represented in Figs. 5 and 6. Fig. 5 shows mapping across the interfaces of APLP etched dentin. The mapping spectra were recorded from the interfaces at positions corresponding to 1-μm intervals with the water immersion lens. The first three spectra of the series, recorded during mapping from the top of the demineralized layer, are presented in detail. Spectral feature associated with the mineral component was apparent in first spectrum (Fig. 5); however, below this layer the mineral peak was decreased. Similarly, the mineral peaks can be clearly seen in mapping spectra from the superficial layer of the other two H3PO4 gel etched dentin specimens (Fig. 6).
Fig. 5.
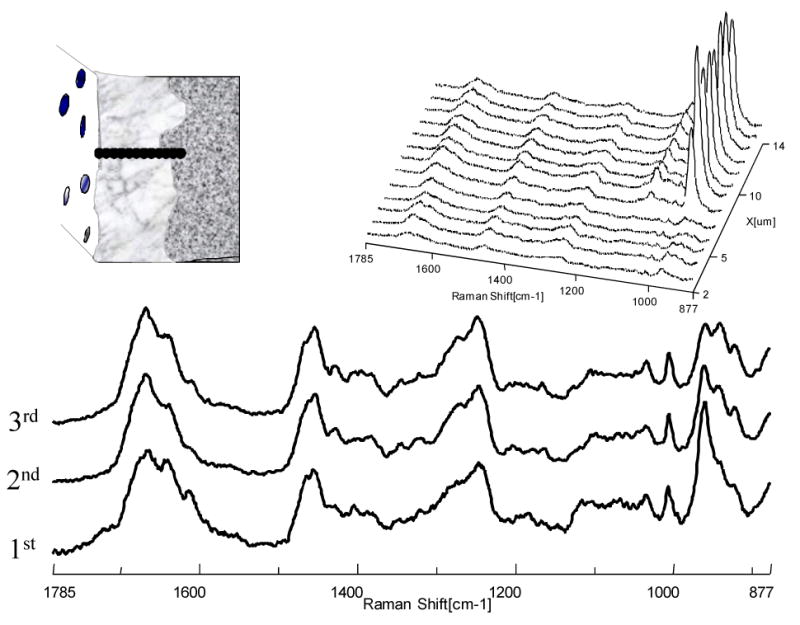
Representative micro-Raman mapping spectra acquired at 1-μm intervals across the interfaces of the acid-etched smear layer, demineralized dentin layer, and dentin (etched with (Adper™ Prompt L-Pop (APLP) for 15 s with rubbing).
Fig. 6.
Representative micro-Raman mapping spectra acquired at 1-μm intervals across the interfaces of the acid-etched smear layer, demineralized dentin layer, and dentin. (A) Etched with 35% phosphoric acid gel for 15 s without agitation; (B) Etched with 35% phosphoric acid gel for 15 s with agitation.
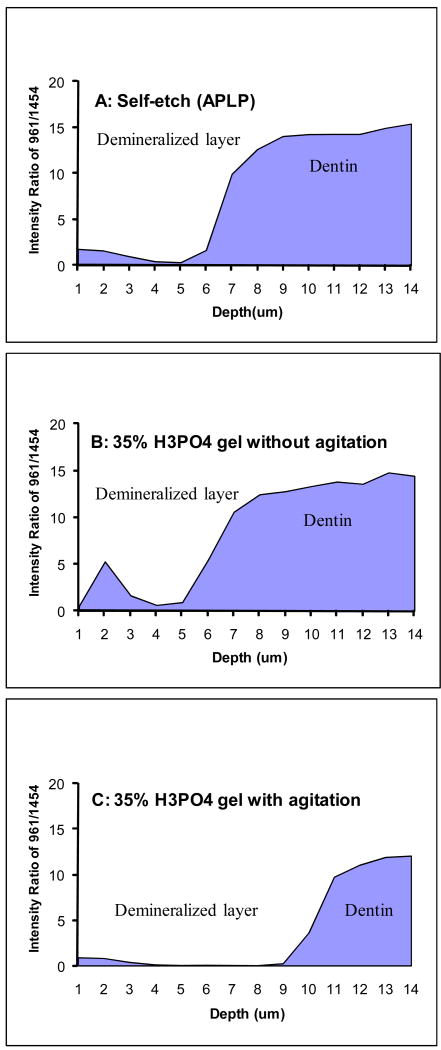
Fig. 7 represents the quantitative ratios of 961/1454 for degree of dentin demineralization as a function of position. The profiles of depth of demineralization for the above three types of etched dentin were clearly observed. The depth of demineralization is similar between APLP etched and H3PO4 gel (without agitation) etched dentin. However, the degree of demineralization is different as a function of position and the mineral contribution persists 2-3 μm into the superficial layer of the later ones. It was noticed that the profile of demineralization of dentin was dramatically different when applying the etchant gel with agitation. The ratios of 961/1454 for degree of mineralization were low (nearly zero) until the position at the 9th-10th μm, then showed a very gradual growth as a function of spatial position. The width of this partially demineralized dentin was 3-4 μm.
Fig. 7.
Raman intensity ratios of 961/1454 as a function of spatial position across the interfaces of the acid-etched smear layer, demineralized dentin layer, and dentin. (A) Adper™ Prompt L-Pop (APLP), 15s with rubbing; (B) 35% phosphoric acid gel, 15 s, without agitation; (C) 35% phosphoric acid gel, 15 s, with agitation.
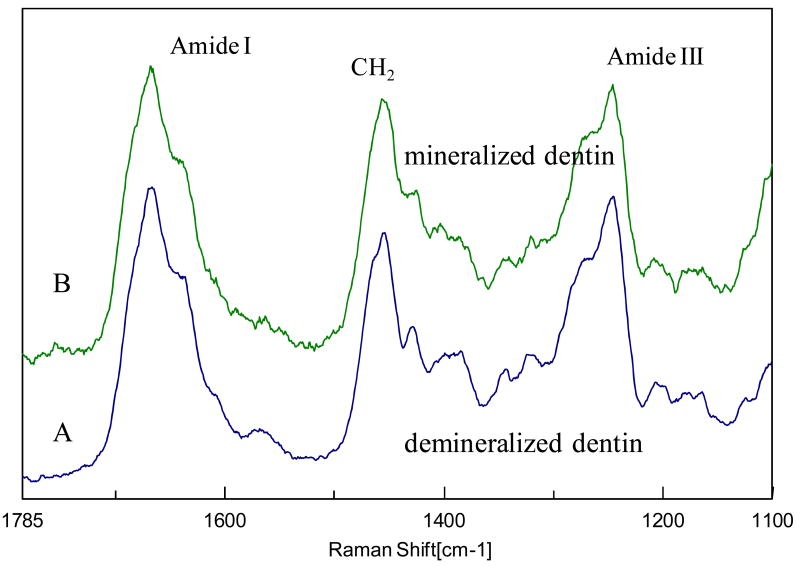
To determine whether application of 35% phosphoric acid gel for 15 s with agitation caused any denaturation of dentin collagen, the Raman spectra containing amide I and III (1100-1765 cm-1) were compared for demineralized dentin and its underlying mineralized dentin (Fig. 8). The similarities of the two spectra indicate that these procedures did not denature dentin collagen.
Fig. 8.
Representative Raman spectra collected (A) from the demineralized layer and (B) mineralized dentin of the same specimen.
4. Discussion
Many dental adhesive systems require the dentin surface to be acid etched prior to bonding. Although considerable progress in bonding techniques has taken place over the past decade, a key problem still remains in our lack of detailed understanding of dentin demineralization. Understanding the depth and chemical profile of the etched dentin surface is important for improving reliability and durability in these systems. Currently, SEM has been used to measure the depth of dentin demineralization both indirectly and directly. In the indirect methods, the depth of the demineralized layer is obtained by measuring the width of the resin interdiffusion zone after applying adhesives [16-18]. In the direct evaluation of the dentin demineralized layer, fixation is employed in an attempt to stabilize the collagen matrix [19]. It was noticed that fixation and subsequent drying of specimens prior to examination by SEM caused substantial dimensional changes in the tissue [20, 21]. The collapse of the collagen network during bonding application or fixation and further by high vacuum causes the values to be inaccurate by the two methods. This leads to significant underestimation of the demineralization depth. It would be very desirable if the depth of dentin demineralization could be measured under its natural wet condition right after acid etching. In this study, both ESEM and Raman microscopy were used to measure and compare the depth and profile of the dentin demineralized layer in its wet condition. Micro-Raman mapping technique combined with water immersion lens appeared to offer a powerful new method to directly measure the depth of the demineralized layer and the mineral distribution under wet conditions right after acid etching and rinsing.
It was originally expected that the dentin specimens would not shrink when they were analyzed in an aqueous medium using ESEM. However, we demonstrated the rather extensive shrinkage experienced by the specimens in ESEM. The demineralized layers still shrink by 50-65% using ESEM. For example, the width of the demineralized layer measured by ESEM was ∼2.0 μm for the dentin etched by 35% H3PO4 gel without agitation. The width of the same demineralized dentin was ∼6 μm measured by Raman microscopy. Using fixation and direct SEM observation of the demineralized layer, it was reported that the width was 2-3 μm when using a similar brand of etchant gel [7]. This indicates that observation of the demineralized layer under wet condition and low vacuum in ESEM does not protect the demineralized collagen network from collapsing.
The results also indicated that Raman microscopy outperformed ESEM in the study of structure in the dentin demineralized layer. The ESEM images of all the demineralized dentin layers showed the appearance of a gel-like structure. The demineralized zone appeared to coalesce and no collagen fibrils were disclosed in any specimens. Currently, there has been argument concerning the issue of the collagen denaturation on exposure to acids. It was suggested [22, 23] that degradation of collagen might occur following exposure of dentin to 30% and higher concentrations of phosphoric acids for 1 min. On the other hand, by examining demineralized dentin layers in a wet, air-dried and critical point-dried state using ESEM and conventional SEM, Gwinnett concluded that degradation of the collagen (by these acids) resulting in micro-morphological change was minimal. This was supported by the well-defined fibrous matrix revealed by critical point drying [24]. It was proposed in that study that the relatively smooth, gel-like appearance in ESEM was most likely artifactual resulting from surface tension effects during desiccation [24]. Direct comparison of demineralization depths of the same specimens from ESEM and Raman indicated that the demineralized layer did shrink by 50-65% immediately after placement in the ESEM chamber (Figs. 1 and 4). Furthermore, by comparing the collagen spectra collected from the demineralized layer and the mineralized dentin, it was shown that the spectra were almost identical (Fig. 8). The amide I and III regions in the spectra are known to be very sensitive to the collagen conformation and secondary structure [25-27]. It is expected that if collagen is denatured, the spectral changes in these regions will be seen [28-30]. The Raman results (Fig. 8) confirmed that the demineralized collagen was not denatured, which is consistent with the AFM study of collagen showing the banding periodicity after acid etching [31, 32].
In addition, SEM is not as sensitive and reliable for the detection of mineral loss from dentin as is the Raman analysis. In the previous dentin demineralization studies, a difference in demineralization depths was a major parameter measured. Our data has shown that the profile of the demineralized layer is more complicated than originally expected. The Raman technique could be used to measure the mineral loss during demineralization both qualitatively and quantitatively. For example, using the phosphate peak in the range of 952-962 cm−1 for identifying the presence of mineral in the demineralized layer, the existence or disappearance of mineral could be observed in the regions across the demineralized/mineralized dentin (Figs. 3B, 3C, 3D). However, this method does not provide information on the extent of mineral left. Using the ratios of 961/1454 for degree of dentin demineralization, the quantitative information such as depth and degree of dentin demineralization could be obtained (Figs. 4 and 7).
The chemical profile of the dentin demineralized layer is dependent on the type of acids and application procedures. Although based on the ESEM images the depths of the demineralized layer between APLP etched and H3PO4 gel (without agitation) etched dentin appeared to be similar, the chemical profile of dentin demineralization was different as a function of depth. More mineral was removed in the APLP etched demineralized dentin, which was not originally expected. This is likely due to the different application procedures between the two etchants, although both were applied according to their manufacturers' instructions. APLP was applied to dentin with rubbing or agitation for 15 s. The 35% H3PO4 gel was applied on the dentin surface and was left to stand undisturbed for the same time period. Although APLP is a self-etching agent, it is more aggressive as compared to other self-etching systems [33]. Applying this agent to dentin surface with agitation created a demineralization depth similar to that by the total etching agent 35% H3PO4 gel without agitation. Moreover, rubbing during application may facilitate dissolving of mineral. To further test this, the total etching gel was agitated during the application. The results confirmed that agitation would help remove the remaining mineral in the demineralized layer, but meanwhile increase the demineralization width (∼10 μm). This information will provide the basis for subsequent investigations on the effects of substrates on adhesive bonding. For example, if the remaining mineral in the demineralized layer is found to inhibit adhesive penetration, applying 35% H3PO4 gel with agitation for shorter time (<15 s) may be a better approach.
In summary, both ESEM and Raman microscopy were used to study the demineralized dentin layer in its wet state. ESEM could be used to reveal demineralized layers in acid-etched dentin, but there were some issues involved such as shrinkage and low resolution and no collagen fibrils were disclosed. Raman Microscopy in combination with the use of a water immersion lens is well suited as a non-destructive tool for the detection of spatial inhomogeneity. With the use of a water immersion lens, chemical compositional changes in the region of the demineralized layer have been analyzed. It was shown that chemical maps/profiles of demineralized dentin layers were more complicated than originally expected. The mineral existed in the superficial layer of all etched dentin covered with smear layers. The mineral was more easily removed underneath the superficial layer. The depth, degree, and profile of dentin demineralization were dependent on the types of acids and application procedures. The null hypothesis was rejected.
Most current adhesives were applied using wet bonding techniques. Under these conditions the dentin is kept fully hydrated throughout the bonding procedure. Our ability to fully characterize the hydrated dentin substrate for bonding (etched dentin surface) is very critical and important for understanding the bonding when applying adhesive resin. Using a water immersion lens, we have developed a technique that allows us to maintain the specimens under water throughout the Raman microspectroscopic analysis. Because the structure of collagen is very sensitive to dessication, this technique is critical to accurate molecular structural characterization of demineralized dentin. Water immersion also reduces the potential that the specimen will be exposed to excess and potentially damaging heat during spectral imaging.
In addition, dentists must usually bond to bio-altered dentin such as caries-affected or sclerotic dentin substrates, but the bond that characteristically forms with these substrates does not provide the durability necessary for long-term clinical function. It is apparent from the above results that acid etching of dentin produces profound changes in the chemical composition, structure, and properties of the bonding matrix. We speculate that as compared to the acid-etched demineralized matrices of normal dentin, the demineralized matrices of acid-etched, bio-altered dentin would exhibit a complex, non-uniform composition and structure. These changes within the substrate could have a direct effect on the quality, strength, and durability of the adhesive/dentin bonds. The agitation technique may enhance etching of sclerotic dentin that has been so resistant to etching. However, this speculation needs to be tested in the future.
Acknowledgments
This study was supported U.S. Public Health Service (USPHS) Research Grants DE015281 and DE015735 from the National Institute of Dental and Craniofacial Research, National Institutes of Health, Bethesda, Maryland. The authors would like to acknowledge the SEM technical support of Dr. Vladimer Dusevich from UMKC School of Dentistry.
Footnotes
Publisher's Disclaimer: This is a PDF file of an unedited manuscript that has been accepted for publication. As a service to our customers we are providing this early version of the manuscript. The manuscript will undergo copyediting, typesetting, and review of the resulting proof before it is published in its final citable form. Please note that during the production process errors may be discovered which could affect the content, and all legal disclaimers that apply to the journal pertain.
References
- 1.Pashley DH, Carvalho RM. Dentine permeability and dentine adhesion. J Dent. 1997;25:355–372. doi: 10.1016/s0300-5712(96)00057-7. [DOI] [PubMed] [Google Scholar]
- 2.Marshall GW, Jr, Marshall SJ, Kinney JH, Balooch M. The dentin substrate: structure and properties related to bonding. J Dent. 1997;25:441–458. doi: 10.1016/s0300-5712(96)00065-6. [DOI] [PubMed] [Google Scholar]
- 3.Tagami J, Tao L, Pashley DH, Hosoda H, Sano H. Effects of high-speed cutting on dentin permeability and bonding. Dent Mater. 1991;7:234–239. doi: 10.1016/S0109-5641(05)80021-1. [DOI] [PubMed] [Google Scholar]
- 4.Wang Y, Spencer P, Walker MP. Chemical profile of adhesive/caries-affected dentin interfaces using Raman microspectroscopy. J Biomed Mater Res Part A. 2007;81A:279–286. doi: 10.1002/jbm.a.30981. [DOI] [PMC free article] [PubMed] [Google Scholar]
- 5.Wang Y, Spencer P, Yao XM. Micro-Raman imaging analysis of monomer/mineral distribution in intertubular region of adhesive/dentin interfaces. J Biomed Opt. 2006;11:024005. doi: 10.1117/1.2187992. [DOI] [PubMed] [Google Scholar]
- 6.Perdigao J, Lambrechts P, Van Meerbeek B, Vanherle G, Lopes AL. Field emission SEM comparison of four postfixation drying techniques for human dentin. J Biomed Mater Res. 1995;29:1111–1120. doi: 10.1002/jbm.820290911. [DOI] [PubMed] [Google Scholar]
- 7.Perdigao J, Lambrechts P, van Meerbeek B, Tome AR, Vanherle G, Lopes AB. Morphological field emission-SEM study of the effect of six phosphoric acid etching agents on human dentin. Dent Mater. 1996;12:262–271. doi: 10.1016/s0109-5641(96)80033-9. [DOI] [PubMed] [Google Scholar]
- 8.Marshall GW, Jr, Wu-Magidi IC, Watanabe LG, Inai N, Balooch M, Kinney JH, Marshall SJ. Effect of citric acid concentration on dentin demineralization, dehydration, and rehydration: atomic force microscopy study. J Biomed Mater Res. 1998;42:500–507. doi: 10.1002/(sici)1097-4636(19981215)42:4<500::aid-jbm4>3.0.co;2-l. [DOI] [PubMed] [Google Scholar]
- 9.Marshall GW, Jr, Inai N, Wu-Magidi IC, Balooch M, Kinney JH, Tagami J, Marshall SJ. Dentin demineralization: effects of dentin depth, pH and different acids. Dent Mater. 1997;13:338–343. doi: 10.1016/s0109-5641(97)80104-2. [DOI] [PubMed] [Google Scholar]
- 10.Marshall GW, Jr, Balooch M, Kinney JH, Marshall SJ. Atomic force microscopy of conditioning agents on dentin. J Biomed Mater Res. 1995;29:1381–1387. doi: 10.1002/jbm.820291109. [DOI] [PubMed] [Google Scholar]
- 11.Kinney JH, Balooch M, Haupt DL, Jr, Marshall SJ, Marshall GW., Jr Mineral distribution and dimensional changes in human dentin during demineralization. J Dent Res. 1995;74:1179–1184. doi: 10.1177/00220345950740050601. [DOI] [PubMed] [Google Scholar]
- 12.Marshall GW, Jr, Balooch M, Tench RJ, Kinney JH, Marshall SJ. Atomic force microscopy of acid effects on dentin. Dent Mater. 1993;9:265–268. doi: 10.1016/0109-5641(93)90072-x. [DOI] [PubMed] [Google Scholar]
- 13.Watari F. In-situ etching observation of human teeth in acid agent by atomic force microscopy. J Electron Microsc (Tokyo) 1999;48:537–544. doi: 10.1093/oxfordjournals.jmicro.a023713. [DOI] [PubMed] [Google Scholar]
- 14.Dusevich VM, Eick JD. Evaluation of demineralized dentin contraction by stereo measurements using environmental and conventional scanning electron microscopy. Scanning. 2002;24:101–105. doi: 10.1002/sca.4950240208. [DOI] [PubMed] [Google Scholar]
- 15.Gilbert LC, Doherty RE. Using ESEM and SEM to compare the performance of dentin conditioners. Microsc Res Tech. 1993;25:419–423. doi: 10.1002/jemt.1070250511. [DOI] [PubMed] [Google Scholar]
- 16.Hashimoto M, Ohno H, Endo K, Kaga M, Sano H, Oguchi H. The effect of hybrid layer thickness on bond strength: demineralized dentin zone of the hybrid layer. Dent Mater. 2000;16:406–411. doi: 10.1016/s0109-5641(00)00035-x. [DOI] [PubMed] [Google Scholar]
- 17.Tanumiharja M, Burrow MF, Tyas MJ, Carpenter J. Field-emission scanning electron microscopy of resin-dentin interface morphology of seven dentin adhesive systems. J Adhes Dent. 2000;2:259–269. [PubMed] [Google Scholar]
- 18.Wang Y, Spencer P, Hager C, Bohaty B. Comparison of interfacial characteristics of adhesive bonding to superficial versus deep dentine using SEM and straining techniques. J Dent. 2006;34:26–34. doi: 10.1016/j.jdent.2005.03.004. [DOI] [PubMed] [Google Scholar]
- 19.Hayat MA, Giaquinta R. Rapid fixation and embedding for electron microscopy. Tissue Cell. 1970;2:191–195. doi: 10.1016/s0040-8166(70)80015-5. [DOI] [PubMed] [Google Scholar]
- 20.Boyde A. Scanning Electron Microscopy. SEM Inc.; AMF O'Hare: 1978. Pros and cons of critical point drying and freeze drying for SEM; pp. 303–314. [Google Scholar]
- 21.Carvalho RM, Yoshiyama M, Brewer PD, Pashley DH. Dimensional changes of demineralized human dentine during preparation for scanning electron microscopy. Arch Oral Biol. 1996;41:379–386. doi: 10.1016/0003-9969(95)00130-1. [DOI] [PubMed] [Google Scholar]
- 22.Chiba M, Itoh K, Wakumoto S. Effect of dentin cleansers on the bonding efficacy of dentin adhesive. Dent Mater J. 1989;8:76–85. doi: 10.4012/dmj.8.76. [DOI] [PubMed] [Google Scholar]
- 23.Okamoto Y, Heeley JD, Dogon IL, Shintani H. Effects of phosphoric acid and tannic acid on dentine collagen. J Oral Rehabil. 1991;18:507–512. doi: 10.1111/j.1365-2842.1991.tb00073.x. [DOI] [PubMed] [Google Scholar]
- 24.Gwinnett AJ. Chemically conditioned dentin: a comparison of conventional and environmental scanning electron microscopy findings. Dent Mater. 1994;10:150–155. doi: 10.1016/0109-5641(94)90024-8. [DOI] [PubMed] [Google Scholar]
- 25.Frushour BG, Koenig JL. Raman scattering of collagen, gelatin, and elastin. Biopolymers. 1975;14:379–391. doi: 10.1002/bip.1975.360140211. [DOI] [PubMed] [Google Scholar]
- 26.Goheen SC, Lis LJ, Kauffman JW. Raman spectroscopy of intact feline corneal collagen. Biochim Biophys Acta. 1978;536:197–204. doi: 10.1016/0005-2795(78)90065-x. [DOI] [PubMed] [Google Scholar]
- 27.Sane SU, Cramer SM, Przybycien TM. A holistic approach to protein secondary structure characterization using amide I band Raman spectroscopy. Anal Biochem. 1999;269:255–272. doi: 10.1006/abio.1999.4034. [DOI] [PubMed] [Google Scholar]
- 28.Renugopalakrishnan V, Carreira LA, Collette TW, Dobbs JC, Chandraksasan G, Lord RC. Non-uniform triple helical structure in chick skin type I collagen on thermal denaturation: Raman spectroscopic study. Z Naturforsch [C] 1998;53:383–388. doi: 10.1515/znc-1998-5-613. [DOI] [PubMed] [Google Scholar]
- 29.Spencer P, Wang Y, Walker MP, Swafford JR. Molecular structure of acid-etched dentin smear layers - in situ study. J Dent Res. 2001;80:1802–1807. doi: 10.1177/00220345010800090601. [DOI] [PubMed] [Google Scholar]
- 30.Wang Y, Spencer P. Analysis of acid-treated dentin smear debris and smear layers using confocal Raman microspectroscopy. J Biomed Mater Res. 2002;60:300–308. doi: 10.1002/jbm.10108. [DOI] [PubMed] [Google Scholar]
- 31.El Feninat F, Ellis TH, Sacher E, Stangel I. Moisture-dependent renaturation of collagen in phosphoric acid etched human dentin. J Biomed Mater Res. 1998;42:549–553. doi: 10.1002/(sici)1097-4636(19981215)42:4<549::aid-jbm10>3.0.co;2-l. [DOI] [PubMed] [Google Scholar]
- 32.El Feninat F, Ellis TH, Sacher E, Stangel I. A tapping mode AFM study of collapse and denaturation in dentinal collagen. Dent Mater. 2001;17:284–288. doi: 10.1016/s0109-5641(00)00083-x. [DOI] [PubMed] [Google Scholar]
- 33.Wang Y, Spencer P. Physicochemical interactions at the interfaces between self-etch adhesive systems and dentine. J Dent. 2004;32:567–579. doi: 10.1016/j.jdent.2004.06.005. [DOI] [PubMed] [Google Scholar]


