

Abstract
Ghrelin targets the hypothalamus to regulate food intake and adiposity. Endogenous ghrelin receptors [growth hormone secretagogue receptor (GHSR)] are also present in extrahypothalamic sites where they promote circuit activity associated with learning and memory, and reward seeking behavior. Here, we show that the substantia nigra pars compacta (SNpc), a brain region where dopamine (DA) cell degeneration leads to Parkinson's disease (PD), expresses GHSR. Ghrelin binds to SNpc cells, electrically activates SNpc DA neurons, increases tyrosine hydroxylase mRNA and increases DA concentration in the dorsal striatum. Exogenous ghrelin administration decreased SNpc DA cell loss and restricted striatal dopamine loss after 1-methyl-4-phenyl-1,2,5,6 tetrahydropyridine (MPTP) treatment. Genetic ablation of ghrelin or the ghrelin receptor (GHSR) increased SNpc DA cell loss and lowered striatal dopamine levels after MPTP treatment, an effect that was reversed by selective reactivation of GHSR in catecholaminergic neurons. Ghrelin-induced neuroprotection was dependent on the mitochondrial redox state via uncoupling protein 2 (UCP2)-dependent alterations in mitochondrial respiration, reactive oxygen species production, and biogenesis. Together, our data reveal that peripheral ghrelin plays an important role in the maintenance and protection of normal nigrostriatal dopamine function by activating UCP2-dependent mitochondrial mechanisms. These studies support ghrelin as a novel therapeutic strategy to combat neurodegeneration, loss of appetite and body weight associated with PD. Finally, we discuss the potential implications of these studies on the link between obesity and neurodegeneration.
Introduction
Parkinson's disease (PD) is characterized by the progressive degeneration of dopamine (DA) neurons projecting from the substantia nigra pars compacta (SNpc) to the dorsal striatum. The resulting loss of dopamine in the striatum leads to debilitating motor dysfunction, including rigidity, resting tremor, postural instability, and bradykinesia. Familial or genetic causes of PD only account for 10% of all cases, whereas 90% are considered sporadic and may manifest as a result of a variety of factors.
Obesity is considered one of the most important health concerns of our generation and is predicted to reduce life expectancy in the future (Olshansky et al., 2005). While obesity is a known salient risk factor in diabetes, cardiovascular disease, and cancer, the risk of neurological disease after prolonged obesity is only starting to emerge. Recent human studies show that body mass index, midlife adiposity, and diabetes are associated with the neurodegenerative illness PD (Abbott et al., 2002; Hu et al., 2006, 2007). Furthermore, obesity is a risk factor for chemically induced neurodegeneration in mice (Choi et al., 2005). In examining potential mechanisms linking obesity and neurodegeneration, we noted that the gut hormone ghrelin is inversely related to obesity, such that levels are higher during negative energy balance or calorie restriction and lower during positive energy balance or obesity (Tschöp et al., 2001). Indeed, calorie restriction, in which ghrelin levels are increased, attenuates 1-methyl-4-phenyl-1,2,5,6 tetrahydropyridine (MPTP)-induced neurotoxicity in nonhuman primates (Maswood et al., 2004) and mice (Duan and Mattson, 1999). Further studies showed that cultured cells treated with serum from calorie-restricted rats displayed mitochondrial biogenesis, enhanced bioenergetic capacity, and reduced production of reactive oxygen species (ROS) (López-Lluch et al., 2006), indicating that the effects of calorie restriction may be mediated by a hormonal factor affecting mitochondrial metabolism. Ghrelin also preserves mitochondrial integrity during oxygen–glucose deprivation (Chung et al., 2007), and mitochondrial dysfunction lies at the heart of PD (Abou-Sleiman et al., 2006), suggesting that the elevated ghrelin levels during calorie restriction may promote neuroprotection against MPTP intoxication in mice. Recent studies show that ghrelin attenuates MPTP neurotoxicity in DA neurons (Jiang et al., 2008) by enhancing mitochondrial function (Dong et al., 2009). Although the molecular mechanisms regulating mitochondrial function are unknown, our previous studies identified uncoupling protein 2 (UCP2) as a critical mitochondrial protein regulating nigrostriatal DA function by buffering mitochondrial ROS production, enhancing mitochondrial respiration, and increasing mitochondrial biogenesis (Andrews et al., 2005a,b; Conti et al., 2005). We recently demonstrated that ghrelin was a robust activator of mitochondrial function in the hypothalamus and that this action was dependent on UCP2 (Andrews et al., 2008). Therefore, we tested the hypothesis that ghrelin promotes nigrostriatal dopamine function by increasing mitochondrial function in a UCP2-dependent manner.
Materials and Methods
Animals.
The Institutional Animal Care and Use Committee of Yale University has approved all procedures described below. UCP2 knock-out mice are on a C57/B6 background. Ghrelin knock-out mice (on a C57/B6 background) were obtained from Regeneron Pharmaceuticals and bred in our facilities. These genetic mouse lines have been described previously (Wortley et al., 2004). Mice expressing growth hormone secretagogue receptors (GHSRs) only in catecholaminergic cells (on a C57/B6 background) were generated by first crossing mice homozygous for a recombinant “null” GHSR allele (Zigman et al., 2005) with mice expressing Cre recombinase under the control of a tyrosine hydroxylase (TH) promoter (TH-Cre) (Savitt et al., 2005).
Generation of mice expressing ghrelin receptors selectively in catecholaminergic cells.
We used mice with GHSRs only in catecholaminergic cells by first crossing mice homozygous for a recombinant “null” GHSR allele (Zigman et al., 2005) with mice expressing TH-Cre (Savitt et al., 2005). As described previously, the recombinant null GHSR allele differs from the wild-type GHSR allele in that it has been altered by the insertion of a loxP-flanked transcriptional blocking cassette into an intron located downstream of the transcriptional start site and upstream of the translational start site of the murine GHSR gene. The replacement of two wild-type GHSR alleles with two recombinant GHSR-null alleles results in GHSR-null mice that no longer acutely increase food intake in response to exogenous ghrelin administration and are resistant to the development of diet-induced obesity (Zigman et al., 2005). The offspring of GHSR-null mice × TH-Cre mice were then bred with mice containing either no, one, or two copies of the recombinant null GHSR allele, to generate the three desired study animal genotypes: wild-type mice (containing two copies of the wild-type GHSR allele and no copies of the TH-Cre transgene), GHSR-null mice (containing two copies of the recombinant null GHSR allele and no copies of the TH-Cre transgene), and “TH-only” mice (containing two copies of the recombinant null GHSR allele and one copy of the TH-Cre transgene). In the presence of Cre recombinase, the transcriptional blocking cassette and one of the loxP sites is removed from the recombinant null GHSR alleles, thus reactivating the ability to synthesize functional GHSR mRNAs. The specificity of Cre recombinase expression afforded by the promoter elements used in the TH-Cre transgene allows for selective reactivation of GHSR expression within tyrosine hydroxylase-expressing cells that have the latent genetic capacity to express GHSR. To validate the reactivation of GHSR expression selectively within TH cells of “TH-only” mice, brains were examined for the presence of GHSR mRNA by in situ hybridization histochemistry (ISHH), using a mouse GHSR-specific riboprobe (Zigman et al., 2006). GHSR transcripts were consistently visualized by ISHH within the substantia nigra (SN) and ventral tegmental area (see Fig. 3 A–C), within certain hypothalamic nuclei (the arcuate nucleus, the anteroventral periventricular nucleus, the dorsomedial nucleus, and the capsule of the ventromedial nucleus), and occasionally within scattered cells of the nucleus of the solitary tract. The pattern of GHSR expression observed within the “TH-only” mice is similar to the GHSR-TH coexpression pattern that we observe in the wild-type mouse brain (not pictured) and involves a few more sites than what has previously been described in the rat brain (Zigman et al., 2006). Similar to what we had previously described for GHSR-null mice (Zigman et al., 2005), strong binding of the GHSR riboprobe was also observed in the Edinger-Westphal nucleus of “TH-only” mice, which is neither an area of TH expression nor TH-Cre activity. In situ hybridization histochemistry for GHSRs was performed as previously described (Zigman et al., 2006).
Figure 3.
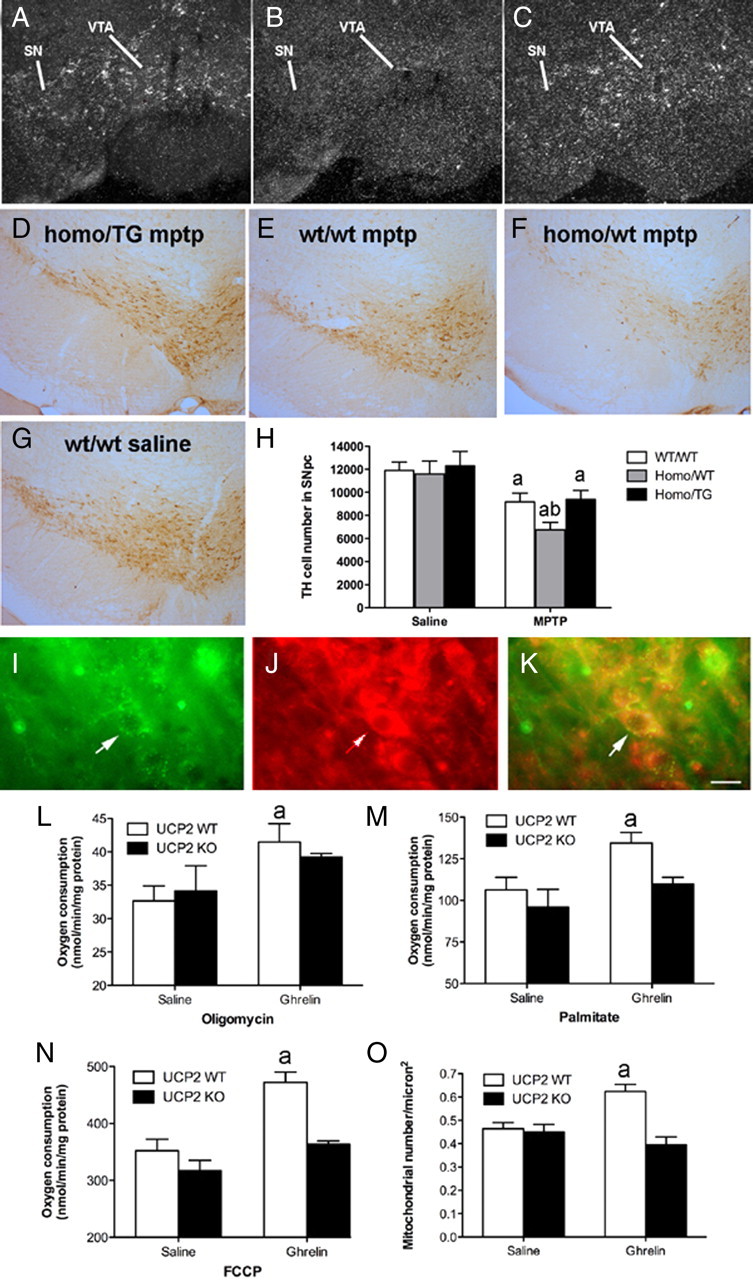
Selective reactivation of GHSR TH neurons restricts MPTP-induced DA cell loss. A–C, Representative dark-field photomicrographs of in situ hybridization histochemistry experiments performed on mouse brains using a mouse GHSR-specific riboprobe. Shown are GHSR mRNA expression within the substantia nigra (SN) and ventral tegmental area (VTA) of wild-type mice (A), the lack of GHSR transcripts within the SN and VTA of ghsr−/− mice (B), and reactivated GHSR mRNA expression within the SN and VTA of “homo/TG” mice (C). D–G, Representative low-power images of TH staining in the SNpc after MPTP insults (n = 6 all groups) in all genotypes (E–G) compared with w/w saline (D). H, Unbiased stereological quantification of total TH cell number in the SNpc of mice treated with saline or MPTP.aSignificant with respect to saline-treated control mice. bSignificant with respect to w/w MPTP-treated mice (p < 0.05). I–O, Ghrelin promotes UCP2-dependent mitochondrial respiration and proliferation. I, Immunofluorescent image showing GHSR in the SNpc. J, UCP2 in the SNpc using β galactosidase, which is the protein encoded by the lacZ reporter gene. K, Merge showing that GHSRs and UCP2 are coexpressed in SNpc neurons. Scale bar, 1 μm. L, Ghrelin increases mitochondrial respiration after the addition of oligomycin in wt but not ucp2−/− mice (10 nmol, i.p.; n = 4). M, Elevated uncoupling activity in UCP2 wt but not ucp2−/− mice after ghrelin treatment as indicated by increased mitochondrial respiration after the addition of the free fatty acid palmitate (n = 4). N, FCCP increases total respiratory capacity in UCP2 wt but not ucp2−/− mice after ghrelin injection (n = 4, each sample represents 3 pooled midbrain dissections). O, Increased mitochondrial number in SNpc DA neurons after ghrelin injection 3 h earlier (10 nmol, n = 13–15). Data are presented as the mean ± SEM. aSignificant respect to wt saline.
Biotinylated ghrelin binding in the SN.
To test whether ghrelin binds to cells in the SN, 100 μm sections containing these regions were processed for binding studies as described previously (Cowley et al., 2003). Briefly, saline-perfused rat brains (n = 4) were removed, sectioned, and immediately reacted with biotinylated ghrelin (1 m; Phoenix Pharmaceuticals) alone or in combination with an equal amount of unlabeled (cold) ghrelin (1 m; Phoenix Pharmaceuticals) for 20 min at 4°C. Sections were fixed with 4% paraformaldehyde and reacted with avidin–Texas Red and analyzed using a Zeiss microscope equipped with fluorescent filters.
Patch-clamp recordings from SNpc dopamine neurons.
Brain slices (300 μm) containing the SNpc, were cut on a vibratome from 2- to 3-week-old male and female mice (n = 9) and rats (n = 5). Briefly, animals were anesthetized with Nembutal (80 mg/kg) and then decapitated. The brains were rapidly removed and immersed in cold (4°C) oxygenated bath solution [containing the following (in mm): 150 NaCl, 2.5 KCl, 2 CaCl2, 2 MgCl2, 10 HEPES, and 10 glucose, pH 7.3 with NaOH]. After being trimmed to contain only the SNpc, slices were transferred to a recording chamber, where they were constantly perfused with bath solution at 2 ml/min. Dopamine neurons in the SNpc were identified by presence of a large I h current (>100 pA) evoked by hyperpolarizing voltage steps from −50 to −120 mV for 2 s (Abizaid et al., 2006). This approach identifies dopaminergic cells with >90% accuracy (Abizaid et al., 2006). In brain slices, whole-cell current clamp was used to observe spontaneous action potentials. Slices were maintained at 33°C and perfused continuously with artificial CSF (bubbled with 5% CO2 and 95% O2) containing the following (in mm): 124 NaCl, 3 KCl, 2 CaCl2, 2 MgCl2, 1.23 NaH2PO4, 26 NaHCO3, and 10 glucose, pH 7.4 with NaOH. Ghrelin was applied to the recording chamber via bath application. The pipette solution contained the following (in mm): 140 gluconic acid, 2 CaCl2, 2 MgCl2, 1 EGTA, 10 HEPES, 4 Mg-ATP, and 0.5 Na2-GTP, pH 7.3 with NaOH.
Real-time PCR.
RNA was extracted from the midbrain of 8 ghrelin-treated (10 nmol, i.p.) mice or 8 saline-treated mice using TRIzol (Invitrogen) according to the manufacturer's instructions. cDNA was synthesized using the First-Strand cDNA synthesis kit (GE Healthcare) using a total of 3 μg of total RNA in 15 μl of total volume. Real-time PCR analysis of TH mRNA (5′-ggaggctttccagcttctg-3′, 5′-gtcagccaacatgggtacg-3′) was performed using iQ SYBR Green SuperMix (Bio-Rad) and 0.5 μm of each primer. Primers for 18S were used as controls. Measurements were performed on an iCycler (Bio-Rad).
Mitochondria number.
Animals were perfused and their brains were processed for TH immunolabeling for electron microscopic examination. Ultrathin sections were cut on a Leica ultra microtome, collected on Formvar-coated single-slot grids and analyzed with a Tecnai 12 Biotwin (FEI) electron microscope. Mitochondria were counted blindly from randomly selected sections, and Scion Image was used to normalize cytoplasmic area so that mitochondrial number per cell is expressed in square micrometers.
MPTP administration.
Mice were injected with MPTP (40 mg/kg, i.p.) in saline as described previously (Andrews et al., 2005b). Control animals were given saline. Animals were killed and perfused 7 d later and processed for immunohistochemistry or HPLC for DA and metabolites. n = 8–10 for ghrelin wt and −/− mice and n = 6 for GHSR w/w, homo/wt, and homo/TG.
TH cell quantification.
Free floating sections were stained with TH (1:5000, Millipore Bioscience Research Reagents) and visualized with DAB using standard procedures. We then used design-based unbiased stereology methods to quantify TH-immunoreactive cells in the SNpc. Cells were visualized by a Zeiss microscope and relayed via a MicroFibre digital camera to a computer where they were counted by a blinded observer using the optical fractionator StereoInvestigator software (MicroBrightField). Systematic sampling of every fourth section was collected through the SNpc beginning at approximately bregma −2.06 mm and finishing at approximately −4.16 mm. Sections were cut at 50 μm to allow for a 20 μm optical dissector within each section after dehydration and mounting. The first sample section from the first 1–4 sections collected was chosen at random. TH cells were counted in grids randomly positioned by the software in the outlined counting area through all optical planes, thus creating a 3 dimensional counting area. The counting frame width and height was 55 μm producing an area of 3025 μm. With this counting frame area we discovered that we needed to sample ∼150 sites throughout the entire SNpc and count ∼120 neurons throughout the entire SNpc to give an acceptable coefficient of error (using the Gunderson method) of 0.1 using the smoothness factor m = 0. The smoothness factor defines the cell distribution of a structure that is sensitive to small changes in sampling. We have applied the more rigorous smoothness factor of m = 0 to account for sudden changes in cell distribution across our region of interest. The coefficient of error provides a means to estimate sampling precision, which is independent of natural biological variance. As the value approaches 0, the uncertainty in the estimate precision reduces. A coefficient of error = 0.1 is deemed acceptable. Cells were only counted if they touched the inclusion border or did not touch the exclusion border of the sampling grid.
Striatal DA measurements.
When the animals were killed (7 d after MPTP treatment), both striata were rapidly dissected on a chilled glass plate and frozen at −70°C. The samples were subsequently thawed in 0.4 ml of chilled 0.1 m perchloric acid and sonicated. Aliquots were taken for protein quantification using a spectrophotometric assay. Other aliquots were centrifuged, and DA levels were measured in supernatants by HPLC with electrochemical detection. Concentrations of DA and metabolites were expressed as nanograms per milligram protein (mean ± SEM).
Mitochondrial respiration measurements.
Wild-type or ucp2 −/− mice were treated with ghrelin or saline 3 h before they were killed. The SN was rapidly dissected and homogenized in the isolation buffer (215 mm mannitol, 75 mm sucrose, 0.1% fatty acid-free BSA, 20 mm HEPES, and 1 mm EGTA, pH adjusted to 7.2 with KOH). The homogenate was spun at 1300 × g for 3 min, the supernatant was removed, and the pellet was resuspended with isolation buffer and spun again at 1300 × g for 3 min. The two sets of supernatants from each sample were topped off with isolation buffer and spun at 13,000 × g for 10 min. The supernatant was discarded, and the step was repeated. After this second spin at 13,000 × g, the supernatant was discarded, and the pellets were resuspended with isolation buffer without EGTA and spun at 10,000 × g for 10 min. The final synaptosomal pellet was resuspended with 50 μl of isolation buffer without EGTA. Protein concentrations were determined with a BCA protein assay kit (Pierce). Mitochondrial respirations were assessed using a Clark-type oxygen electrode (Hansatech Instruments) at 37°C with pyruvate and malate (5 and 2.5 mm) as oxidative substrates in respiration buffer (215 mm mannitol, 75 mm sucrose, 0.1% fatty acid-free BSA, 20 mm HEPES, 2 mm MgCl, and 2.5 mm KH2PO4, pH adjusted to 7.2 with KOH). After the addition of oligomycin, proton conductance was measured as increased fatty acid-induced respiration (Echtay et al., 2002). Total uncoupled respiration was also measured after the addition of the protonophore carbonylcyanide-4-(trifluoromethoxy)-phenylhydrazone (FCCP). For analysis of ADP-dependent respiration, ADP was added after the addition of oxidative substrates.
Estimation of ROS production.
Wild-type and ucp2−/− mice were injected with ghrelin (10 nmol), and the midbrain was harvested 3 h later. Mitochondria were isolated as described above. ROS production was quantified using dichlorodihydrofluorescein diacetate (DCF). DCF is a cell-permeant indicator for intracellular ROS that is nonfluorescent until the acetate groups are removed by intracellular esterases and oxidation occurs within the cell. Using a fluorescence plate reader (excitation 485 nm, emission 528 nm), hypothalamic ROS in ghrelin-treated or saline-treated samples was estimated in isolated synaptosomes in the presence and absence of oligomycin. Oligomycin induces maximal ROS production as it inhibits the ATP synthase. Data are expressed as arbitrary fluorescence units. In vivo ghrelin-induced ROS production in immunostained TH neurons in wt or ucp2−/− mice was measured by injecting dihydroethidium (DHE), as it is specifically oxidized by superoxide to red fluorescent ethidium. A 1 mg/ml concentration was injected into the femoral vein of lightly anesthetized mice. Mice were allowed to recover for ∼90 min and were then injected with ghrelin (10 nmol, i.p.) and transcardially perfused 3 h later. Sections were processed normally for TH immunohistochemistry. Fluorescent mitochondria (red channel) were counted blindly in TH neurons (Andrews et al., 2005b).
Statistical analyses.
All data are presented as mean ± SEM. Statistical differences among groups were determined by unpaired two-tailed Student's t tests or two-way ANOVA followed by Bonferroni post hoc test as stated.
Results
Ghrelin receptors and binding in the SNpc
Biotinylated ghrelin binding was present throughout the SNpc with a similar distribution pattern to GHSR immunolabeled cells (Fig. 1 A1–A3). Ghrelin binding was punctate and associated with neuronal perikarya similar to GHSR immunostaining, suggesting ghrelin binding to GHSRs in the SNpc. No binding was observed when unlabeled ghrelin was added to the incubation solution.
Figure 1.

Ghrelin targets SNpc DA neurons and regulates nigrostriatal DA function. A1, Low-power image showing ghrelin binding in the SNpc using biotinylated ghrelin. A2, High-power image of the neurons indicated by arrows in A1. A3, Absence of binding in the SNpc when unbiotinylated ghrelin is used. Both biotinylated ghrelin and unbiotinylated are used at 10 nmol. SNr, Substantia nigra reticulata. Scale bars: A1, 30 μm; A2, A3, 10 μm. B, Ghrelin significantly increased SNpc DA action potential frequency above baseline (n = 11 DA cells identified by characteristic I h currents). Data are presented as the mean ± SEM. aSignificant with respect to control, p < 0.05. Washout reduced ghrelin-elevated firing back to control levels. C, Representative action potential trace recordings from control, ghrelin, and washout conditions.
Ghrelin increases the firing rate of SNpc DA neurons
DA neurons (n = 11) in the SNpc were identified based on their characteristic I h currents (Johnson and North, 1992). Spontaneous action potentials were recorded under current clamp for at least 10 min of stable recording. Ghrelin (1–3 μmol) was applied via bath application and significantly increased action potential frequency above baseline (Fig. 1 B,C), providing direct evidence that ghrelin promotes action potential firing in SNpc DA neurons. Ten of eleven identified DA neurons responded to ghrelin.
Ghrelin increases striatal DA levels
We measured striatal DA concentration using HPLC 3 h after ghrelin injection (10 nmol, i.p.) in mice. Ghrelin produced a robust and reproducible increase in DA concentration in the dorsal striatum (saline 119.4 ± 9.9 vs ghrelin 153.7 ± 4.7 ng/mg protein, n = 7, p < 0.05). These results are consistent with our recent study (Abizaid et al., 2006) and reports using in vivo microdialysis, in which ghrelin increases extracellular DA concentration in the ventral striatum (Jerlhag et al., 2006, 2007).
Ghrelin increases TH mRNA levels in the SN
TH is the rate-limiting enzyme of dopamine biosynthesis. Three hours after ghrelin injection (10 nmol, i.p.), TH mRNA expression was significantly increased in the midbrain compared with saline-injected controls (TH mRNA; saline 1.0 ± 0.1 vs ghrelin 2.9 ± 0.4-fold increase, n = 10–11, p < 0.05).
Ghrelin induces increased mitochondrial number in SNpc DA perikarya
As ghrelin increased mitochondrial number in NPY neurons in the arcuate nucleus of the hypothalamus (Andrews et al., 2008), we tested whether ghrelin may also increase mitochondrial number in SNpc TH neurons using electron microscopy. Three hours after ghrelin injection, mice exhibited increased mitochondrial number in TH perikarya of the SNpc (saline 0.46 ± 0.03 vs ghrelin 0.62 ± 0.03 mitochondrial number/μm2, n = 14–12, p < 0.05). To validate our electron microscopic analysis of mitochondrial biogenesis in SNpc TH neurons, we examined nuclear respiratory factor 1 (NRF1) mRNA, an important transcriptional regulator of mitochondrial biogenesis, in the SN in saline- and ghrelin-treated mice (Dhar et al., 2008). After 3 h, ghrelin stimulated the fold increase of NRF1 mRNA relative to saline (saline 1.042 ± 0.21 vs ghrelin 3.285 ± 0.68, n = 4 and 7, p < 0.05), thus substantiating the claim that ghrelin promotes SNpc dopamine function by increasing mitochondrial biogenesis as seen in NPY neurons of the hypothalamus (Andrews et al., 2008).
Ghrelin protects against MPTP-induced SNpc DA cell loss
The observation that ghrelin promotes SNpc DA neuronal function and mitochondrial proliferation raises the possibility that ghrelin strengthens the nigrostriatal dopaminergic system during increased cellular stress. Seven days after mice were implanted with osmotic minipumps delivering ghrelin (10 nmol/d) or saline, we injected one dose of MPTP (40 mg/kg) or saline. Seven days after MPTP injection, mice were killed and processed for TH immunohistochemistry or HPLC determination of striatal DA and DOPAC levels and dopamine turnover. In this paradigm, there was no protective effect of continuous ghrelin administration on total TH cell number or striatal DA levels after MPTP treatment (supplemental Fig. 1, available at www.jneurosci.org as supplemental material).
We next analyzed the effect of exogenous ghrelin only when ghrelin levels would be elevated in physiological conditions, i.e., in the absence of food, as ghrelin is increased during negative energy balance (Fig. 2 A–G). We treated mice with daily injections of exogenous ghrelin (10 nmol, i.p.) or saline for 7 d before and 7 d after MPTP injections. Mice were injected immediately before the dark phase, and food was removed overnight. Ghrelin- and saline-treated mice were given 3 g of standard chow the following morning at 9:00 A.M. On the seventh day of ghrelin treatment, MPTP was administered (40 mg/kg, i.p.) to saline- and ghrelin-treated mice.
Figure 2.
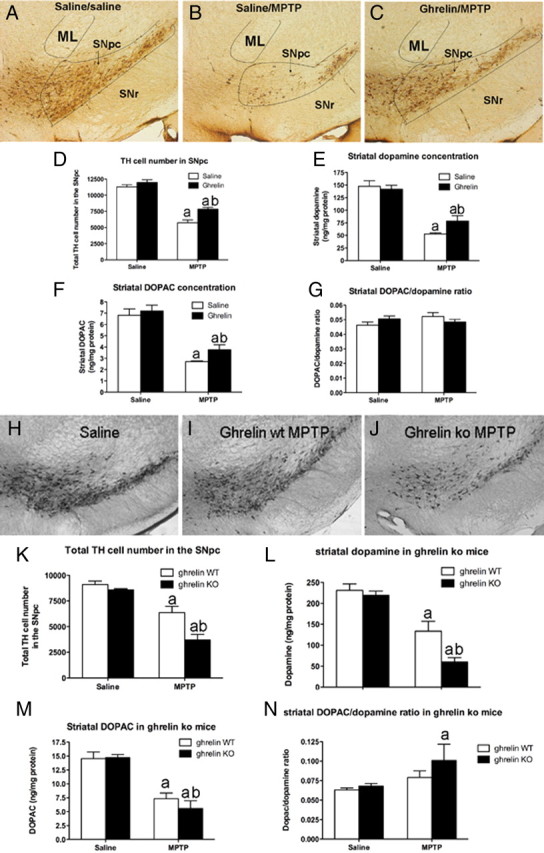
Ghrelin attenuates MPTP-induced nigrostriatal DA damage. A–C, Representative images showing MPTP-induced TH cell loss in the SNpc of saline/saline, saline/MPTP, or ghrelin/MPTP-treated mice. In each picture the SNpc, indicated by the black lines, is at the same approximate rostrocaudal extent. ML represents the medial lemniscus and SNr represents the substantia nigra reticulata. D, Unbiased stereological quantification of total TH cell number in the SNpc shows that ghrelin restricts MPTP-induced TH cell loss (n = 6). E, F, Ghrelin restricts dopamine loss (E) as well as DOPAC loss (F) in the striatum (n = 6). G, No difference in striatal DOPAC/dopamine ratio was observed (n = 6). aSignificant with respect to saline or ghrelin/saline-treated mice; bsignificantly increased compared with saline/MPTP-treated mice (p < 0.05). H–J, Lower-power images showing representative DA cell number in SNpc after saline (H, n = 10), MPTP to ghrelin wt (I, n = 8), or MPTP to ghrelin −/− mice (J, n = 9). Note the significant loss of DA neurons in ghrelin −/− mice treated with MPTP compared with ghrelin wt MPTP-treated mice. K, Stereological quantification shows that ghrelin −/− mice have significantly fewer surviving DA cells in the SNpc. L, Ghrelin −/− mice also exhibit reduced striatal DA content compared with wt after MPTP intoxication. M, Striatal DOPAC concentrations in ghrelin wt and ghrelin −/− mice did not differ. N, Striatal DOPAC/dopamine ratio was increased in ghrelin −/− mice but not ghrelin wt mice after MPTP. Data are presented as the mean ± SEM. aSignificant with respect to saline controls; bsignificant with respect to wt MPTP (p < 0.05).
There was no difference in estimated total number of TH cells in the entire SNpc in mice treated with ghrelin and saline (designated ghr/sal) or saline and saline (designated sal/sal) (Fig. 2 D). Mice treated with saline followed by MPTP (designated sal/MPTP) and mice treated with ghrelin followed by MPTP (designated ghr/MPTP) both displayed significant TH cell loss in the SNpc. However, ghrelin treatment significantly attenuated TH cell loss in the SNpc in response to MPTP compared with sal/MPTP controls (Fig. 2 D). Ghrelin treatment restricted dopamine cell loss to 33% of control mice whereas saline treatment resulted in 49% DA cell loss compared with controls after MPTP lesion, indicating that ghrelin promoted dopamine SNpc cell survivability after MPTP intoxication. In line with this, ghrelin significantly attenuated the MPTP-induced loss of dopamine (Fig. 2 E) and DOPAC (Fig. 2 F), while striatal DOPAC/dopamine ratios did not show a statistical difference (Fig. 2 G). Dopamine in sal/MPTP mice was 65% lower than controls, whereas ghr/MPTP showed a 45% loss of striatal dopamine. These experiments demonstrate that ghrelin can restrict DA and DA cell loss in a mouse model of PD when circulating ghrelin levels are boosted at the time when endogenous ghrelin is naturally induced. It should be noted that these mice normally ate ∼3.5 g of food per day; thus, our paradigm represents a mild form of food restriction. Despite the fact that mice fed in this manner did not significantly lose body weight (supplemental Fig. 2, available at www.jneurosci.org as supplemental material) and that only ghrelin-treated mice showed neuroprotection in the SNpc compared with saline-treated mice fed in the same restriction paradigm, it is likely that restricted, exogenous ghrelin treatment as we applied enhances cellular mechanisms that exert beneficial effects of calorie restriction.
Ghrelin and GHSR knock-out animals manifest increased dopamine loss after MPTP
To further examine the role of ghrelin and GHSR receptor in maintaining the integrity of the SN dopamine system, we analyzed the effect of MPTP in transgenic animals in which either ghrelin or the ghrelin receptor, GHSR, was ablated (Fig. 2 H–N). Our results revealed that after saline injection there was no observable difference in TH-immunoreactive cells in the SNpc of ghrelin −/− mice compared with wild-type littermates (Fig. 2 K). MPTP produced a significant loss of TH neurons in both wt and ghrelin −/− mice compared with saline controls. However, the loss of TH neurons in ghrelin −/− mice was significantly increased, such that ghrelin −/− mice lost almost 50% more TH neurons than wt mice (Fig. 2 K). To determine whether this loss of TH-immunolabeled neurons correlated with altered DA levels, we measured DA content in the dorsal striatum. Ghrelin −/− mice challenged with MPTP exhibited a significantly greater reduction in striatal dopamine and DOPAC content than wt mice treated with MPTP (Fig. 2 L,M), and DOPAC/dopamine ratios were also significantly increased in ghrelin −/− mice treated with MPTP. There was no difference in dopamine content between wt and ghrelin −/− mice injected with saline.
Next we analyzed whether GHSRs mediate this effect of ghrelin. This approach used ghsr −/− mice generated by inserting a loxP-flanked transcription-blocking cassette into the endogenous GHSR allele (Zigman et al., 2005). When exposed to promoter-specific Cre recombinase, the GHSR expression is established in a neuronal phenotype of choice. We used mice that express GHSR selectively in TH neurons, including those in the SNpc and VTA (designated GHSR homo/TG) (Fig. 3 A–C) as well as ghsr −/− mice (designated homo/wt, i.e., without cre recombinase reactivation) and controls (designated w/w). Mice were injected with MPTP or saline and TH neurons in the SNpc were counted. While MPTP significantly reduced TH neurons in SNpc of w/w mice (Fig. 3 H), it produced a significantly greater loss of TH neurons in the SNpc in GHSR homo/wt mice (Fig. 3 H). However, mice with GHSR reactivation in TH neurons exhibited restricted MPTP TH cell loss similar to that seen in w/w MPTP-treated mice (Fig. 3 H). Together, these data indicate that ghrelin and ghrelin signaling directly in TH neurons through the GHSR are important to mediate ghrelin's neuroprotective properties in the SNpc.
Ghrelin-induced mitochondrial adaptation in the SN is UCP2 dependent
We showed that ghrelin promotes mitochondrial respiration and proliferation via activation of the AMPK–CPT1–UCP2 pathway (Andrews et al., 2008) that promotes fatty acid β-oxidation. Interestingly, UCP2 was previously shown to be neuroprotective against MPTP-induced nigral dopamine cell loss (Andrews et al., 2005b; Conti et al., 2005). Hence, we tested whether ghrelin enhances mitochondrial respiration and biogenesis in a UCP2-dependent manner.
First we revealed that GHSR-containing neurons in the SNpc also express UCP2 (Fig. 3 I–K). Next, we isolated mitochondria from the midbrain of wt and ucp2 −/− mice treated with ghrelin for 3 h (10 nmol, i.p.) or saline and measured mitochondrial respiration. Ghrelin-treated wt mice exhibited significantly greater basal uncoupled respiration after oligomycin blocked electron transport through the ATP synthase (Fig. 3 L), whereas ghrelin did not increase respiration after oligomycin in ucp2−/− mice (Fig. 3 L). Activation of UCP2 with the fatty acid palmitate (Echtay et al., 2002) resulted in a significant increase in mitochondrial respiration in ghrelin-treated wt but not in ucp2−/− mice (Fig. 3 M). Finally, FCCP driven respiration, which measures the total respiratory capacity, was also increased in ghrelin-treated wt but not in ucp2 −/− mice (Fig. 3 N). These results demonstrate that ghrelin regulates UCP2-dependent mitochondrial respiration in the SN. As we observed that ghrelin increased mitochondrial number in SNpc TH neurons (see above) and UCPs are important in promoting mitochondrial proliferation in response to increased uncoupled respiration in many tissues including the brain (Diano et al., 2003; Andrews et al., 2008) and muscle (Wu et al., 1999), we tested whether ghrelin produces a UCP2-dependent increase in mitochondrial number in the SNpc DA neurons. Three hours after ghrelin injection, wt mice exhibited increased mitochondrial number (Fig. 3 O). However, ghrelin had no effect on mitochondrial number in ucp2−/− mice (Fig. 3 O). To further demonstrate the mitochondrial biogenic potential of ghrelin via UCP2, we measured NRF1 mRNA 3 h after ghrelin treatment relative to saline controls. In wt mice, ghrelin increased NRF1 mRNA relative to saline (wt saline 0.983 ± 0.09 vs wt ghrelin 2.240 ± 0.03, n = 6, p < 0.05) whereas ghrelin had no effect in ucp2−/− mice (ucp2−/− saline 0.929 ± 0.19 vs ucp2−/− ghrelin 1.120 ± 0.35, n = 6, p < 0.05). These results confirm that ghrelin-induced mitochondrial respiration and proliferation is dependent on UCP2 in the SNpc.
Ghrelin induces increased levels of long-chain fatty acyl CoAs in the SN
The effects of ghrelin in mitochondrial responses in the SN are in line with ghrelin-mediated fatty acid β oxidation recently unmasked in the hypothalamus (Andrews et al., 2008). We propose that under conditions of mild negative energy balance increased levels of ghrelin will activate mitochondrial respiration and contribute to enhance fatty acid oxidation in nigral neurons. To determine whether ghrelin affects the long-chain fatty acyl CoA pool in the midbrain, we examined long-chain fatty acyl CoA (LCFA) species in the SN using mass spectrometry analysis. Three hours after peripheral ghrelin injection, there was a significant increase in total LCFA in the midbrain compared with saline controls (saline 40.9 ± 0.3 vs ghrelin 52.0 ± 1.3 nmol of metabolite/g tissue, n = 5, p < 0.05). These results are consistent with the idea that as ghrelin promotes mitochondrial respiration, it also supports continued oxidation by supplying the SNpc with LCFA for ongoing fuel utilization (Horvath et al., 2009). The primary LCFAs in the midbrain were palmitic acyl CoA (C 16:0), stearic acyl CoA (C18:0), and oleic acyl CoA (C18:1) (Fig. 4 A).
Figure 4.
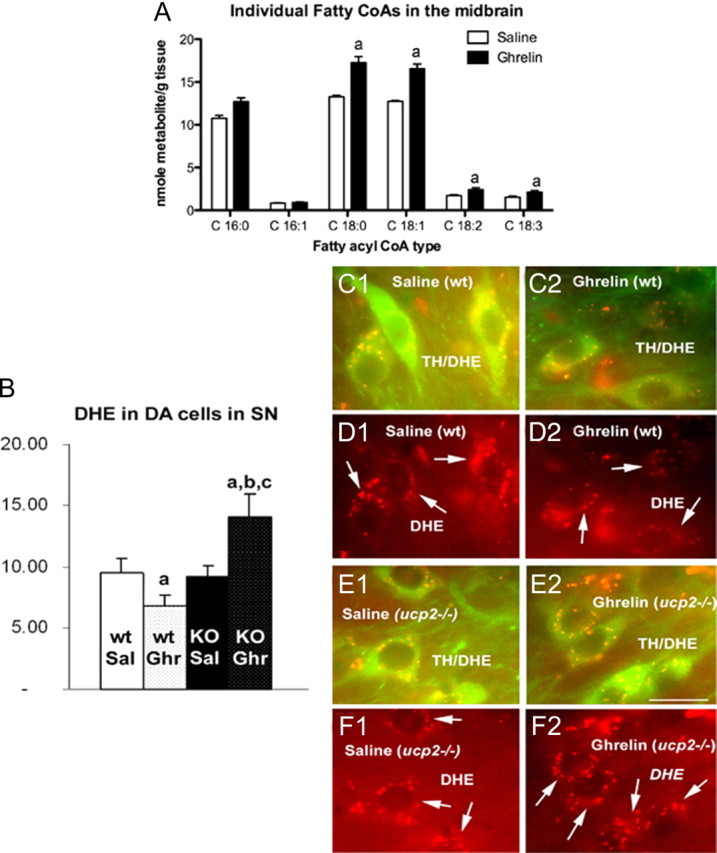
Ghrelin regulates long-chain fatty CoAs and ROS in the midbrain. A, Individual LCFA CoAs measured 3 h after ghrelin injection (10 nmol, i.p.). aSignificant with respect to saline controls. B, Quantification of ROS in TH neurons of the SNpc using dihydroethidium (DHE) shows that ghrelin reduces TH ROS production in UCP2 wt mice but robustly increases ROS in ucp2−/− mice. This suggests that the inability of ghrelin to enhance UCP2 in ucp2−/− mice prevents the buffering of increased ROS produced by increased fatty acid oxidation. Data are presented as the mean ± SEM. aSignificant with respect to saline wt controls; b,csignificant with respect to saline UCP2 wt and −/−, respectively (n = 5, p < 0.05). C1, C2, Representative images showing dual-channel ROS production (red) in TH neurons (green) of the SNpc in saline- and ghrelin-treated UCP2 wt mice. D1, D2, Representative images showing single-channel ROS production in saline- and ghrelin-treated UCP2 wt mice. E1, E2, Representative images showing dual-channel ROS production (red) in TH neurons (green) of the SNpc in saline- and ghrelin-treated ucp2−/− mice. F1, F2, Representative images showing single-channel ROS production in saline- and ghrelin-treated ucp2−/− mice. Data are presented as the mean ± SEM. Scale bar (in E2) C–F, 10 μm.
Ghrelin controls ROS in a UCP2-dependent manner in the SN
As UCP2 buffers and neutralizes ROS while promoting fatty acid oxidation (Andrews et al., 2008) and neuroprotection (Andrews et al., 2005a), we tested whether ghrelin treatment of wt and ucp2 −/− mice also affects ROS production in the midbrain. There was no difference in ROS production after saline or ghrelin injection in wt mice (Fig. 4 B). However, in ucp2 −/−mice, ghrelin produced a significant increase in ROS production relative to saline controls (Fig. 4 C,E,G). To examine how ghrelin affects ROS production in identified TH neurons in the SNpc, we injected dihydroethidium as it is oxidized by superoxide to red fluorescent ethidium. Injection of ghrelin lowers ROS production in nigral TH cells in UCP2 wt mice (Fig. 4 D–H) due to the activation of the UCP2 ROS buffering ability; however, ghrelin injection into ucp2−/− mice dramatically increases in vivo TH ROS levels in the SNpc.
UCP2 mediates ghrelin's protective effects on SN dopamine neurons
The data presented above suggest that UCP2 may play a role in mediating the neuroprotective effects of ghrelin on SNpc dopamine neurons. To test this, we administered ghrelin to wt and ucp2 −/− mice using the feeding paradigm described above. Total TH cell number in the SNpc was analyzed after the treatment ended. At baseline, sal/sal wt mice had ∼10288 ± 574 TH cells, and ghrelin treatment had no significant effect, as TH cell numbers were not significantly different (9568 ± 168 TH cells). MPTP significantly reduced TH cell numbers in both sal/MPTP and ghr/MPTP wt mice; however, ghrelin restricted this MPTP-induced loss (sal/MPTP 6059 ± 88 vs ghr/MPTP 7202 ± 254, n = 6, p < 0.05). In sal/sal and ghr/sal ucp2 −/− mice, there was no difference in total SNpc TH cell number (sal/sal 9082 ± 156 vs ghr/sal 9338 ± 388, n = 6). As expected, MPTP treatment produced a significant reduction in TH cell number; however, unlike in the ghr/MPTP wt mice, ghrelin did not attenuate the loss of TH neurons caused by MPTP in ucp2 −/− mice (sal/MPTP 5580 ± 195 vs ghr/MPTP 5734 ± 431), suggesting that ghrelin requires UCP2 to initiate compensatory neuroprotection through enhanced mitochondrial function and biogenesis.
Discussion
The present study shows that ghrelin promotes the electrical activity and dopamine output of the nigrostriatal DA system and that ghrelin has neuroprotective effects in a mouse model of PD. We suggest that the neuroprotective effects of ghrelin on the nigrostriatal dopamine system stem from two major effects of this metabolic hormone. First, ghrelin has an acute effect on the firing rate of SNpc DA neurons, which enhances dopamine availability during the course of degeneration and lowers the loss of dopamine levels in the dorsal striatum. Second, ghrelin-induced enhancement of UCP2-dependent mitochondrial respiration and proliferation provides a bioenergetic status that makes these neurons more resistant to cellular stress. UCP2 is a mitochondrial protein known to protect SNpc DA cells from MPTP intoxication (Andrews et al., 2005b). Ghrelin also regulates UCP2 mRNA in the brain (Andrews et al., 2008), consistent with the role of UCP2 as a component of ghrelin-induced neuroprotection.
Ghrelin −/− and ghsr −/− mice were more susceptible to DA cell loss in the SNpc and DA loss in the striatum after MPTP than their wt littermates. This suggests that any factor leading to reduced ghrelin production or secretion, whether genetic or environmental, may predispose individuals to nigrostriatal dopaminergic dysfunction. Obesity is one such physiological condition that lowers serum ghrelin (Tschöp et al., 2001) and this metabolic variation of ghrelin in humans may underlie an inherent predisposition to nigrostriatal dopaminergic dysfunction. This may have implications for PD, as currently 90% of PD is considered sporadic (Dauer and Przedborski, 2003) and epidemiological reports show that obesity, diabetes, and elevated body mass index predispose to future risk of PD. In contrast with obesity, ghrelin levels are increased during calorie restriction (Tschöp et al., 2000; Ariyasu et al., 2001), the only known experimental manipulation known to extend lifespan (Bordone and Guarente, 2005). Calorie restriction confers neuroprotection against MPTP intoxication (Guan et al., 1997; Maswood et al., 2004), suggesting that at least some of the beneficial effects of calorie restriction on neuroprotection may be mediated by ghrelin.
The effects of ghrelin on neuroprotection were dependent on metabolic state (redox level), as ghrelin had no protective effect when administered via osmotic minipumps during ad libitum feeding. Ghrelin only resulted in neuroprotection when it was administered during its physiological “window period.” This is consistent with the recently uncovered (by Andrews et al., 2008) cellular effects of ghrelin, in which activation of an AMPK–CPT1–UCP2 pathway promotes fatty acid β oxidation and neuronal function in the hypothalamus (supplemental Fig. 3, available at www.jneurosci.org as supplemental material). In the SNpc, we suggest that ad libitum feeding, specifically glucose from carbohydrate load, prevents the action of ghrelin on the AMPK–CPT1–UCP2 pathway and therefore does not allow for mitochondrial neuroprotective mechanisms to affect cell survivability. Consistent with this idea, brain glucose regulates malonyl-CoA and inhibits the AMPK–CPT1–UCP2 pathway (Wolfgang et al., 2007). Interestingly, this raises the intriguing and novel hypothesis that SNpc TH neurons are metabolic sensors of energy status. Dysfunction of this energy sensing ability may underlie how obesity affects nigrostriatal neurodegeneration. In our second model, removal of food at the time of ghrelin injection permits full activation of the AMPK–CPT1–UCP2 pathway, allowing increased mitochondrial respiration and biogenesis and subsequent neuroprotection (supplemental Fig. 3, available at www.jneurosci.org as supplemental material). This model allows for enhanced fatty acid β-oxidation, which may be the dominant fuel supply during negative energy balance. Ghrelin mobilizes fatty acid release into the circulation after 30 min (Andrews et al., 2008) and therefore can supply the brain with energy substrates for β-oxidation. The present study showing that ghrelin also increases LCFA CoA availability in the midbrain is consistent with this hypothesis. We propose that under conditions of negative energy balance, such as calorie restriction, ghrelin increases the neuronal fatty acid fuel supply to midbrain dopamine neurons, which results in sustained fatty acid β-oxidation and maintenance of cellular energy status of DA cells. In line with this, LCFAs, including oleic acid, are known to promote DA production in an immortalized cell line (Heller et al., 2005).
Fatty acid β-oxidation generates ROS, which is then buffered by activation of UCP2. In support of this, ucp2 −/− mice displayed increased midbrain ROS production in response to ghrelin compared with wt mice, as observed in the hypothalamus of ucp2−/− mice (Andrews et al., 2008). Further analysis of ROS production in TH neurons showed that ghrelin significantly lowers ROS in UCP2 wt mice but greatly enhances ROS in ucp2−/− mice. Finally, ghrelin treatment of ucp2 −/− mice did not attenuate SNpc TH cell loss after MPTP treatment as observed in wt controls. In this situation, the ghrelin-induced fatty-acid driven mitochondrial respiration and subsequent ROS production cannot be buffered or neutralized by UCP2, thus leading to dangerously high levels of ROS and promoting cell degeneration in response to MPTP. This is consistent with previous reports showing that UCP2 buffers ROS and protects nigral TH cells against MPTP-induced TH cell death (Andrews et al., 2005b; Conti et al., 2005).
Furthermore, ghrelin promotes UCP2 function in both the hypothalamus (Andrews et al., 2008) and the SNpc, suggesting that this is a common mechanistic phenomenon for the action of ghrelin. Indeed, UCP2 may play an important role in other regions of the brain where ghrelin promotes neuronal function, such as the hippocampus and the VTA (Abizaid et al., 2006; Diano et al., 2006).
Beyond the implications of our current study on neurodegeneration, our observations may have relevance for the regulation of food intake and depression. Ghrelin was originally found to stimulate appetite via the CNS (Tschöp et al., 2000), with sites of action in various areas, including the hypothalamus (Cowley et al., 2003) and the ventral tegmental DA system (Abizaid et al., 2006). Experimental evidence suggests that the nigrostriatal DA system is critically involved in the regulation of feeding (Szczypka et al., 2001; Hnasko et al., 2006). Moreover, a recent study showed that ghrelin defends against depression (Lutter et al., 2008), which is mediated by ghrelin's action on the midbrain dopaminergic system described herein and previously (Abizaid et al., 2006; Krishnan et al., 2007). PD is also associated with depression (Storch et al., 2008) and a decrease in appetite leading to weight loss (Bachmann and Trenkwalder, 2006), events that may be related to the lack of action by ghrelin in the SN and dorsal striatum of PD patients. Thus, ghrelin as a therapeutic treatment for PD may not only prevent TH cell degeneration but also promote food intake, weight gain, and anti-depressive symptoms.
Footnotes
This work was supported by a grant from the Michael J. Fox Foundation and National Institutes of Health (NIH) Grant DK-060711 to T.L.H., a New Zealand Foundation for Research, Science and Technology fellowship, Monash Fellowship, and National Health and Medical Research Council Grant 546131 to Z.B.A., and NIH Grant NS-056181 to J.D.E.
References
- Abbott RD, Ross GW, White LR, Nelson JS, Masaki KH, Tanner CM, Curb JD, Blanchette PL, Popper JS, Petrovitch H. Midlife adiposity and the future risk of Parkinson's disease. Neurology. 2002;59:1051–1057. doi: 10.1212/wnl.59.7.1051. [DOI] [PubMed] [Google Scholar]
- Abizaid A, Liu ZW, Andrews ZB, Shanabrough M, Borok E, Elsworth JD, Roth RH, Sleeman MW, Picciotto MR, Tschöp MH, Gao XB, Horvath TL. Ghrelin modulates the activity and synaptic input organization of midbrain dopamine neurons while promoting appetite. J Clin Invest. 2006;116:3229–3239. doi: 10.1172/JCI29867. [DOI] [PMC free article] [PubMed] [Google Scholar]
- Abou-Sleiman PM, Muqit MM, Wood NW. Expanding insights of mitochondrial dysfunction in Parkinson's disease. Nat Rev Neurosci. 2006;7:207–219. doi: 10.1038/nrn1868. [DOI] [PubMed] [Google Scholar]
- Andrews ZB, Diano S, Horvath TL. Mitochondrial uncoupling proteins in the CNS: in support of function and survival. Nat Rev Neurosci. 2005a;6:829–840. doi: 10.1038/nrn1767. [DOI] [PubMed] [Google Scholar]
- Andrews ZB, Horvath B, Barnstable CJ, Elsworth J, Yang L, Beal MF, Roth RH, Matthews RT, Horvath TL. Uncoupling protein-2 is critical for nigral dopamine cell survival in a mouse model of Parkinson's disease. J Neurosci. 2005b;25:184–191. doi: 10.1523/JNEUROSCI.4269-04.2005. Erratum (2005) 25(8):table of contents. [DOI] [PMC free article] [PubMed] [Google Scholar]
- Andrews ZB, Liu ZW, Walllingford N, Erion DM, Borok E, Friedman JM, Tschöp MH, Shanabrough M, Cline G, Shulman GI, Coppola A, Gao XB, Horvath TL, Diano S. UCP2 mediates ghrelin's action on NPY/AgRP neurons by lowering free radicals. Nature. 2008;454:846–851. doi: 10.1038/nature07181. [DOI] [PMC free article] [PubMed] [Google Scholar]
- Ariyasu H, Takaya K, Tagami T, Ogawa Y, Hosoda K, Akamizu T, Suda M, Koh T, Natsui K, Toyooka S, Shirakami G, Usui T, Shimatsu A, Doi K, Hosoda H, Kojima M, Kangawa K, Nakao K. Stomach is a major source of circulating ghrelin, and feeding state determines plasma ghrelin-like immunoreactivity levels in humans. J Clin Endocrinol Metab. 2001;86:4753–4758. doi: 10.1210/jcem.86.10.7885. [DOI] [PubMed] [Google Scholar]
- Bachmann CG, Trenkwalder C. Body weight in patients with Parkinson's disease. Mov Disord. 2006;21:1824–1830. doi: 10.1002/mds.21068. [DOI] [PubMed] [Google Scholar]
- Bordone L, Guarente L. Calorie restriction, SIRT1 and metabolism: understanding longevity. Nat Rev Mol Cell Biol. 2005;6:298–305. doi: 10.1038/nrm1616. [DOI] [PubMed] [Google Scholar]
- Choi JY, Jang EH, Park CS, Kang JH. Enhanced susceptibility to 1-methyl-4-phenyl-1,2,3,6-tetrahydropyridine neurotoxicity in high-fat diet-induced obesity. Free Radic Biol Med. 2005;38:806–816. doi: 10.1016/j.freeradbiomed.2004.12.008. [DOI] [PubMed] [Google Scholar]
- Chung H, Kim E, Lee DH, Seo S, Ju S, Lee D, Kim H, Park S. Ghrelin inhibits apoptosis in hypothalamic neuronal cells during oxygen-glucose deprivation. Endocrinology. 2007;148:148–159. doi: 10.1210/en.2006-0991. [DOI] [PubMed] [Google Scholar]
- Conti B, Sugama S, Lucero J, Winsky-Sommerer R, Wirz SA, Maher P, Andrews Z, Barr AM, Morale MC, Paneda C, Pemberton J, Gaidarova S, Behrens MM, Beal F, Sanna PP, Horvath T, Bartfai T. Uncoupling protein 2 protects dopaminergic neurons from acute 1,2,3,6-methyl-phenyl-tetrahydropyridine toxicity. J Neurochem. 2005;93:493–501. doi: 10.1111/j.1471-4159.2005.03052.x. [DOI] [PubMed] [Google Scholar]
- Cowley MA, Smith RG, Diano S, Tschöp M, Pronchuk N, Grove KL, Strasburger CJ, Bidlingmaier M, Esterman M, Heiman ML, Garcia-Segura LM, Nillni EA, Mendez P, Low MJ, Sotonyi P, Friedman JM, Liu H, Pinto S, Colmers WF, Cone RD, et al. The distribution and mechanism of action of ghrelin in the CNS demonstrates a novel hypothalamic circuit regulating energy homeostasis. Neuron. 2003;37:649–661. doi: 10.1016/s0896-6273(03)00063-1. [DOI] [PubMed] [Google Scholar]
- Dauer W, Przedborski S. Parkinson's disease: mechanisms and models. Neuron. 2003;39:889–909. doi: 10.1016/s0896-6273(03)00568-3. [DOI] [PubMed] [Google Scholar]
- Dhar SS, Ongwijitwat S, Wong-Riley MT. Nuclear respiratory factor 1 regulates all ten nuclear-encoded subunits of cytochrome c oxidase in neurons. J Biol Chem. 2008;283:3120–3129. doi: 10.1074/jbc.M707587200. [DOI] [PMC free article] [PubMed] [Google Scholar]
- Diano S, Matthews RT, Patrylo P, Yang L, Beal MF, Barnstable CJ, Horvath TL. Uncoupling protein 2 prevents neuronal death including that occurring during seizures: a mechanism for preconditioning. Endocrinology. 2003;144:5014–5021. doi: 10.1210/en.2003-0667. [DOI] [PubMed] [Google Scholar]
- Diano S, Farr SA, Benoit SC, McNay EC, da Silva I, Horvath B, Gaskin FS, Nonaka N, Jaeger LB, Banks WA, Morley JE, Pinto S, Sherwin RS, Xu L, Yamada KA, Sleeman MW, Tschöp MH, Horvath TL. Ghrelin controls hippocampal spine synapse density and memory performance. Nat Neurosci. 2006;9:381–388. doi: 10.1038/nn1656. [DOI] [PubMed] [Google Scholar]
- Dong J, Song N, Xie J, Jiang H. Ghrelin antagonized 1-methyl-4-phenylpyridinium (MPP(+))-induced apoptosis in MES23.5 cells. J Mol Neurosci. 2009;37:182–189. doi: 10.1007/s12031-008-9162-7. [DOI] [PubMed] [Google Scholar]
- Duan W, Mattson MP. Dietary restriction and 2-deoxyglucose administration improve behavioral outcome and reduce degeneration of dopaminergic neurons in models of Parkinson's disease. J Neurosci Res. 1999;57:195–206. doi: 10.1002/(SICI)1097-4547(19990715)57:2<195::AID-JNR5>3.0.CO;2-P. [DOI] [PubMed] [Google Scholar]
- Echtay KS, Roussel D, St-Pierre J, Jekabsons MB, Cadenas S, Stuart JA, Harper JA, Roebuck SJ, Morrison A, Pickering S, Clapham JC, Brand MD. Superoxide activates mitochondrial uncoupling proteins. Nature. 2002;415:96–99. doi: 10.1038/415096a. [DOI] [PubMed] [Google Scholar]
- Guan XM, Yu H, Palyha OC, McKee KK, Feighner SD, Sirinathsinghji DJ, Smith RG, Van der Ploeg LH, Howard AD. Distribution of mRNA encoding the growth hormone secretagogue receptor in brain and peripheral tissues. Brain Res Mol Brain Res. 1997;48:23–29. doi: 10.1016/s0169-328x(97)00071-5. [DOI] [PubMed] [Google Scholar]
- Heller A, Won L, Bubula N, Hessefort S, Kurutz JW, Reddy GA, Gross M. Long-chain fatty acids increase cellular dopamine in an immortalized cell line (MN9D) derived from mouse mesencephalon. Neurosci Lett. 2005;376:35–39. doi: 10.1016/j.neulet.2004.11.021. [DOI] [PubMed] [Google Scholar]
- Hnasko TS, Perez FA, Scouras AD, Stoll EA, Gale SD, Luquet S, Phillips PE, Kremer EJ, Palmiter RD. Cre recombinase-mediated restoration of nigrostriatal dopamine in dopamine-deficient mice reverses hypophagia and bradykinesia. Proc Natl Acad Sci U S A. 2006;103:8858–8863. doi: 10.1073/pnas.0603081103. [DOI] [PMC free article] [PubMed] [Google Scholar]
- Horvath TL, Andrews ZB, Diano S. Fuel utilization by hypothalamic neurons: roles for ROS. Trends Endocrinol Metab. 2009;20:78–87. doi: 10.1016/j.tem.2008.10.003. [DOI] [PubMed] [Google Scholar]
- Hu G, Jousilahti P, Nissinen A, Antikainen R, Kivipelto M, Tuomilehto J. Body mass index and the risk of Parkinson disease. Neurology. 2006;67:1955–1959. doi: 10.1212/01.wnl.0000247052.18422.e5. [DOI] [PubMed] [Google Scholar]
- Hu G, Jousilahti P, Bidel S, Antikainen R, Tuomilehto J. Type 2 diabetes and the risk of Parkinson's disease. Diabetes Care. 2007;30:842–847. doi: 10.2337/dc06-2011. [DOI] [PubMed] [Google Scholar]
- Jerlhag E, Egecioglu E, Dickson SL, Andersson M, Svensson L, Engel JA. Ghrelin stimulates locomotor activity and accumbal dopamine-overflow via central cholinergic systems in mice: implications for its involvement in brain reward. Addict Biol. 2006;11:45–54. doi: 10.1111/j.1369-1600.2006.00002.x. [DOI] [PubMed] [Google Scholar]
- Jerlhag E, Egecioglu E, Dickson SL, Douhan A, Svensson L, Engel JA. Ghrelin administration into tegmental areas stimulates locomotor activity and increases extracellular concentration of dopamine in the nucleus accumbens. Addict Biol. 2007;12:6–16. doi: 10.1111/j.1369-1600.2006.00041.x. [DOI] [PubMed] [Google Scholar]
- Jiang H, Li LJ, Wang J, Xie JX. Ghrelin antagonizes MPTP-induced neurotoxicity to the dopaminergic neurons in mouse substantia nigra. Exp Neurol. 2008;212:532–537. doi: 10.1016/j.expneurol.2008.05.006. [DOI] [PubMed] [Google Scholar]
- Johnson SW, North RA. Opioids excite dopamine neurons by hyperpolarization of local interneurons. J Neurosci. 1992;12:483–488. doi: 10.1523/JNEUROSCI.12-02-00483.1992. [DOI] [PMC free article] [PubMed] [Google Scholar]
- Krishnan V, Han MH, Graham DL, Berton O, Renthal W, Russo SJ, Laplant Q, Graham A, Lutter M, Lagace DC, Ghose S, Reister R, Tannous P, Green TA, Neve RL, Chakravarty S, Kumar A, Eisch AJ, Self DW, Lee FS, Tamminga CA, Cooper DC, Gershenfeld HK, Nestler EJ. Molecular adaptations underlying susceptibility and resistance to social defeat in brain reward regions. Cell. 2007;131:391–404. doi: 10.1016/j.cell.2007.09.018. [DOI] [PubMed] [Google Scholar]
- López-Lluch G, Hunt N, Jones B, Zhu M, Jamieson H, Hilmer S, Cascajo MV, Allard J, Ingram DK, Navas P, de Cabo R. Calorie restriction induces mitochondrial biogenesis and bioenergetic efficiency. Proc Natl Acad Sci U S A. 2006;103:1768–1773. doi: 10.1073/pnas.0510452103. [DOI] [PMC free article] [PubMed] [Google Scholar]
- Lutter M, Sakata I, Osborne-Lawrence S, Rovinsky SA, Anderson JG, Jung S, Birnbaum S, Yanagisawa M, Elmquist JK, Nestler EJ, Zigman JM. The orexigenic hormone ghrelin defends against depressive symptoms of chronic stress. Nat Neurosci. 2008;11:752–753. doi: 10.1038/nn.2139. [DOI] [PMC free article] [PubMed] [Google Scholar]
- Maswood N, Young J, Tilmont E, Zhang Z, Gash DM, Gerhardt GA, Grondin R, Roth GS, Mattison J, Lane MA, Carson RE, Cohen RM, Mouton PR, Quigley C, Mattson MP, Ingram DK. Caloric restriction increases neurotrophic factor levels and attenuates neurochemical and behavioral deficits in a primate model of Parkinson's disease. Proc Natl Acad Sci U S A. 2004;101:18171–18176. doi: 10.1073/pnas.0405831102. [DOI] [PMC free article] [PubMed] [Google Scholar]
- Olshansky SJ, Passaro DJ, Hershow RC, Layden J, Carnes BA, Brody J, Hayflick L, Butler RN, Allison DB, Ludwig DS. A potential decline in life expectancy in the United States in the 21st century. N Engl J Med. 2005;352:1138–1145. doi: 10.1056/NEJMsr043743. [DOI] [PubMed] [Google Scholar]
- Savitt JM, Jang SS, Mu W, Dawson VL, Dawson TM. Bcl-x is required for proper development of the mouse substantia nigra. J Neurosci. 2005;25:6721–6728. doi: 10.1523/JNEUROSCI.0760-05.2005. [DOI] [PMC free article] [PubMed] [Google Scholar]
- Storch A, Ebersbach G, Fuchs G, Jost WH, Odin P, Reifschneider G, Bauer M. [Depression in Parkinson's disease. Part 1: epidemiology, signs and symptoms, pathophysiology and diagnosis] Fortschr Neurol Psychiatr. 2008;76:715–724. doi: 10.1055/s-2008-1038293. [DOI] [PubMed] [Google Scholar]
- Szczypka MS, Kwok K, Brot MD, Marck BT, Matsumoto AM, Donahue BA, Palmiter RD. Dopamine production in the caudate putamen restores feeding in dopamine-deficient mice. Neuron. 2001;30:819–828. doi: 10.1016/s0896-6273(01)00319-1. [DOI] [PubMed] [Google Scholar]
- Tschöp M, Smiley DL, Heiman ML. Ghrelin induces adiposity in rodents. Nature. 2000;407:908–913. doi: 10.1038/35038090. [DOI] [PubMed] [Google Scholar]
- Tschöp M, Weyer C, Tataranni PA, Devanarayan V, Ravussin E, Heiman ML. Circulating ghrelin levels are decreased in human obesity. Diabetes. 2001;50:707–709. doi: 10.2337/diabetes.50.4.707. [DOI] [PubMed] [Google Scholar]
- Wolfgang MJ, Cha SH, Sidhaye A, Chohnan S, Cline G, Shulman GI, Lane MD. Regulation of hypothalamic malonyl-CoA by central glucose and leptin. Proc Natl Acad Sci U S A. 2007;104:19285–19290. doi: 10.1073/pnas.0709778104. [DOI] [PMC free article] [PubMed] [Google Scholar]
- Wortley KE, Anderson KD, Garcia K, Murray JD, Malinova L, Liu R, Moncrieffe M, Thabet K, Cox HJ, Yancopoulos GD, Wiegand SJ, Sleeman MW. Genetic deletion of ghrelin does not decrease food intake but influences metabolic fuel preference. Proc Natl Acad Sci U S A. 2004;101:8227–8232. doi: 10.1073/pnas.0402763101. [DOI] [PMC free article] [PubMed] [Google Scholar]
- Wu Z, Puigserver P, Andersson U, Zhang C, Adelmant G, Mootha V, Troy A, Cinti S, Lowell B, Scarpulla RC, Spiegelman BM. Mechanisms controlling mitochondrial biogenesis and respiration through the thermogenic coactivator PGC-1. Cell. 1999;98:115–124. doi: 10.1016/S0092-8674(00)80611-X. [DOI] [PubMed] [Google Scholar]
- Zigman JM, Nakano Y, Coppari R, Balthasar N, Marcus JN, Lee CE, Jones JE, Deysher AE, Waxman AR, White RD, Williams TD, Lachey JL, Seeley RJ, Lowell BB, Elmquist JK. Mice lacking ghrelin receptors resist the development of diet-induced obesity. J Clin Invest. 2005;115:3564–3572. doi: 10.1172/JCI26002. [DOI] [PMC free article] [PubMed] [Google Scholar]
- Zigman JM, Jones JE, Lee CE, Saper CB, Elmquist JK. Expression of ghrelin receptor mRNA in the rat and the mouse brain. J Comp Neurol. 2006;494:528–548. doi: 10.1002/cne.20823. [DOI] [PMC free article] [PubMed] [Google Scholar]