Abstract
Human leukocytes retract pseudopods under normal physiologic levels of fluid shear stress even in the absence of any other mediator. To gain more detailed understanding of the mechanisms that regulate this cell behavior, we exposed leukocytes to a steady state laminar shear field in a flow chamber and computed the fluid stresses distribution on the surface of individual cells with and without pseudopod. The surface fluid stress distribution on such cell is quite inhomogeneous. We hypothesized that the local fluid stresses on the cell surface serve to regulate pseudopod retraction by way of membrane receptors, especially the formyl peptide receptor (FPR). Comparison of the receptor distribution and the stress distribution over the surface of the cells indicates that the membrane fluid stress alone is not directly correlated with the extent of regional pseudopod retraction, giving further support to the hypothesis that membrane receptors are involved in the mechanotransduction of leukocytes. We observed that after exposure to fluid shear the FPR was internalized to a small intracellular compartment. This internalization appears to be independent of the original location of the receptor on the surface of the cell and the FPR appears to be more derived from multiple locations on the cell, with both higher and lower fluid stresses. The evidence suggests that FPR involvement in the pseudopod-retraction process is not limited to cell surface regions with the highest fluid shear stress, but rather a more global occurrence over the majority of the cell membrane.
Keywords: Leukocyte, Shear stress, Pseudopod, Formyl peptide receptor
Introduction
Recent evidence suggests that besides leukocyte activation in the circulation mediated by membrane receptors that are stimulated by humoral chemotactic factors, leukocyte activation and deactivation may also be regulated by mechanical fluid stresses.1,8 But the mechanisms by which leukocytes sense fluid stresses are not well understood. The stress distribution on the surface of a leukocyte is complex and highly dependent on the fine geometric shape of the membrane.10 While the maximum shear stress at the top of an adherent cell increases as the cell retracts its pseudopod under fluid flow, pseudopod retraction occurs independently of the direction of shear.10 This observation leads us to hypothesize that besides the magnitude of fluid shear on the cell membrane, the distribution of membrane receptors, e.g. the formyl peptide receptor (FPR), may be responsible for the localized retraction of pseudopods.
In vitro experiments demonstrated that the FPR, a member of the GPCR with high constitutive activity, is a membrane mechanosensor that senses the mechanical fluid stress and signals intracellular cascades.6 Inhibition of the FPR with inverse agonists or knockdown of the receptor expression abolishes pseudopod retraction response to fluid shear in neutrophil-like differentiated HL60 cells (dHL60), while transfection and expression of the FPR in cells that do not normally express the receptor reconstitutes the shear stress response.6 This evidence suggests that GPCRs may act to modulate the unique fluid shear response observed in leukocytes. The specific location of these receptors may be associated with the different shear responses that have been observed. Fluid shear stress acting on the leukocyte membrane is quite non-uniform.10 But little is known about the distribution of these surface receptors during fluid shear application.
Here we devised a method to record the distribution of FPR in real-time while the leukocyte is subjected to physiological levels of fluid flow. We compute details of the fluid stress distribution on single leukocytes in a laminar flow field,10 and correlate regional fluid stresses and FPR distribution with cell shape during pseudopod retraction.
Materials and Methods
Stress Distribution and Instantaneous Membrane Radius Estimate
Human leukemic promyelocytic cells (HL60, American Type Culture Collection) were used for membrane fluid stress analysis. The methods were previously described.10 Briefly, cells were cultured in RPMI 1640 culture medium and differentiated. They were then labeled with membrane stain (PKH26, Sigma-Aldrich) and subjected to fluid flow in a flow chamber (2.2 dyn/cm2 wall shear stress). Transverse confocal images were recorded over the entire cell. The images were stacked to reconstruct its 3-dimensional (3D) geometry (Fig. 1), and used as the basis for numerical computation of the surface fluid stresses using finite element method based on the low Reynolds number Stokes approximation of the equation of motion for a Newtonian fluid (culture medium), as described.10 The spatial resolution of images recorded in this fashion gives a description of the overall shape of the cell but is insufficient to record the detailed membrane folds on leukocytes (see “Discussion”).
Figure 1.
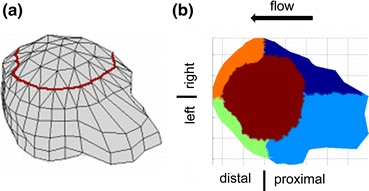
(a) A 3-D reconstruction of a cell where red line delineates the top region of the cell. (b) The cell surface is divided into 5 regions, shown in different colors, for the analysis of cell morphological changes as a response to a steady laminar flow
To determine the membrane stress distribution and pseudopod length, a geometric centroid in the cell was computed. Specifically, the centroid of each 2D section was calculated and then averaged over all sections, which determines the x and y positions of the 3D centroid. The height of the centroid from the bottom image was selected to be half of the maximum height of the cell at the initial time point (onset of flow). The computed centroids for the cell at subsequent time points were manually shifted in three directions to match the centroid of the same cell at the onset of flow. The cell surface was divided into five regions (Fig. 1): right proximal, left proximal, left distal, right distal, and top. The left and right directions are selected to be parallel to the flow direction. The top region of the cell was selected to be the membrane portion that extends above a distance of 6 μm from the cell’s glass contact surface. The average values for shear stresses, normal stresses, resultant stresses, and distance of the cell membrane from the centroid (radius, which serves as a measure for the pseudopod length) were computed separately for each membrane region.
FPR Kinetics
Cell Culture
Human leukemic monocyte lymphoma cells stably transfected with FPR tagged with Green Fluorescent Protein (U937 FPR-GFP, generous gift from Dr. Eric Prossnitz, University of New Mexico Health Sciences Center, Albuquerque, NM) were cultured in RPMI40 media supplemented with 10% fetal bovine serum (FBS), 1% penicillin/streptomycin, and 1% G418 (Invivogen, San Diego, CA). GFP allows for real-time observations of the location of FPR molecules in the cell.
In Vitro Flow Chamber Experiments
The flow chamber set up was described previously.10 Briefly, U937 FPR-GFP cells were allowed to settle and migrate freely on sterilized glass coverslips (Fisherbrand, Fisher Scientific). A laminar flow at ~5 dyn/cm2 was applied by a syringe pump (Harvard Apparatus Compact Infusion Pump, model 975) for 10 min.
Three control experiments were performed. In the first control, cells were observed for the same amount of time without flow. In the second control experiment, the cells were allowed to settle onto a coverslip for 10 min, then fixed in 0.4% paraformaldehyde for 1 h, and finally sheared for 10 min. In the third control experiment, the cells were subjected to fluid shear with culture medium of the same wall shear stress for the same length of time.
GFP and FPR-Ab Colocalization Experiment
To show that GFP was tagged to FPR throughout the experiment and served as a valid indicator of the location of FPR, U937 FPR-GFP cells were labeled with a R-phycoerythrin-conjugated mouse anti-human antibody for FPR (BDPharmingen, San Jose, CA). The cells were allowed to adhere to the coverslip for ~10 min. No-shear control cells were then fixed on the coverslip with 1% paraformaldehyde for 1 h. They were permeabilized with 0.1% Triton-X for 3–5 min and incubated in 1% bovine serum albumin (BSA) for 1 h. A final concentration of 1:250 PE-conjugated FPR antibody was added to the cells and incubated at 4 °C overnight. Cells were washed gently in PBS and immediately imaged under epifluorescence. For the sheared group, cells were allowed to adhere onto the coverslip for ~10 min. The coverslip was then assembled into the flow chamber and cells were sheared for 10 min at 5 dyn/cm2. The flow chamber was dissembled immediately following flow cessation and cells were fixed on the glass coverslip with 1% paraformaldehyde for 1 h. Cells were then permeabilized, incubated in BSA solution, labeled with antibodies, washed, and imaged.
Image Acquisition
Bright field images of the cells were captured with the Olympus U-CMAD3 camera coupled to a computer (digital scale from 0 to 255 between black and white, respectively). Images were taken at 1-min intervals for a total of 21 min (1 min of observation before starting flow, 10 min of flow at ~5 dyn/cm2, 10 min of observation after flow has stopped).
Epifluorescent images of the GFP signals were recorded at the onset of flow, 5 min into flow application, immediately after flow had been stopped. The focal plane was adjusted to allow for the clearest image of the mid-section of the cell of interest at each time point, with particular attention given to obtaining an image showing the GFP aggregate in the cell at its highest fluorescent intensity.
For the GFP and FPR-Ab colocalization experiments, cells on the glass coverslip were identified in bright field. Green epifluorescence (GFP) was detected with the same set-up as mentioned, whereas red epifluorescence from the PE-tagged FPR antibodies was recorded using a rhodamine filter (excitation wavelength: 535 nm, emission: 580 nm).
Analysis of Cell Shape and FPR Distribution
To analyze the morphological response to laminar fluid flow a roundness index for each cell was computed for the three controls and the experimental conditions described above (in each case a minimum of n = 3 cell images taken from a minimum of 2 different days). The roundness index is defined as  where P is the perimeter of the projected area of the cell and A the enclosed area. Using bright field images for each 1-min interval, the projected area of the cell was manually traced (1 min before starting shear, 10 min of shear by Plasma-Lyte, 10 more minutes after flow stopped). The roundness index was calculated using Image-Pro Plus (v4.5, Media Cybernetics, Inc.) for each time point.
Fluorescence intensity in various parts of the cell was determined to detect FPR translocation during laminar fluid flow. The measurements (Fig. 2) were based on the assumptions that there was one GFP molecule for each FPR in the cell, that the intensity of the fluorescence was directly proportional to the number of GFP molecules in the cell, and that degradation occurs to the entire complex of FPR-GFP. The outline of the cell under fluorescence at each of the 3 aforementioned time points was manually traced on a computer from which the area of the cell, in terms of number of pixels (each pixel length = 0.28 μm), was obtained.
Figure 2.
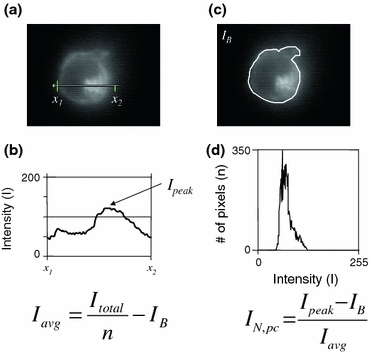
Methods for measurement of fluorescence intensities on single cells. (a, b) Line intensity profile across the perinuclear region of the cell to determine the peak intensity (I peak) within the cell cytoplasm. (c, d) Fluorescence intensity histogram over the cell cross-section. The average intensity in the cell (I avg) is determined by dividing the total intensity (I total) by the total number of pixels within the cell contour (n) and subtracting the background intensity (I B), while the normalized intensity of the perinuclear compartment (I N,pc) is calculated according to the expression on the right
A histogram of the intensities in the area of interest was used to find the number of pixels that were at each level of brightness. The total fluorescence intensity was obtained by adding up the intensity levels of all pixels in the cell. The average fluorescence intensity was obtained by dividing the total fluorescence intensity by the projected area of the cell.
Using an intensity profile along a user-specified line (Image-Pro Plus), the maximum intensity of the GFP aggregate inside the cell was obtained. The line intensity profile was normalized by the average intensity of the cell after subtracting the background fluorescence. Photobleaching effects and relatively small intensity differences in the background were eliminated by this process. The normalized maximum intensity within the cell was compared over the three measurement time points.
Fluorescence intensity values for the upstream (with the highest normal fluid stress) and downstream (with the lowest normal stress) regions of the cell membrane in the focal plane were made by manually outlining the membrane regions in the image (Fig. 3). The boundaries of the membrane regions were determined by visual inspection and contrast auto-detection with image processing software (Image-Pro Plus). The combined upstream and downstream average intensity (after background subtraction and normalization to the cell intensity) within the area of interest was obtained from images at the aforementioned three time points. To detect changes in fluorescence intensity in the cytoplasm, measurements were made within a smaller circular area (Fig. 3) of the cell.
Figure 3.
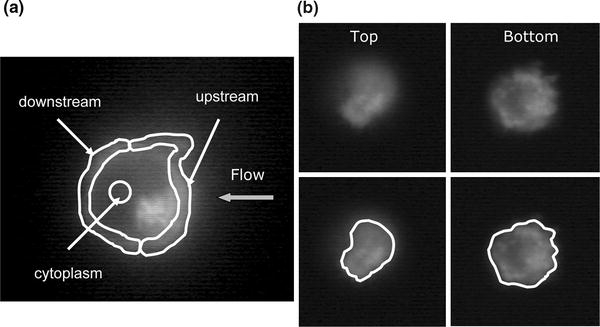
Definition of cell regions. (a) Fluorescent intensity in the mid-plane of the cell with display of downstream region, upstream region, and cytoplasm (center circle). (b) Fluorescent images of the top and bottom region of a cell and identification of cell contour
Fluorescence intensity measurements were also obtained on the top and bottom focal plane of the cell to explore a possible FPR redistribution in the membrane regions which are at different fluid stress magnitudes. Each focal plane was adjusted to obtain a focused membrane domain of the top and at the bottom substrate-contact regions of the cell (Fig. 3). The outlines of these planes were manually traced on a computer and the average intensity (after background subtraction) within the area of interest was obtained. Comparisons of these and the upstream/downstream region intensities were determined to identify shear-induced changes in GFP levels.
Statistics
FPR kinetic measurements are summarized in the form of mean ± standard error (SE). Comparisons between sheared and unsheared groups were made using the unpaired two-sample t-test, while comparisons in GFP fluorescence intensity measurements between time points were made using the paired two-sample t-test. p < 0.05 was considered to be statistically significant in both cases.
Results
Membrane Fluid Stress Distribution and Cell Shape Changes
By averaging normal, shear and resultant stresses over the surface of the cell, we obtained their average value for each cell at the beginning and the end of shear period. Even though the stress values on the cells were different, the shift in resultant stress on each individual cell was not significant over the shear period from the beginning to its end at 3 min (Fig. 4). The average resultant stress over the surface of the cell was relatively invariant with respect to the exact shape of the cell. In contrast, the average normal and shear stress components changed significantly during shear. The average shear stresses increased by about 25% and the normal stresses decreased close to 40% (Fig. 4). These opposing trends in the normal and shear stress components serve to keep the resultant stress on the cell surface at a constant.
Figure 4.
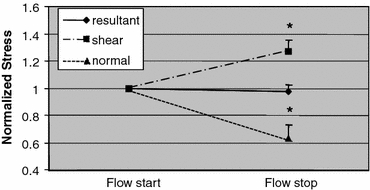
Average (resultant, shear and normal) stress on the cell membrane when the flow had just started and at the end of a 3 min fluid flow period. The stresses are normalized by the stress at the time point when flow was just started, before significant cell shape change. The cell-average resultant stress does not change during application of the fluid flow. The cell-average shear stress increases close to 30% between the same two time points while the cell-average normal stress decreases about 40%. n = 5 cells. Error bars = SE. * p < 0.05
We could detect only a weak correlation between the magnitude or the direction of pseudopod retraction and the magnitude of fluid stresses on the cell surface, i.e. surface regions experiencing the highest fluid stresses (resultant, shear, or normal) do not show the highest level of cytoplasmic retractions (Fig. 5). Collectively the proximal regions of the cell (dark and light blue points in Fig. 5) tend to show more retraction while the downstream distal regions (orange and green points in Fig. 5) show more pseudopod projection. In addition, we found that the mean normal stresses of the proximal regions do not increase or decrease after 3 min of flow even though these regions experience higher normal stresses when compared to the rest of the cell. Similarly, the top region of the cell does not experience a significant change in average shear stress although the top is exposed to higher fluid shear stresses.
Figure 5.
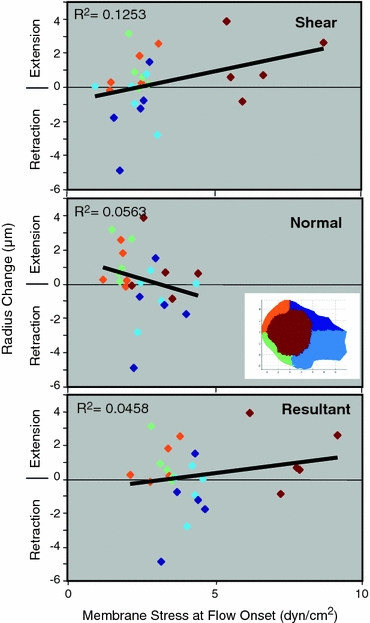
Correlation between cell radius change (measured from the centroid of the cell) and membrane stress at onset of fluid flow on five different regions of the cell surface. The color of the points correspond to the cell regions (see inset color code). A surface region with pseudopod projection and an average increase in radius after fluid shear falls in the “extension” zone. Similarly a surface region with an average decrease in radius after fluid shear falls within the “retraction” zone. Number of cells = 5. R 2: correlation coefficients
U937 Cell Pseudopod Retraction during Fluid Shear
All 40 cells of the Plasma-Lyte sheared group retracted their pseudopods during fluid shear. However, the extent of retraction differed among individual cells. Approximately 25% of the cells showed limited reduction in projected area. Due to the diverse cell responses to fluid shear, the following analysis was limited to the group of cells that showed clearly detectable and quick retraction under flow.
Three pilot experiments were carried out. In one experiment without fluid shear, the cells showed great variations in their projected areas throughout, and there were no observable changes in cell behavior. This suggested that, for the duration of this experiment, the amount of time that a cell was adhered to the glass coverslip was not a factor that influenced the cell behavior.
In another pilot experiment, cells were allowed to adhere to the coverslip, then fixed with 4% paraformaldehyde, and subsequently sheared. The projected area stayed constant and shear stress did not dislodge any cells from their original position on the coverslip.
In a third pilot experiment, cells were injected into a flow chamber filled with culture medium that contains 10% FBS. We observed that the cells were less adhered because of the serum proteins in the medium and the cells that adhered would retract pseudopods under fluid shear stress and continue to round up even after flow cessation. 11 out of the 15 cells rounded quickly and then their membranes deformed into a teardrop shape with a single attachment point to the coverslip. Under bright field observation the membrane in the upstream region of some of the cells had detached from the cell cytoskeleton (Fig. 6). When flow was stopped, a few cells recoiled immediately and stayed round throughout the remaining 10 min of observation. The remaining cells retracted from their membrane detachment in a slow and steady fashion over a few minutes.
Figure 6.
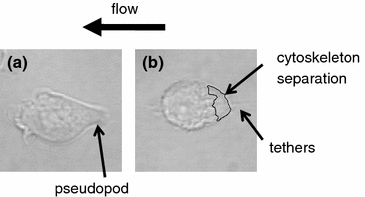
Bright field image of U937 cell (a) prior to and (b) after flow application. (a) Cell is initially attached to the glass slide by a pseudopod. (b) After 10 min of fluid flow in a flow chamber, cytoskeleton separation from the membrane can be seen in the upstream region. The cell appears to be firmly attached through fingerlike tethers
GFP Intensities Within the Cell and on the Cell Membrane
The FPR distribution was determined based on the fluorescence distribution of GFP in images taken before, during, and after application of fluid flow. GFP fluorescence colocalized with fluorescence from PE-tagged FPR-antibody, indicating that GFP did not get separated from FPR during the experiment (Fig. 7). This observation is in line with results reported in the literature showing colocalization in U937 cells between FPR-mRFP1 and fluorescent ligand.11 Without shear there is no detachment of the GFP from FPR in U937 FPR-GFP cells (Dr. E. Prossnitz, University of New Mexico, personal communication).
Figure 7.
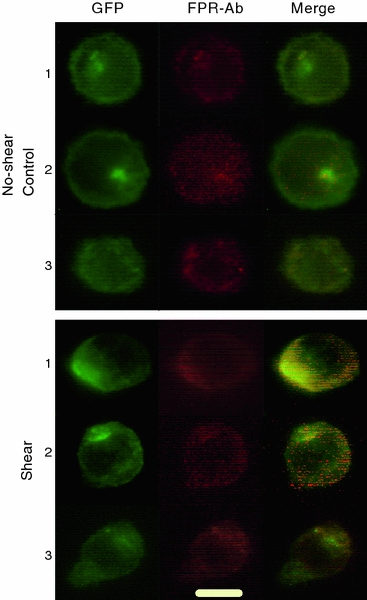
GFP and PE-conjugated FPR-Ab colocalization in FPR-GFP transfected U937 cells. Three separate examples of no-shear control (top) and sheared (bottom) FPR-GFP transfected U937 cells. GFP colocalizes with PE-conjugated FPR-specific antibody. Bar = 10 μm
In all cells during fluid shear a region within the cell cytoplasm increased in fluorescence intensity. This region is located adjacent but outside the nucleus, as seen by comparing bright field images with fluorescence images (Fig. 8). This region is likely a perinuclear recycling endosome that would be identified by labeling of Rab11, a small GTPase that recycles in such vesicular structures.2,3
Figure 8.

Left Bright field image showing the single-lobe nucleus of U937. Middle Epifluorescence image showing GFP aggregation in a compartment within the cell. Right Overlay of the two images showing that the compartment is located immediately outside the nucleus. Bar = 5 μm
The fluorescence intensities of different parts of the cell were measured at three pre-determined time points (flow onset, 5 min into shear, end of 10-min shear; Fig. 9). The cells subjected to shear by Plasma-Lyte showed an increase of ~30% in GFP intensity only in the perinuclear region, accompanied by a ~6% decrease of average fluorescence in the membrane. Cells from the no-shear group did not exhibit changes in GFP intensities in both the perinuclear region or in the membranes. No fluorescence intensity changes were observed in U937 cells of the second group (fixed by paraformaldehyde and then sheared), indicating that the action of fluid flow over the cell did not cause GFP intensity changes. When culture medium was used to shear the cells, a similar enhancement of GFP intensity was observed in the perinuclear region within the cytoplasm.
Figure 9.
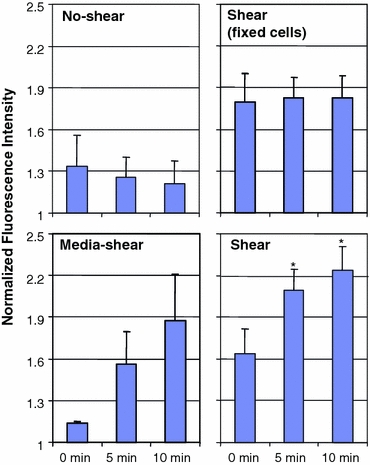
Normalized GFP intensity in perinuclear compartment. The fluorescent intensities are normalized with respect to the average cell intensity at the same time point after background subtraction. Top left U937 cells not exposed to fluid shear do not show significant changes in GFP intensity level in the perinuclear compartment (n = 3). Top right Fixed U937 cells exposed to shear by pH-balanced Plasma-Lyte exhibit a constant GFP intensity in the perinuclear compartment for the duration of the experiment (n = 3). Bottom left U937 cells exposed to shear by culturing medium showed marked increase (but not statistically significant) of GFP intensity (n = 3). Bottom right U937 cells subjected to shear of pH-balanced Plasma-Lyte shows statistically significant (* p < 0.05) increase in GFP fluorescence compared to the 0 min time point (n = 8). Error bars = standard error
The same method was used to measure the fluorescence intensities of the intracellular area (without the membrane or the perinuclear regions) and of the upstream and downstream membrane regions. Cells that were exposed to shear exhibited a significant decrease in GFP intensities in the cytoplasm as early as the 5-min time point (Fig. 10). The membrane region (obtained by combining the measurements for upstream and downstream regions) also showed a significant decrease of intensity after 10 min of shearing. We detected a fluorescence intensity reduction in both the top (9%) and bottom substrate-contact (11%) membrane regions of the cells, and they were significantly shifted between the initial and end time points.
Figure 10.
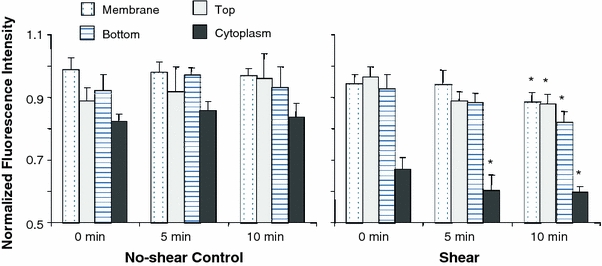
Normalized GFP fluorescence intensities in various parts of the cell. GFP fluorescence intensities of the regions of the sheared cells showed significant decreases after 10 min of flow application: membrane (n = 7, 6%), top (n = 6, 9%), bottom (n = 4, 11%), cytoplasm (n = 8, 11%). The fluorescence intensities in control cells (cytoplasm: n = 7; membrane: n = 7; top: n = 4; bottom: n = 4) do not show significant changes for the same time frame. Error bars = standard error. * p < 0.05 (shear group only) compared to intensity at 0 min
Discussion and Conclusions
The aims of this study were to examine the association between surface fluid stresses and cell morphological changes during spatial redistribution of the FPR. The evidence suggests, the cause–effect relationship between the two is not linear and may involve intermediate signaling mechanisms. The mean resultant stresses remain relatively unchanged throughout shear yet the cell shape and the FPR membrane intensities changed significantly. Interestingly, mean shear stresses increased while mean normal stresses decreased, thus leading to rather invariant mean resultant stresses on the cell surface. There is no direct correlation between the magnitudes of the stresses (resultant and its components) and the extent of pseudopod retraction in different regions of cell surface after shear.
These results support the hypothesis that leukocytes are not actively changing their shape to minimize the membrane fluid stress levels but rather as a result of the cleavage and/or internalization of a membrane molecule, such as the FPR. U937 FPR-GFP cells show that FPR molecules are removed from the cell membrane as a result of sustained laminar flow over the cells. Since the U937 FPR-GFP cells exhibited similar retraction behavior under fluid shear as seen in human neutrophils, the FPR response of these cells may support the hypothesis that human neutrophils also internalize FPR (as suggested by the increased GFP intensity in the perinuclear compartment) upon exposure to laminar fluid shear.
Membrane Fluid Stress Analysis
The morphological changes are unique to individual cells in spite of the fact that the mean resultant stresses over the cell membrane stayed constant from the start of fluid flow to the end. The cells shape changes during the flow do not appear to be associated with minimization of the surface fluid stresses. Furthermore, the individual surface regions do not show significant differences in the average fluid stresses from start of flow to the end. This observation suggests that human leukocytes’ active retraction under the fluid shear field in this study is a phenomenon that involves a major part of the cell and not just a confined regional response. Even though a cell adhered to a coverslip and exposed to 2.2 dyn/cm2 experiences a wide distribution of fluid shear stresses on its membrane surface, most of the cell membrane is subjected to a minimum of 0.5 dyn/cm2 of shear stress,10 a level that was shown to induce pseudopod retraction.7 If the cell response to flow is regulated by a threshold mechanism, then there is a major part of the cell surface area where the retraction mechanism can be switched “on.” The areas with less than the aforementioned threshold value form a ring close to the glass coverslip, and this in turn may provide shielding below a threshold shear stress for membrane sensors (e.g. membrane receptors) to remain in an “off” position.
To offer yet another perspective on how local pseudopod retraction results from a relatively constant membrane fluid stress distribution, it should be noted that leukocytes are covered with numerous membrane folds that vary greatly in shape but are typically 0.2 μm in height. When a leukocyte extends pseudopods away from the main cell body, the membrane folds on the pseudopods tend to get stretched out and disappear while the rest of the cell retains a folded membrane. Since membrane receptors are on a nanometer scale, the membrane folds may serve to shield receptors in some regions while exposing others to direct fluid shear. It is also possible that on a pseudopod with fewer membrane folds, many receptors are exposed to the direct forces of the flow field compared to the receptors located on the main cell body. In such a scenario, although the mean shear stresses in the top region of the cell is the highest, membrane folds may selectively shield flow-responsive membrane molecules from the high shear stresses by being located in the troughs between membrane folds.
Therefore the evidence suggests that membrane molecules do not respond uniformly to the applied surface fluid stresses since:
it requires a minimum stress level to trigger a response, such as a conformational change in the molecule (which can lead to internationalization or binding/unbinding with other messenger molecules) or receptor cleavage (either by fluid forces directly or in the presence of proteases, as seen e.g. in the case of CD189);
depending on the exact location of a membrane molecule, the local undulations in the membrane can either shield the molecules from fluid stresses or expose the molecules to fluid stresses that are much higher than the average shear stress for the same region on the cell surface.
FPR Analysis
FPRs cluster into lipid rafts on the cell membrane upon agonist binding and then get internalized.5,12 Based on such observations and our measurements, we hypothesize that the FPR’s role in mechanotransduction may be similar, i.e. we may see a redistribution of FPR on the cell surface followed by internalization. Our initial experiments showed that shearing the U937 FPR-GFP cells leads to an aggregation of GFP in a compartment next to the nucleus. In this cytoplasmic compartment the GFP fluorescent intensity consistently increased during fluid flow. The experimental time was too short for new GFP to be synthesized, suggesting that this increased GFP came from other parts of the cell. In line with previously published data,6 the membrane FPR appears to be internalized during fluid shear and the aggregation of GFP fluorescence simply reflects this process.
As a first step in evaluating the FPR internalization, we hypothesized that the receptors exposed to the highest magnitudes of fluid stresses would respond differently from those exposed to the lowest magnitudes of stresses. Therefore it would be interesting to look at the receptor distribution between membrane regions that experience widely different stresses. From previous computations on differentiated HL60 cells it could be seen that the largest differentials in fluid stress values on the surface of the cell were between the upstream and downstream regions and also between the top of the cell and the substrate-contact region. We chose to focus on these regions for the analysis on FPR redistribution under flow.
The upstream and downstream domains experience similar shear stresses but vary greatly in normal stresses. We initially hypothesized that receptors were activated by shear and internalized as a result, and our average membrane fluorescent intensity measurements supported this hypothesis. The small changes observed (6% decrease, Fig. 10), in contrast to the ~30% increase of the perinuclear compartment fluorescence intensity, may be due to the fact that receptor internalization occurred over most of the cell membrane, and is less detectable compared with the accumulation of the receptors in the perinuclear endosome.
Furthermore, we examined in particular the top and bottom membrane domains for GFP intensity changes since the disparity of stresses between these two regions on the cell is the largest. The top of the cell experiences surface stresses about 6 times that of the applied wall shear whereas the bottom experiences close to zero fluid stress.10 Evaluation of the intensities from fluorescence images showed that there was a minor reduction with respect to time, suggesting that FPR was being removed from those regions. Both the top and bottom regions experienced similar reductions of fluorescence, at 9% and 11%, respectively (Fig. 10). The decrease in the bottom region was more consistent from cell to cell. The larger variations in the fluorescence intensities of the top regions from cell to cell were most likely due to the fact that there is a high degree of curvature in the membrane, therefore the fluorescence from areas of the membrane near the focal plane are also recorded in the images.
The intracellular compartment where FPR aggregated is likely a Rab11-positive perinuclear recycling endosome.2, 3 Shear stresses may have initially activated the receptors even in the absence of chemoattractant and led to their internalization. However, in contrast to internalization caused by fMLP, shear appeared to have kept the receptors in the perinuclear compartment instead of allowing them to be recycled. This prolonged internalization of FPR supports the previous finding that G-protein activity was significantly decreased after fluid shear.6 Shear stress may prevent the FPR from returning to the membrane and therefore the constitutive activity that regulates pseudopod retraction and extension is downregulated. This may be accomplished through an arrestin-regulated pathway. Key et al. showed that stable ternary binding of FPR to active arrestins inhibits recycling of the receptor.3
The results here present a plausible explanation for previously observed divergent neutrophil shear responses in which Moazzam et al. 7,8 recorded pseudopod retraction while Coughlin et al. 1 observed pseudopod extension during application of fluid stress. We hypothesize that in the former experiments, FPRs concentrated at the tip of membrane folds or over the pseudopod where the membrane was more stretched out, thus allowing the mechanical shear to cause the FPRs to internalize. In the latter experiments, the majority of the FPRs were located in the substrate-contact region or in troughs between membrane folds and were shielded from the effects of shear and continue with the constitutive activities while FPR on the rest of the cell was exposed to direct or even increased shear. But the reasons for variations in FPR spatial distribution on individual unstimulated cells remain to be clarified.
Our results indicate that the fluid stress distributions on the cell do not have a simple correlation with the local cell behavior as seen by the shift in the cell shape. This observation suggests that membrane sensors are involved in the regulation of leukocyte fluid shear response. The analysis supports the hypothesis that FPR activity was reduced during flow application. There was a significant increase in intracellular FPR concentration accompanied by significant membrane and cytoplasmic FPR reduction, suggesting that fewer receptors were on the membrane to constitutively stimulate leukocyte pseudopod projection. But the membrane distributions of FPR before, during, and after fluid shear application were quite uniform. This may suggest that even though the top of the cell experienced the highest shear stresses, most of the cell surface was exposed to at least 0.5 dyn/cm2 of shear.10 In addition, the micro-protrusions that cover the entire cell surface serve to magnify the shear and normal stresses several-fold or provide shelter for membrane receptors such as FPR.10 It may be that only FPR on the tips of these membrane folds are internalized by fluid shear while FPR in the troughs between folds are shielded from fluid shear stresses and maintain constitutive activities under shear. Therefore even though we observed a global reduction of FPR from both low and high shear regions on the cell, this decrease may have resulted from only a fraction of FPRs that are located at the tips of membrane folds.
The question may be raised whether the response by leukocytes seen in these studies to fluid flow over the cell membrane may be caused by fluid stresses or by a transport phenomenon, e.g. introduction of fresh suspending medium or washout of a mediator. One way to address this issue is to examine in the same experimental setting shear stress at constant shear rate by adjustment of the suspending viscosity. Such experiments show that pseudopod retraction in suspended leukocytes scales with shear stress,4 suggesting that the actual force exerted by the fluid flow mediates the receptor signaling associated with fluid stress.
The results put forth in this study shed new light onto our understanding of the fluid shear response of leukocytes. While we observed a rather uniform FPR internalization that resulted from a non-uniform but steady membrane fluid stress distribution, such evidence suggested that the fluid shear response involves additional molecular players with non-linear kinetics to be explored in the future.
Acknowledgment
This work was supported by US Public Health Service Program Project Grant HL43026 and in part by HL 10881.
Open Access
This article is distributed under the terms of the Creative Commons Attribution Noncommercial License which permits any noncommercial use, distribution, and reproduction in any medium, provided the original author(s) and source are credited.
References
- 1.Coughlin MF, Schmid-Schönbein GW. Pseudopod projection and cell spreading of passive leukocytes in response to fluid shear stress. Biophys. J. 2004;87:2035–2042. doi: 10.1529/biophysj.104.042192. [DOI] [PMC free article] [PubMed] [Google Scholar]
- 2.Ernst S, Zobiack N, Boecker K, Gerke V, Rescher U. Agonist-induced trafficking of the low-affinity formyl peptide receptor FPRL1. Cell. Mol. Life Sci. 2004;61:1684–1692. doi: 10.1007/s00018-004-4116-x. [DOI] [PMC free article] [PubMed] [Google Scholar]
- 3.Key TA, Vines CM, Wagener BM, Gurevich VV, Sklar LA, Prossnitz ER. Inhibition of chemoattractant N-formyl peptide receptor trafficking by active arrestins. Traffic. 2005;6:87–99. doi: 10.1111/j.1600-0854.2004.00248.x. [DOI] [PubMed] [Google Scholar]
- 4.Komai Y, Schmid-Schönbein GW. De-activation of neutrophils in suspension by fluid shear stress: a requirement for erythrocytes. Ann. Biomed. Eng. 2005;33:1405–1416. doi: 10.1007/s10439-005-6768-6. [DOI] [PubMed] [Google Scholar]
- 5.Loitto VM, Rasmusson B, Magnusson KE. Assessment of neutrophil N-formyl peptide receptors by using antibodies and fluorescent peptides. J. Leukoc. Biol. 2001;69:762–771. [PubMed] [Google Scholar]
- 6.Makino, A., E. R. Prossnitz, and G. W. Schmid-Schönbein. Control of neutrophil pseudopods by fluid shear: role of GPCR constitutive activity. Proceedings of 2005 BMES Annual Fall Meeting, Vol. 13, 2005.
- 7.Moazzam, F. The response of human neutrophils to fluid stress, Ph.D. Thesis, Department of Bioengineering, University of California, San Diego, La Jolla, CA, 1996.
- 8.Moazzam F, DeLano FA, Zweifach BW, Schmid-Schönbein GW. The leukocyte response to fluid stress. Proc. Natl Acad. Sci. USA. 1997;94:5338–5343. doi: 10.1073/pnas.94.10.5338. [DOI] [PMC free article] [PubMed] [Google Scholar]
- 9.Shin HY, Simon SI, Schmid-Schönbein GW. Fluid shear-induced activation and cleavage of CD18 during pseudopod retraction by human neutrophils. J. Cell. Physiol. 2008;214:528–536. doi: 10.1002/jcp.21235. [DOI] [PubMed] [Google Scholar]
- 10.Su S, Schmid-Schönbein GW. Fluid stresses on the membrane of migrating leukocytes. Ann. Biomed. Eng. 2008;36:298–307. doi: 10.1007/s10439-007-9406-7. [DOI] [PMC free article] [PubMed] [Google Scholar]
- 11.Vines CM, Revankar CM, Maestas DC, LaRusch LL, Cimino DF, Kohout TA, Lefkowitz RJ, Prossnitz ER. N-formyl peptide receptors internalize but do not recycle in the absence of arrestins. J. Biol. Chem. 2003;278:41581–41584. doi: 10.1074/jbc.C300291200. [DOI] [PubMed] [Google Scholar]
- 12.Xue M, Vines CM, Buranda T, Cimino DF, Bennett TA, Prossnitz ER. N-formyl peptide receptors cluster in an active raft-associated state prior to phosphorylation. J. Biol. Chem. 2004;279:45175–45184. doi: 10.1074/jbc.M407053200. [DOI] [PubMed] [Google Scholar]


