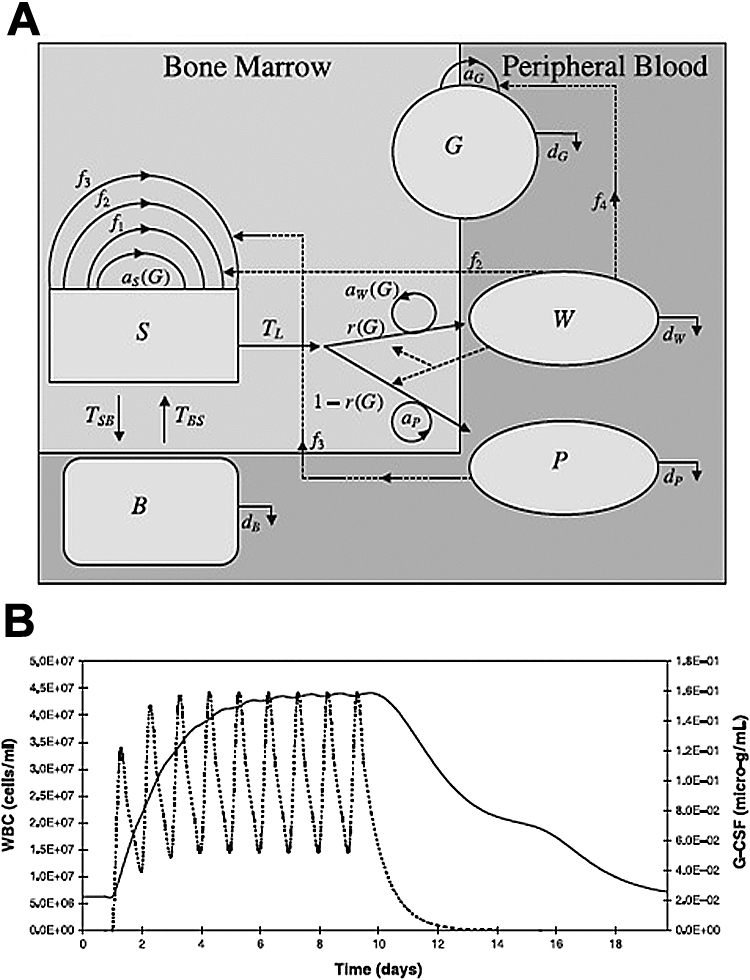
Figure 5.

Population dynamics model for G-CSF mobilized peripheral stem cells. (A) A compartment model for stem cell mobilization. This model describes the G-CSF concentration (G) in the microenvironment and 4 different populations of cells in the bone marrow and peripheral blood: stem cells (S), peripheral blood cells (B), white blood cells (W), and platelets (P). Other parameters that the model incorporates are as follows: aG, aP: the production rates of G-CSF and platelets. aS(G), aw(G): The production rates of stem cells and white blood cells as functions of G-CSF concentration. f1, f2, f3: Rates at which stem cells, white blood cells, and platelet concentrations down-regulate the stem cell production rate. f4: Rate at which white blood cell concentration down-regulates G-CSF production. dG, dB, dW, dP: The rates of destruction of G-CSF, peripheral blood progenitor cells, white blood cells, and platelets. TL: The population of progenitor cells in the bone marrow. TSB: The population of stem cells passing from the blood to the bone marrow. TBS: The population of stem cells passing from the bone marrow to the blood r(G). (B) Stimulation of G-CSF treatment every day over a 9-day period shows a rapid increase in white blood cell count (solid line) with each treatment (dotted line). After 5 days, further treatments have no effect on total white blood cell count. Once treatment has stopped (day 10), white blood cell counts slowly decline, returning to pretreatment levels. (Figure from Obeyesekere et al84 reprinted with permission from Wiley-Blackwell.)
