Abstract
IL-2 is expressed predominantly by activated T cells, and regulates T cell function by activating, via its receptor, the latent transcription factor STAT5. This signaling can occur in either a paracrine (between cells) or an autocrine (same cell) manner, although the kinetics by which these two signaling modes operate during in vivo T cell responses are unknown. In the current study, IL-2 expression and signaling in a clonotypic population of antiviral CD4+ T cells was analyzed by flow cytometry during the initial 24 h of priming. IL-2 expression and STAT5 activation peaked in parallel, but surprisingly, were almost completely mutually exclusive. Thus, only paracrine IL-2 signaling could be observed. As an additional indication of the efficiency of paracrine IL-2 signaling, polyclonal CD4+CD25+Foxp3+ regulatory T cells displayed detectable STAT5 activation under steady-state conditions, which was strongly enhanced by neighboring IL-2-expressing antiviral CD4 cells.
Before T lymphocytes can participate in adaptive immune responses such as neutralization of pathogens, clearance of tumors, or autoimmunity, they must first undergo clonal expansion and develop appropriate effector functions. This process involves the coordination of several signals, the first being a MHC-peptide complex presented by professional APC, which triggers the small population of T cells expressing TCRs with corresponding specificity (1). T cell activation also requires invariant costimulatory molecule and ligand pair interactions (2), the precise combinations of which influence the quality of the effector and memory T cell functions that develop (3).
In addition to Ag and costimulation, cytokines deliver a third category of signals that modulate T cell responses. Cytokines can be expressed by T cells themselves, or by other cells deriving from either hemopoietic or nonhemopoietic lineages, and mediate a variety of effects throughout the T cell life cycle including thymic development (4), homeostasis/survival in the periphery (5), the types of effector functions that develop following Ag-induced priming (6), and the development of memory (7).
IL-2 is a cytokine expressed predominantly by activated T cells, which, based on in vitro studies, was initially thought to be essential for T cell proliferation (8). Although the lymphoproliferative phenotype of IL-2-deficient mice subsequently indicated that IL-2 is not essential for T cell priming in vivo (9), IL-2 does influence certain aspects of Ag-driven T cell responses in vivo (10, 11) and is also important for CD4+CD25+ regulatory T cell homeostasis and function (12–14). IL-2 has generally been thought to regulate both the T cells that produce it (autocrine signaling) as well as neighboring T cells (paracrine signaling) (15). Nevertheless, the relative contribution of autocrine vs paracrine IL-2 signaling in regulating T cell responses in vivo has been relatively unexplored. It has been shown that virally primed CD8 cell expansion in nonlymphoid tissues can be dampened or enhanced by autocrine and paracrine IL-2 signaling, respectively (11), although questions such as understanding the kinetics by which these two IL-2 signaling modes operate in vivo as well as their relative contributions in regulating CD4 cell responses have not been addressed.
In the current study, we used ex vivo flow cytometry to examine the kinetics of IL-2 production and signaling in a population of naive clonotypic TCR-transgenic CD4 cells throughout the initial 24-h period following adoptive transfer into virally infected mice. Both IL-2 expression and the appearance of phosphorylated STAT5 (pSTAT5)3 (the downstream mediator of IL-2R activation (16)) peaked between 8 and 16 h. Strikingly, IL-2 production and STAT5 phosphorylation were almost completely mutually exclusive. Additionally, endogenous CD4+CD25+Foxp3+ regulatory T cells (Tregs) displayed measurable STAT5 phosphorylation under steady-state conditions, which increased substantially in response to neighboring IL-2-expressing antiviral clonotypic CD4 cells. Taken together, these data suggest that while paracrine IL-2 signaling between CD4 cells is quite efficient and can be maintained over several hours, autocrine signaling occurs at most only transiently.
Materials and Methods
Adoptive transfer and flow cytometry
Naive 6.5 TCR-transgenic clonotypic CD4 cells recognizing an I-Ed-restricted influenza hemagglutinin (HA) epitope (17) expressing the congenic Thy1.1 marker on the B10.D2 background were adoptively transferred into nontransgenic (NT) Thy1.2+ B10.D2 recipients that had been immunized with a recombinant vaccinia virus expressing HA (vacc-HA) as previously described (18). Splenocytes recovered at the indicated times were immediately fixed and permeabilized as previously described (19). In short, cells were fixed in formaldehyde (1.5% final concentration) for 15 min at room temperature, washed one time with PBS, resuspended in 100% MeOH while vortexing followed by 30 min incubation on ice. Cells were then washed three times with PBS + 0.5% BSA before staining with either of the following five or six color mAb combinations. Five color staining: anti-CD25 FITC (BD Biosciences), anti-IL-2 or -IFN-γ PE (eBioscience), anti-Thy1.1 PerCP (eBioscience), anti-STAT5a (pY694) Alexa Fluor 647 (BD Bioscience), and anti-CD4 allophycocyanin-Cy7 (BD Bioscience). Six-color staining: anti-IL-2 PE, anti-Thy1.1 PerCP, anti-CD25 PE-TX-RD (Caltag Laboratories), anti-CD4 Pacific Orange (Caltag Laboratories), anti-STAT5a (pY694) Alexa Fluor 647 and anti-Foxp3 Pacific Blue (eBioscience). Samples were analyzed on a LSR II flow cytometer (BD Biosciences), and all FACS plots shown are representative of at least three replicates.
In vitro T cell stimulation
Pooled lymph node cells from NT Thy1.1+ B10.D2 mice were stimulated in 24-well plates (1–2 × 10⁶/ml) that had been precoated with anti-CD3ε (eBioscience) in PBS at 25 μg/ml. After 16 h, cells were washed and incubated in fresh medium without anti-CD3ε for 1 h twice, then washed a third time and incubated in fresh medium for an additional 7 h. As indicated, cells were re-stimulated with soluble anti-CD3ε (10 ng/ml) plus a 4-fold excess of Thy1.2+ B10.D2 splenocytes or PMA (125 ng/ml; Sigma-Aldrich) plus ionomycin (2.5 μg/ml; Sigma-Aldrich) for 2 h, or IL-2 (50 ng/ml; NCI Biological Resources Branch) for 30 min.
Results and Discussion
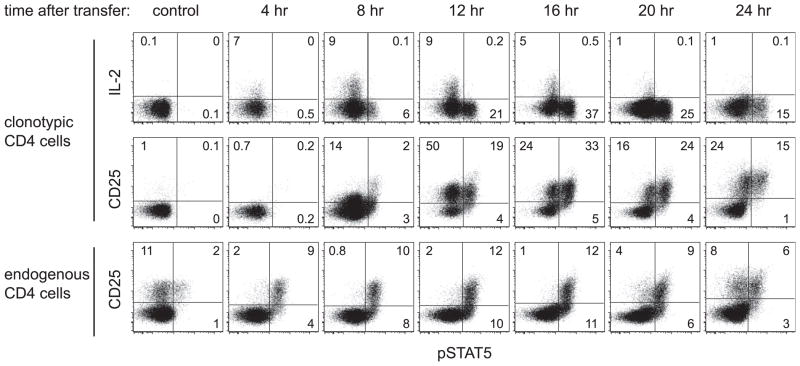
To examine the early kinetics of IL-2 production and signaling in a population of naive CD4 cells responding to viral challenge, naive HA-specific clonotypic TCR-transgenic CD4 cells were adoptively transferred into recipients that had been infected with a recombinant vaccinia virus that expresses HA (vacc-HA). At 4-h intervals, the clonotypic CD4 cells were recovered from spleens and immediately analyzed for expression of IL-2, the high-affinity IL-2R (CD25) and its downstream signaling mediator pSTAT5 (16) (Fig. 1). IL-2 expression was apparent at 4 h, and peaked between 8 and 16 h. During peak expression ~9% of the clonotypic CD4 cells stained positively for IL-2, which is likely an underestimate due to the lack of secretory inhibitor in the mouse (in vitro restimulation assays performed with and without brefeldin A suggest that this underestimate is ~3-fold, data not shown). CD25 expression appeared at 8 h, and peaked between 12 and 16 h when ~60–70% of the clonotypic CD4 cells were CD25+.
FIGURE 1.
Time course of early IL-2 expression and signaling in antiviral CD4 cells. Naive Thy1.1+ HA-specific clonotypic CD4 cells were adoptively transferred into vacc-HA-infected Thy1.2+ NT recipients, recovered from spleens at the indicated times and directly stained for IL-2, CD25, and pSTAT5. The percentages of positively expressing clonotypic cells (CD4+Thy1.1+) are indicated. CD25 vs pSTAT5 staining on endogenous (Thy1.1−) CD4 cells is also shown. Noninfected adoptive transfer recipients served as the control.
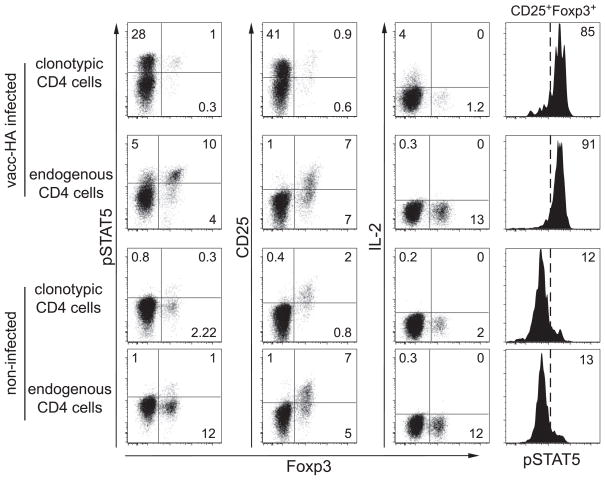
As expected, the appearance of clonotypic CD4 cells displaying elevated pSTAT5 generally correlated with IL-2 expression (although pSTAT5 lagged slightly), and most of these pSTAT5+ cells were also CD25+ (Fig. 1). Quite strikingly, however, throughout the 24-h time course, very few of the IL-2-expressing cells were pSTAT5+. This suggested that paracrine, rather than autocrine, IL-2 signaling was the predominant signaling mode. As an additional indication of paracrine IL-2 signaling, the endogenous CD25+ CD4 cells (i.e., most of which are Foxp3+ Tregs, Fig. 2) displayed elevated pSTAT5 that paralleled IL-2 expression by the transferred clonotypic CD4 cells (Figs. 1 and 2). Thus, in the absence of viral infection, ~10% of the endogenous Foxp3+ Tregs displayed elevated pSTAT5, as where ~90% became pSTAT5+ when the adoptively transferred clonotypic CD4 cells were expressing IL-2 (in contrast, only ~60% of the clonotypic cells became pSTAT5+, Figs. 1 and 2). Confirming that the virally induced increase in pSTAT5 in the endogenous Treg population was mediated mainly via the activated clonotypic CD4 cells, only a marginal increase in Treg pSTAT5 was observed in their absence (data not shown).
FIGURE 2.
Foxp3+ clonotypic and endogenous CD4 cells undergo paracrine IL-2 signaling. Clonotypic and endogenous CD4 cells recovered from vacc-HA-infected and noninfected recipients at 16 h were directly stained for Foxp3, IL-2, CD25, and pSTAT5.
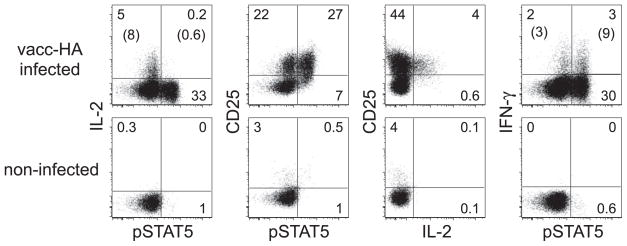
Ruling out that the scarcity of IL-2-expressing pSTAT5+ clonotypic CD4 cells was due to a lack of high-affinity IL-2R, IL-2 expression was predominantly observed in CD25+ cells (Fig. 3). Additionally, IFN-γ was expressed at an elevated frequency in pSTAT5+ clonotypic CD4 cells compared with counterparts displaying basal pSTAT5, arguing against the possibility that the lack of IL-2 expression in pSTAT5+ cells was the result of weak antigenic stimulation.
FIGURE 3.
IL-2, CD25, IFN-γ, and pSTAT5 expression on virally primed and nonprimed CD4 cells. Clonotypic CD4 cells recovered from vacc-HA-infected and noninfected recipients at 16 h were directly stained for IL-2, CD25, IFN-γ, and pSTAT5. Numbers in parentheses indicate the percentage of IL-2+ or IFN-γ+ clonotypic CD4 cells within the pSTAT5+ and pSTAT5− populations.
Soon after antigenic stimulation, T cells form transient but tight interactions with dendritic cells and might become difficult to extract from secondary lymphoid organs (20). Thus, the absence of IL-2-expressing pSTAT5+ clonotypic CD4 cells might have resulted from their inability to be recovered from spleens, and the IL-2-nonexpressing pSTAT5+ clonotypic cells might have represented an enriched population of clonotypic Tregs (which constitute a small fraction of the clonotypic CD4 cell population because the TCR-transgenic donors are RAG sufficient (21)) that would be unable to express (22) but capable of responding to IL-2. Thus, expression of the Treg lineage marker Foxp3 (23) was assessed along with IL-2, CD25, and pSTAT5 (Fig. 2). During the peak of IL-2 expression (16 h), Foxp3+ cells constituted ~1% of the total clonotypic CD4 cell population. As expected, none of these cells expressed IL-2, but the majority expressed CD25. Importantly, although most of the Foxp3+ clonotypic CD4 cells displayed elevated pSTAT5 (similar to the endogenous Foxp3+ cells), the vast majority of pSTAT5+ clonotypic CD4 cells were Foxp3−, indicating that the IL-2-nonexpressing pSTAT5+ clonotypic CD4 cells did not represent an enriched population of Tregs.
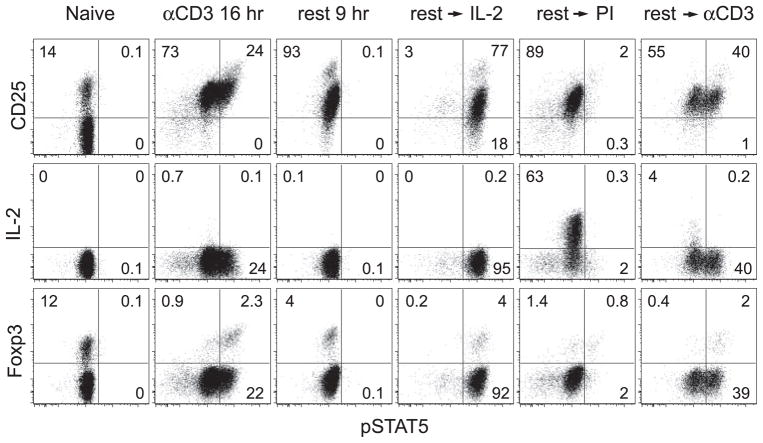
Because IL-2 expression was only detected in a small proportion of activated CD4 cells in the preceding experiments (presumably due to the lack of secretor inhibitor), we wished to more stringently assess the potential of CD4 cells to undergo autocrine IL-2 signaling by testing conditions in which IL-2 expression can be detected on a majority of cells. Thus, naive polyclonal CD4 cells from NT donors were activated in vitro with plate-bound anti-CD3 for 16 h to induce CD25, rested for 9 h to allow IL-2 expression and pSTAT5 to return to baseline, and subsequently stimulated with PMA plus ionomycin (PI) which elicits robust intracellular IL-2 expression even in the absence of secretory inhibitor (Fig. 4). Verifying that the rested CD4 cells expressed functional IL-2R, exogenous IL-2 elicited robust pSTAT5 elevation in almost all of the cells (phosphorylation was slightly lower in CD25− cells, presumably resulting from low-affinity IL-2R). PI induced IL-2 expression in ~60% of the rested CD4 cells, however, virtually none displayed elevated pSTAT5. In fact, there were few pSTAT5+IL-2− CD4 cells, perhaps because some cells expressed nondetectable IL-2 levels that were sufficient to preclude STAT5 activation. Anti-CD3, being a weaker stimulant than PI, induced a smaller percentage of rested CD4 cells to express IL-2 (none of which displayed elevated pSTAT5), but this IL-2 appeared sufficient to elevate pSTAT5 in many IL-2− CD4 cells as well as the majority of Foxp3+ cells (which do not express IL-2). Thus, while the pattern of anti-CD3-induced IL-2 expression and signaling more closely mimics the pattern observed during in vivo viral priming, the complete absence of overlap between IL-2 expression and elevated pSTAT5 following PI stimulation confirms their mutual exclusivity.
FIGURE 4.
CD4 cells receiving a strong IL-2-inducing stimulus in vitro do not undergo autocrine IL-2 signaling. Naive polyclonal CD4 cells were stimulatedinvitrowithplate-boundanti-CD3 for 16 h (CD3 16 h), rested 9 h in fresh medium (rest 9 h), subsequently cultured with exogenous IL-2 (rest → IL-2) or restimulated with either PI (rest → PI) or soluble anti-CD3 plus APCs (rest → CD3) and directly stained for Foxp3, IL-2, CD25, and pSTAT5.
Given the ability of IL-2 to regulate antiviral T cell responses (11, 24), it is curious that during the early phase of antiviral CD4 cell response paracrine IL-2 signaling operates efficiently while autocrine signaling is difficult to detect. Because IL-2 can promote apoptosis of activated T cells (25), the intensity of STAT5 activation that autocrine IL-2 signaling might elicit could necessitate that IL-2-expressing CD4 cells become refractory to STAT5 activation to limit apoptosis (or perhaps other deleterious effects). Consistent with this possibility, the only effect described for autocrine IL-2 signaling in regulating in vivo T cell responses is to dampen antiviral CD8 cell expansion (11). In this scenario, transient autocrine IL-2 signaling might engage a negative feedback mechanism that prevents sustained autocrine signaling.
Paracrine IL-2 signaling operates quite efficiently in Tregs. Under steady-state conditions when IL-2 levels in secondary lymphoid organs are presumably low, ~10% of Tregs display elevated pSTAT5 (Figs. 1 and 2). This suggests that Tregs are sensitive to low IL-2 levels, consistent with the critical role of IL-2 in the homeostasis and function of Tregs (12, 13). The ability of neighboring IL-2-expressing antiviral CD4 cells to induce elevated pSTAT5 in ~90% of Tregs (Figs. 1 and 2) is also consistent with the augmentation of Treg function that can be elicited via IL-2 produced by conventional T cells (14). This ability of Tregs to respond to elevated IL-2 produced by activated antiviral T cells could represent a mechanism to explain how Tregs can develop enhanced function or undergo expansion in parallel with antiviral T cell responses (26, 27). Such a mechanism would presumably operate more robustly during a secondary Ag encounter when Ag-specific T cells are present at high frequency.
Acknowledgments
We thank Drs. Leo Lefrançois and Anthony Vella for helpful discussions.
Footnotes
This work was supported by National Institutes of Health Grants AI057441 and CA109339 (to A.J.A.).
Abbreviations used in this paper: pSTAT5, phosphorylated STAT5; Treg, CD4+CD25+Foxp3+ regulatory T cell; HA, hemagglutinin; NT, nontransgenic; vacc-HA, recombinant vaccinia expressing HA; PI, PMA + ionomycin.
Disclosures
The authors have no financial conflict of interest.
References
- 1.Davis MM, Boniface JJ, Reich Z, Lyons D, Hampl J, Arden B, Chien Y. Ligand recognition by αβ T cell receptors. Annu Rev Immunol. 1998;16:523–544. doi: 10.1146/annurev.immunol.16.1.523. [DOI] [PubMed] [Google Scholar]
- 2.Jenkins MK. The ups and downs of T cell costimulation. Immunity. 1994;1:443–446. doi: 10.1016/1074-7613(94)90086-8. [DOI] [PubMed] [Google Scholar]
- 3.Croft M. Co-stimulatory members of the TNFR family: keys to effective T-cell immunity? Nat Rev Immunol. 2003;3:609–620. doi: 10.1038/nri1148. [DOI] [PubMed] [Google Scholar]
- 4.von Freeden-Jeffry U, Vieira P, Lucian LA, McNeil T, Burdach SE, Murray R. Lymphopenia in interleukin (IL)-7 gene-deleted mice identifies IL-7 as a nonredundant cytokine. J Exp Med. 1995;181:1519–1526. doi: 10.1084/jem.181.4.1519. [DOI] [PMC free article] [PubMed] [Google Scholar]
- 5.Marrack P, Kappler J. Control of T cell viability. Annu Rev Immunol. 2004;22:765–787. doi: 10.1146/annurev.immunol.22.012703.104554. [DOI] [PubMed] [Google Scholar]
- 6.Mosmann TR, Coffman RL. TH1 and TH2 cells: different patterns of lymphokine secretion lead to different functional properties. Annu Rev Immunol. 1989;7:145–173. doi: 10.1146/annurev.iy.07.040189.001045. [DOI] [PubMed] [Google Scholar]
- 7.Schluns KS, Lefrancois L. Cytokine control of memory T-cell development and survival. Nat Rev Immunol. 2003;3:269–279. doi: 10.1038/nri1052. [DOI] [PubMed] [Google Scholar]
- 8.Smith KA. Interleukin-2: inception, impact, and implications. Science. 1988;240:1169–1176. doi: 10.1126/science.3131876. [DOI] [PubMed] [Google Scholar]
- 9.Sadlack B, Merz H, Schorle H, Schimpl A, Feller AC, Horak I. Ulcerative colitis-like disease in mice with a disrupted interleukin-2 gene. Cell. 1993;75:253–261. doi: 10.1016/0092-8674(93)80067-o. [DOI] [PubMed] [Google Scholar]
- 10.Cousens LP, Orange JS, Biron CA. Endogenous IL-2 contributes to T cell expansion and IFN-γ production during lymphocytic choriomeningitis virus infection. J Immunol. 1995;155:5690–5699. [PubMed] [Google Scholar]
- 11.D’Souza WN, Schluns KS, Masopust D, Lefrancois L. Essential role for IL-2 in the regulation of antiviral extralymphoid CD8 T cell responses. J Immunol. 2002;168:5566–5572. doi: 10.4049/jimmunol.168.11.5566. [DOI] [PubMed] [Google Scholar]
- 12.Almeida AR, Legrand N, Papiernik M, Freitas AA. Homeostasis of peripheral CD4+ T cells: IL-2Rα and IL-2 shape a population of regulatory cells that controls CD4+ T cell numbers. J Immunol. 2002;169:4850–4860. doi: 10.4049/jimmunol.169.9.4850. [DOI] [PubMed] [Google Scholar]
- 13.Furtado GC, Curotto de Lafaille MA, Kutchukhidze N, Lafaille JJ. Interleukin 2 signaling is required for CD4+ regulatory T cell function. J Exp Med. 2002;196:851–857. doi: 10.1084/jem.20020190. [DOI] [PMC free article] [PubMed] [Google Scholar]
- 14.Curotto de Lafaille MA, Lino AC, Kutchukhidze N, Lafaille JJ. CD25- T cells generate CD25+Foxp3+ regulatory T cells by peripheral expansion. J Immunol. 2004;173:7259–7268. doi: 10.4049/jimmunol.173.12.7259. [DOI] [PubMed] [Google Scholar]
- 15.Leonard WJ. Type I cytokines and interferons and their receptors. In: Paul WE, editor. Fundamental Immunology. 5. Lippincott Williams & Wilkins; Philadelphia: 2003. pp. 706–708. [Google Scholar]
- 16.Lin JX, Leonard WJ. The role of Stat5a and Stat5b in signaling by IL-2 family cytokines. Oncogene. 2000;19:2566–2576. doi: 10.1038/sj.onc.1203523. [DOI] [PubMed] [Google Scholar]
- 17.Kirberg J, Baron A, Jakob S, Rolink A, Karjalainen K, von Boehmer H. Thymic selection of CD8+ single positive cells with a class II major histocompatibility complex-restricted receptor. J Exp Med. 1994;180:25–34. doi: 10.1084/jem.180.1.25. [DOI] [PMC free article] [PubMed] [Google Scholar]
- 18.Higgins AD, Mihalyo MA, McGary PW, Adler AJ. CD4 cell priming and tolerization are differentially programmed by APCs upon initial engagement. J Immunol. 2002;168:5573–5581. doi: 10.4049/jimmunol.168.11.5573. [DOI] [PubMed] [Google Scholar]
- 19.Krutzik PO, Clutter MR, Nolan GP. Coordinate analysis of murine immune cell surface markers and intracellular phosphoproteins by flow cytometry. J Immunol. 2005;175:2357–2365. doi: 10.4049/jimmunol.175.4.2357. [DOI] [PubMed] [Google Scholar]
- 20.Maxwell JR, Rossi RJ, McSorley SJ, Vella AT. T cell clonal conditioning: a phase occurring early after antigen presentation but before clonal expansion is impacted by Toll-like receptor stimulation. J Immunol. 2004;172:248–259. doi: 10.4049/jimmunol.172.1.248. [DOI] [PubMed] [Google Scholar]
- 21.Apostolou I, Sarukhan A, Klein L, von Boehmer H. Origin of regulatory T cells with known specificity for antigen. Nat Immunol. 2002;3:756–763. doi: 10.1038/ni816. [DOI] [PubMed] [Google Scholar]
- 22.Thornton AM, Shevach EM. CD4+CD25+ immunoregulatory T cells suppress polyclonal T cell activation in vitro by inhibiting interleukin 2 production. J Exp Med. 1998;188:287–296. doi: 10.1084/jem.188.2.287. [DOI] [PMC free article] [PubMed] [Google Scholar]
- 23.Fontenot JD, Gavin MA, Rudensky AY. Foxp3 programs the development and function of CD4+CD25+ regulatory T cells. Nat Immunol. 2003;4:330–336. doi: 10.1038/ni904. [DOI] [PubMed] [Google Scholar]
- 24.Utermohlen O, Tarnok A, Bonig L, Lehmann-Grube F. T lymphocyte-mediated antiviral immune responses in mice are diminished by treatment with mono-clonal antibody directed against the interleukin-2 receptor. Eur J Immunol. 1994;24:3093–3099. doi: 10.1002/eji.1830241227. [DOI] [PubMed] [Google Scholar]
- 25.Lenardo MJ. Interleukin-2 programs mouse αβ T lymphocytes for apoptosis. Nature. 1991;353:858–861. doi: 10.1038/353858a0. [DOI] [PubMed] [Google Scholar]
- 26.Suvas S, Kumaraguru U, Pack CD, Lee S, Rouse BT. CD4+CD25+ T cells regulate virus-specific primary and memory CD8+ T cell responses. J Exp Med. 2003;198:889–901. doi: 10.1084/jem.20030171. [DOI] [PMC free article] [PubMed] [Google Scholar]
- 27.Zhou G, Drake CG, Levitsky HI. Amplification of tumor-specific regulatory T cells following therapeutic cancer vaccines. Blood. 2006;107:628–636. doi: 10.1182/blood-2005-07-2737. [DOI] [PMC free article] [PubMed] [Google Scholar]


