

Abstract
Allosteric binding sites on the adenosine receptor family represent potential therapeutic targets for a number of conditions involving metabolic stress. This study has identified Brilliant Black BN as a novel allosteric modulator of the adenosine A1 and A3 receptors. In addition to being a food dye and pharmaceutical excipient, Brilliant Black BN is commonly used within calcium mobilization assays to quench extracellular fluorescence. Brilliant Black BN (5–500 μM) had no significant effect on the calcium mobilization stimulated by the nonselective adenosine receptor agonist 5′-(N-ethylcarboxamido)adenosine in Chinese hamster ovary cells stably transfected with the human adenosine A1 or A3 receptor. Likewise, calcium mobilization and radioligand binding assays found that Brilliant Black BN (5–500 μM) did not significantly influence the antagonism mediated by 8-cyclopentyl-1,3-dipropylxanthine (100 nM) at the A1 receptor. In contrast, the affinity of N-[9-chloro-2-(2-furanyl)[1,2,4]-triazolo[1,5-c]quinazolin-5-yl]benzene acetamide (MRS1220) at the A3 receptor and xanthine amine congener (XAC) and XAC-X-BY630 at the A1 and A3 receptors was significantly decreased in the presence of 500 μM Brilliant Black BN. A reduction in XAC potency at the A1 and A3 receptor was achieved within 1 min of Brilliant Black BN addition, despite receptors having been pre-equilibrated with antagonist. Dissociation kinetics of the fluorescent XAC derivative, XAC-X-BY630, revealed that the decrease in affinity is probably due to a significant increase in dissociation rate of the antagonist in the presence of Brilliant Black BN. Taken together, these results suggest that Brilliant Black BN can act allosterically to modify ligand affinity at A1 and A3 receptors.
The adenosine receptor family consists of four family A G protein-coupled receptors (GPCRs): the adenosine A1, A2A, A2B, and A3 receptors (Fredholm et al., 2001). The A1 and A3 receptor subtypes couple predominantly to the family of Gi/o proteins, the A2A receptor preferentially couples to the family of Gs proteins, and the A2B receptor couples to both Gs and Gq/11 family proteins. Collectively, adenosine receptors are expressed in a variety of tissues, and endogenous adenosine is generally regarded as a mediator of metabolic stress. As such, these receptors are considered promising therapeutic targets for the development of cardioprotective and neuroprotective agents during times of cardiac and cerebral ischemia (Cohen and Downey, 2008). However, the widespread distribution of adenosine receptors prevents the targeting of these receptors by classic orthosteric agonists and antagonists (Bruns and Fergus, 1990; Yan et al., 2003). More recent efforts have focused on alternative approaches, such as allosteric enhancers of endogenous adenosine, which have the potential to modulate adenosine receptor activity in a spatially and temporally selective manner. Allosteric modulators differ from orthosteric ligands in that they recognize a site on the receptor that is topographically distinct from the endogenous ligand binding site. Both the adenosine A1 and A3 receptors are allosterically regulated by a number of structurally diverse ligands (Bruns and Fergus, 1990; van der Klein et al., 1999; Baraldi et al., 2000; Gao et al., 2001, 2003, 2004; Tranberg et al., 2002; van den Nieuwendijk et al., 2004; Göblyös et al., 2006; Aurelio et al., 2009). A common feature of these ligands is their ability to alter the dissociation kinetics of a radiolabeled orthosteric ligand. This characteristic of allosteric modulators remains one of the most sensitive methods for validating an allosteric interaction between two ligands (Christopoulos and Kenakin, 2002).
Although radioligand binding studies remain important within the GPCR field, calcium mobilization assays currently represent the primary platform for high-throughput screening within GPCR drug discovery. Upon stimulation, Gi/o-coupled GPCRs promote intracellular calcium mobilization through the direct interaction of βγ subunits with phospholipase C (Rhee, 2001). Once activated, phospholipase C catalyzes the hydrolysis of phosphatidylinositol 4,5-bisphosphate into inositol 1,4,5-triphosphate and diacylglycerol, which in turn stimulate intracellular calcium mobilization and protein kinase C activation, respectively. An increase in the intracellular calcium concentration is detected using a calcium-sensitive fluorescent dye, such as Fluo-4, in conjunction with a fluorometric imaging plate reader (Hansen and Brauner-Osborne, 2009). Calcium assays have been successfully miniaturized, largely automated, and are generally more sensitive than alternative approaches, such as radioligand binding assays, at detecting a wide spectrum of allosteric modulators (May et al., 2007). The food dye and pharmaceutical excipient Brilliant Black BN is routinely used in calcium assays at concentrations ranging from 100 to 500 μM as a fluorescent quencher to reduce the fluorescence from extracellular Fluo-4 and, as such, removes the requirement to wash cells before stimulation (Macioszek and Kononowicz, 2004; Rosethorne et al., 2004; Cronshaw et al., 2006; Roth et al., 2006; Australian Department of Health and Ageing, 2007; Leach et al., 2007; Brighton et al., 2008; Su et al., 2008; Yoshioka and Ichihashi, 2008).
An anthraquinone sulfonic acid derivative, cibacron blue, has been identified as an allosteric modulator of the human P2X3 receptor (Alexander et al., 1999; Jarvis et al., 2001). In addition, the food dye Brilliant Blue G has recently been used as an inhibitor of the P2X7 receptor (Peng et al., 2009). Cibacron blue, Brilliant Blue G, and Brilliant Black BN contain a number of charged sulfonic acid groups within their structure (Burnstock and Williams, 2000; Macioszek and Kononowicz, 2004). The advantage of using Brilliant Black BN in high-throughput calcium mobilization assays is evident. However, given the structural similarities to cibacron blue and Brilliant Blue G, which are not pharmacologically inert, it is important to ensure that Brilliant Black BN has no influence on the ligand-receptor complexes being investigated. Therefore, the aim of this study was investigate the influence of Brilliant Black BN on ligand-receptor interactions at the human adenosine A1 and A3 receptors. Specifically, we examined the effect of Brilliant Black BN on the binding and functional properties of the agonist 5′-(N-ethylcarboxamido)adenosine (NECA) and the antagonists 8-cyclopentyl-1,3-dipropylxanthine (DPCPX), MRS1220, xanthine amine congener (XAC), and an XAC derivative that incorporates the BODIPY [630/650] fluorophore (XAC-X-BY630; Briddon et al., 2004) at A1 and A3 receptors.
Materials and Methods
Materials.
Fluo-4AM and Pluronic acid were from Invitrogen (Carlsbad, CA), fetal calf serum was from PAA Laboratories (Pasching, Austria), XAC-X-BY630 was from CellAura Technologies Ltd (Nottingham, UK), [3H]DPCPX was purchased from GE Healthcare (Chalfont St. Giles, Buckinghamshire, UK), and l-glutamine and trypsin were purchased from Lonza Verviers SPRL (Verviers, Belgium). All other chemicals were from Sigma Aldrich (Poole, Dorset, UK).
Cell Culture.
Chinese hamster ovary (CHO)-K1 cells stably transfected with either the human adenosine A1 receptor (CHO A1; Bmax = 3350 ± 315 fmol/mg protein; Cordeaux et al., 2000) or the human adenosine A3 receptor (CHO A3; Bmax = 765 ± 22 fmol/mg protein; Cordeaux et al., 2008) were grown to 95 to 100% confluence and maintained in Dulbecco's modified Eagle's medium (DMEM)/nutrient mix Ham's F12 containing 10% fetal calf serum (FCS) and 2 mM l-glutamine at 37°C in a humidified incubator containing 5% CO2/95% O2. Cells were harvested using trypsin (0.25%) and centrifugation at 1000g for 5 min. The resulting pellet was then resuspended in DMEM/Ham's F12 containing 10% FCS and 2 mM l-glutamine, and cells were seeded at least 18 h before assaying and grown to 80 to 100% confluence.
Calcium Mobilization Assay.
CHO A1 and CHO A3 cells seeded into black-sided 96-well view plates were incubated at 37°C for 45 min in a total volume of 100 μl of DMEM containing 10% FCS, 2.5 mM probenecid, 2.3 μM Fluo 4AM, and 0.023% Pluronic acid. Cells were then washed twice with PBS and incubated in 100 μl of HEPES-buffered saline solution (HBSS; 25 mM HEPES, 10 mM glucose, 146 mM NaCl, 5 mM KCl, 1 mM MgSO4, 2 mM sodium pyruvate, and 1.3 mM CaCl2) containing 2.5 mM probenecid in the absence and presence of antagonist (XAC, XAC-X-BY630, DPCPX, or MRS1220) and/or Brilliant Black BN at 37°C for 30 min. Plates were then loaded onto a plate reader (FLEXstation; Molecular Devices, Sunnyvale, CA) and fluorescence measured (excitation, 485 nm; emission, 520 nm) every 1.52 s for up to 200 s with the addition of HBSS in the absence or presence of NECA at 15 s. A subset of experiments involved exposure of cells to 500 μM Brilliant Black BN for 1 min before agonist stimulation. In these experiments, cells were incubated (45 min at 37°C) in 100 μl of DMEM containing 10% FCS, 2.5 mM probenecid, 2.3 μM Fluo 4AM, and 0.023% Pluronic acid, washed twice with PBS, and incubated in 100 μl of HBSS containing 2.5 mM probenecid in the absence and presence of 1 μM XAC (30 min at 37°C). Plates were then loaded onto the plate reader and fluorescence measured as before every 1.52 s for up to 200 s with the addition of HBSS in the absence or presence of Brilliant Black BN at 15 s, followed by HBSS in the absence or presence of NECA at 75 s.
[3H]DPCPX Whole-Cell Competition Binding.
CHO A1 cells seeded in white-sided 96-well view plates were incubated in total volume of 200 μl of HBSS containing 1 nM [3H]DPCPX in the absence and presence of 500 μM Brilliant Black BN and a range of concentrations of either NECA (100 nM–100 μM), XAC (10 pM–10 μM), or DPCPX (10 pM–10 μM). Cells were then washed twice with ice-cold PBS (100 μl/well), followed by the addition of 100 μl/well MicroScint 20 (PerkinElmer Life and Analytical Sciences, Waltham, MA), and a sealant film was placed over the wells. Nonspecific binding was defined as the level of 1 nM [3H]DPCPX binding in the presence of 10 μM DPCPX. Radioactivity was determined using a Packard TopCount (PerkinElmer Life and Analytical Sciences). Results are expressed as a percentage of [3H]DPCPX (1 nM) specific binding in the absence of competitive ligand.
Live Cell Imaging.
Live cell imaging was performed using a Zeiss LSM 510 laser scanning confocal microscope with a Zeiss Plan-Neofluar 40× 1.3 numerical aperture oil-immersion objective. XAC-X-BY630 was excited with a helium-neon laser at 633 nm and detected using a long-pass filter at 650 nm. Phase and fluorescence images were captured every 2 s for the duration of the time course. CHO A1 cells seeded onto 32-mm glass coverslips were loaded onto a closed, temperature-controlled perfusion system. During the time course of the experiment, cells were constantly perfused with either HBSS alone, HBSS in the presence of 3 nM XAC-X-BY630, or HBSS in the presence of 50 μM Brilliant Black BN. For all experiments, the rate of perfusion was maintained above 5 ml/min, which reflects at least 12 complete fluid exchanges per minute.
Data Analysis.
NECA concentration-response curves in the absence and presence of increasing concentrations of XAC were globally fit to the following competitive interaction model with the use of Prism 5 (GraphPad Software, San Diego, CA).
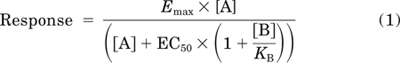 |
where Emax is the maximal response, EC50 is the molar concentration of NECA [A] in the absence of XAC required to generate a response that is 50% of Emax, [B] is the concentration of XAC, and KB is the antagonist equilibrium dissociation constant.
NECA concentration-response curves in the absence or presence of a single concentration of antagonist and/or Brilliant Black BN were fitted to the following equation with the use of Prism 5:
where the EC50 is the molar concentration of NECA required to generate 50% of Emax.
Antagonist functional inhibition curves were analyzed according to the following equation with the use of Prism 5.
where IC50 reflects the molar concentration of antagonist [B] required to decrease by 50% the response mediated by the fixed molar concentration of NECA used for the functional inhibition in the absence of antagonist (Emax).
To obtain the molar concentration of NECA that, in the absence of antagonist, mediates the same response level as the IC50 from the functional inhibition curve (ECF), NECA concentration-response curves performed simultaneously to the functional inhibition were analyzed according to the following equation with the use of Prism 5:
where the EC50 is calculated using eq. 2 and F represents the percentage response from the normalized concentration-response curve that is 50% of that mediated by the fixed molar concentration of NECA used within the functional inhibition assay.
Antagonist equilibrium dissociation constants (KB) were subsequently estimated by substituting the IC50 and ECF values obtained from eqs. 3 and 4 into a modified form of the Gaddum equation as described by Lazareno and Birdsall (1993).
[3H]DPCPX competition binding data were fit to a one-site inhibition mass action curve with the use of Prism 5.
where [A] is the concentration of competing ligand, and IC50 is the molar concentration of competing ligand that reduces the specific binding by [3H]DPCPX by 50%.
IC50 values estimated from [3H]DPCPX homologous competition curves were used to determine the equilibrium dissociation constant (KD) for [3H]DPCPX/DPCPX:
where [D] is the molar concentration of radioligand.
To calculate equilibrium dissociation constants (KB) for the heterologous competitive ligands, IC50 values estimated from [3H]DPCPX competition curves were used in the following equation (Prism 5).
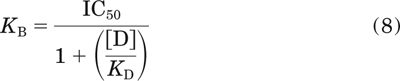 |
where [D] is the molar concentration of radioligand and KD is the equilibrium dissociation constant of the radioligand.
Dissociation kinetic data were fit to a one phase exponential decay with the use of Prism 5.
where Bt denotes fluorescent ligand binding at time (t), B0 denotes fluorescent ligand binding at t = 0, and koff is the dissociation rate of the fluorescent ligand.
Equilibrium dissociation constants and potency values were estimated as logarithms, and all values are expressed as the mean ± S.E.M. (Christopoulos, 1998). Statistical analysis involved an unpaired t test with statistical significance reflecting p < 0.05 (Prism 5).
Results
NECA Stimulation of Calcium Mobilization in the Absence and Presence of Antagonist and/or Brilliant Black BN at CHO A1 and CHO A3 Cells.
In the absence of Brilliant Black BN, the nonselective agonist NECA mediated a robust and concentration-dependent stimulation of intracellular calcium mobilization in both CHO A1 and CHO A3 cells with a pEC50 of 8.90 ± 0.08 and 8.08 ± 0.05, respectively (Fig. 1). Furthermore, exposure of CHO A1 and CHO A3 cells to the nonselective adenosine receptor antagonist XAC caused a concentration-dependent rightward shift in the NECA concentration-response curve with no significant change in the maximal response. In both cases, global nonlinear regression analysis to a modified Schild model found that for each data family the Schild slope did not differ significantly from 1 and therefore was constrained to 1. As such, the calculated pA2 values of 6.95 ± 0.11 and 7.22 ± 0.06 are assumed to reflect the equilibrium dissociation constants for XAC at the A1 and A3 receptor, respectively (Fig. 1).
Fig. 1.

Classic competitive antagonism of NECA-mediated increases in intracellular calcium by XAC at adenosine A1 and A3 receptors. CHO A1 (A) and CHO A3 (B) cells were pre-equilibrated with 0 μM (●), 0.1 μM (○), 1 μM (■), or 10 μM (□) XAC before stimulation with the adenosine receptor agonist, NECA. Data represent the mean peak response, expressed as a percentage of the peak response mediated by 1 μM NECA ± S.E.M. of three experiments conducted in triplicate.
In the absence of Brilliant Black BN, exposure of CHO A1 and CHO A3 cells to 1 μM XAC and 1 μM XAC-X-BY630 caused a significant rightward shift in the concentration-response relationship for the NECA-mediated increase in intracellular calcium concentration (Table 1). When repeated in the presence of a range of concentrations of Brilliant Black BN (5–500 μM), the potency of NECA was not significantly altered at A1 or A3 receptors (Table 1). In contrast, the potency of 1 μM XAC-BY630 and 1 μM XAC decreased in a concentration-dependent manner such that XAC-BY630 (1 μM) and XAC (1 μM) mediated virtually no antagonism in the presence of 500 μM Brilliant Black BN (Table 1).
TABLE 1.
NECA potency (Log EC50) in the absence and presence of antagonists and/or Brilliant Black BN at the adenosine A1 and A3 receptors
Data represent the mean ± S.E.M. of 3 to 11 experiments conducted in triplicate.
| Brilliant Black BN |
||||
|---|---|---|---|---|
| 0 μM | 5 μM | 50 μM | 500 μM | |
| A1-CHO | ||||
| NECA | −8.0 ± 0.3 | −8.3 ± 0.3 | −8.2 ± 0.2 | −8.0 ± 0.1 |
| + 1 μM XAC-X-BY630 | −7.3 ± 0.3 | −7.7 ± 0.2 | −7.9 ± 0.1 | −8.0 ± 0.1 |
| + 1 μM XAC | −7.0 ± 0.2 | −7.3 ± 0.3 | −7.7 ± 0.4 | −7.9 ± 0.1 |
| A3-CHO | ||||
| NECA | −7.8 ± 0.2 | −7.7 ± 0.2 | −8.0 ± 0.2 | −7.7 ± 0.1 |
| + 1 μM XAC-X-BY630 | −6.7 ± 0.2 | −6.5 ± 0.3 | −7.2 ± 0.2 | −7.5 ± 0.1 |
| + 1 μM XAC | −6.7 ± 0.3 | −6.4 ± 0.3 | −7.4 ± 0.1 | −7.4 ± 0.2 |
Performing full agonist concentration response curves in conjunction with functional antagonist inhibition curves allowed estimation of antagonist equilibrium dissociation constants in the absence and presence of 500 μM Brilliant Black BN according to a modified version of the Gaddum equation (Lazareno and Birdsall, 1993). In the absence of Brilliant Black BN, exposure of CHO A1 and CHO A3 cells to XAC (10 pM–30 μM), XAC-X-BY630 (10 nM–10 μM), DPCPX (10 pM–10 μM; CHO A1 only), and MRS1220 (10 pM–10 μM; CHO A3 only) caused a concentration-dependent decrease in the intracellular calcium mobilization mediated by a single NECA concentration (Figs. 2 and 3; Table 2). When repeated in the presence of 500 μM Brilliant Black, the affinity of DPCPX at the A1 receptor was not significantly altered. In contrast, the affinity of MRS1220 at the A3 receptor and XAC and XAC-X-BY630 at the A1 and A3 receptors was significantly decreased (Figs. 2 and 3; Table 2).
Fig. 2.

The influence of 500 μM Brilliant Black BN on agonist and antagonist potency at the adenosine A1 receptor. A, the intracellular calcium mobilization mediated upon exposure of CHO A1 cells to increasing concentrations of NECA in the absence (●) and presence (○) of 500 μM Brilliant Black BN. B, inhibition of the calcium response stimulated in response to the indicated concentration of NECA after 30-min exposure of CHO A1 cells to increasing concentrations of DPCPX (squares; 10 nM NECA), XAC (circles; 1 nM NECA), and XAC-X-BY630 (diamonds; 1 nM NECA) in the absence (closed symbols) and presence (open symbols) of 500 μM Brilliant Black BN. C, the change in the negative logarithm of antagonist equilibrium dissociation constants (Δ pKB) at the A1 receptor. Values represent the pKB (in the presence) minus the pKB (in the absence) of Brilliant Black BN as calculated from Table 2. Data represent the mean ± S.E.M. of four to nine experiments conducted in duplicate.
Fig. 3.

The influence of 500 μM Brilliant Black BN on agonist and antagonist potency at adenosine A3 receptor. A, the intracellular calcium mobilization mediated upon exposure of CHO A3 cells to increasing concentrations of NECA in the absence (●) and presence (○) of 500 μM Brilliant Black BN. B, inhibition of the calcium response stimulated in response to the indicated concentration of NECA after 30-min exposure of CHO A3 cells to increasing concentrations of MRS1220 (circles; 100 nM NECA), XAC (squares; 10 nM NECA), and XAC-X-BY630 (diamonds; 10 nM NECA) in the absence (closed symbols) and presence (open symbols) of 500 μM Brilliant Black BN. C, the change in the negative logarithm of antagonist equilibrium dissociation constants (Δ pKB) at the A3 receptor. Values represent the pKB (in the presence) minus the pKB (in the absence) of Brilliant Black BN as calculated from Table 2. Data represent the mean ± S.E.M. of three to nine experiments conducted in duplicate.
TABLE 2.
Negative logarithm of antagonist equilibrium dissociation constants (pKB) as estimated from Gaddum analysis of functional inhibition of 1 to 100 nM NECA in the absence and presence of Brilliant Black BN at the adenosine A1 and A3 receptors
Data represent the mean ± S.E.M. of three to nine experiments conducted in duplicate.
| Brilliant Black BN |
||
|---|---|---|
| 0 μM | 500 μM | |
| A1-CHO | ||
| DPCPX | 8.6 ± 0.1 | 8.4 ± 0.1 |
| XAC-X-BY630 | 6.9 ± 0.1 | 5.3 ± 0.2* |
| XACa | 7.1 ± 0.1 | 5.6 ± 0.1* |
| A3-CHO | ||
| MRS1220 | 9.7 ± 0.1 | 9.1 ± 0.1* |
| XAC-X-BY630 | 7.7 ± 0.2 | 5.9 ± 0.1* |
| XACb | 7.5 ± 0.1 | 6.0 ± 0.1* |
pKB values represent the average calculated from the inhibition of 1 nM and 10 nM NECA. There was no significant difference (P > 0.05; unpaired t test) between corresponding pKB values determined in the presence of 1 nM and 10 nM NECA.
pKB values represent the average calculated from the inhibition of 10 nM and 100 nM NECA. There was no significant difference (P > 0.05; unpaired t test) between corresponding pKB values determined in the presence of 10 nM and 100 nM NECA.
Significantly different (P < 0.05; unpaired t test) from the corresponding value in the absence of Brilliant Black BN.
Time Dependence of Brilliant Black BN Inhibition of XAC Antagonism.
To determine whether the effect of Brilliant Black BN on XAC antagonism was time-dependent, the exposure time of CHO A1 and CHO A3 cells to Brilliant Black BN before NECA addition was reduced from 30 min to 1 min. The control NECA-mediated calcium response time courses for CHO A1 cells in the absence and presence of XAC (1 μM) pre-equilibration are shown in Fig. 4, A and B. Within these time courses, HBSS is added at 15 s and NECA (10 pM–10 μM) at 75 s. In each case, the addition of HBSS alone did not significantly change the basal fluorescence. In the absence of XAC, 1 nM NECA was sufficient to stimulate a significant calcium response, whereas in the presence of XAC, the concentration of NECA required to mediate the same response was at least 10-fold higher. Likewise, in CHO A3 cells, the addition of HBSS alone at 15 s had no significant effect on basal fluorescence in the absence and presence of pre-equilibrated XAC (1 μM). At the adenosine A3 receptor, the addition of 10 nM NECA was sufficient to stimulate a significant calcium response in the absence of XAC, whereas in the presence of XAC, a concentration of NECA more than 10-fold higher was required to mediate the same response (Fig. 5, A and B).
Fig. 4.

The addition of 500 μM Brilliant Black BN 1 min before NECA stimulation abolishes the antagonism mediated by 1 μM XAC at the adenosine A1 receptor. The time course of A1 receptor-mediated intracellular calcium mobilization in the absence (A and C) or presence (B and D) of 1 μM XAC after the addition of HBSS (A and B) or 500 μM Brilliant Black BN (C and D) at 15 s and NECA at 75 s (▿, absence; ▵, 10 pM; □, 100 pM; ○, 1 nM; ▾, 10 nM; ▴, 100 nM; ■, 1 μM; ●, 10 μM). Data represent the mean ± S.E.M. of three experiments conducted in triplicate, expressed as a percentage of basal fluorescence.
Fig. 5.

The addition of 500 μM Brilliant Black BN 1 min before NECA stimulation abolishes the antagonism mediated by 1 μM XAC at the adenosine A3 receptor. The time course of A3 receptor-mediated intracellular calcium mobilization in the absence (A and C) or presence (B and D) of 1 μM XAC after the addition of HBSS (A and B) or 500 μM Brilliant Black BN (C and D) at 15 s and NECA at 75 s (▿, absence; ▵, 10 pM; □, 100 pM; ○, 1 nM; ▾, 10 nM; ▴, 100 nM; ■, 1 μM; ●, 10 μM). Data represent the mean ± S.E.M. of three experiments conducted in triplicate, expressed as a percentage of basal fluorescence.
The striking effect of Brilliant Black BN on basal fluorescence is shown in Fig. 4, C and D, for CHO A1 cells and Fig. 5, C and D, for CHO A3 cells. In each case, the addition of 500 μM Brilliant Black at 15 s reduced basal fluorescence by greater than 50%. The exposure of CHO A1 and CHO A3 cells to 500 μM Brilliant Black BN for 1 min did not significantly alter the potency of NECA at either receptor. Furthermore, despite the significant decrease in basal fluorescence upon the addition of 500 μM Brilliant Black BN, the amplitude of the NECA-mediated calcium response was similar to those performed in the absence of Brilliant Black BN. After 1 min exposure of CHO A1 cells to 500 μM Brilliant Black BN, the calcium response profile for the corresponding NECA concentrations were virtually indistinguishable, regardless of whether or not cells had been pre-equilibrated with 1 μM XAC (Fig. 4, C and D). Likewise, pre-equilibration of CHO A3 cells with 1 μM XAC had no effect on the NECA-mediated calcium response after the 1-min exposure of cells to 500 μM Brilliant Black BN (Fig. 5, C and D). The plot of peak response against NECA concentration clearly demonstrates the effect of 1-min exposure of cells to 500 μM Brilliant Black BN on the antagonism mediated by XAC at adenosine A1 and A3 receptors (Fig. 6). In the absence of Brilliant Black, 30 min exposure of CHO A1 and CHO A3 cells to 1 μM XAC caused a greater then 10-fold decrease in NECA potency at both A1 and A3 receptors. In contrast, the exposure of cells to 500 μM Brilliant Black BN for 1 min before NECA addition was sufficient to remove any antagonism mediated by pre-equilibrated XAC (1 μM; Fig. 6).
Fig. 6.

The effect of Brilliant Black BN (500 μM) added 1 min before NECA stimulation on the potency of XAC (1 μM) at the adenosine A1 and A3 receptor. The concentration response of adenosine A1 (A) and A3 (B) receptor-mediated intracellular calcium mobilization in the absence (circles) or presence (squares) of 1 μM XAC (pre-equilibrated for 30 min) after the addition of HBSS (closed symbols) or 500 μM Brilliant Black BN (open symbols) at 15 s and NECA at 75 s. Data are the peak response expressed as a percentage of the peak response mediated by 1 μM NECA. Data represent the mean ± S.E.M. of three experiments conducted in triplicate.
Effect of Brilliant Black BN on Agonist and Antagonist Affinity at the A1 Receptor.
To further quantify the effect of Brilliant Black BN on agonist and antagonist affinity, [3H]DPCPX whole-cell competition binding was performed using CHO A1 cells. DPCPX, XAC, and NECA each mediated a concentration-dependent inhibition of 1 nM [3H]DPCPX-specific binding that was complete at the highest concentrations (Fig. 7). Homologous competition radioligand binding of [3H]DPCPX (1 nM) in the presence of increasing concentrations of nonlabeled DPCPX estimated the pKD for [3H]DPCPX/DPCPX at the A1 receptor to be 7.81 ± 0.28 in the absence and 7.53 ± 0.29 in the presence of 500 μM Brilliant Black. These pKD values were then used to estimate the equilibrium dissociation constants for NECA and XAC at the adenosine A1 receptor in the absence and presence of Brilliant Black BN (500 μM). Brilliant Black BN had little effect on the affinity of NECA at CHO A1 cells; pKB values of 5.72 ± 0.04 and 5.60 ± 0.02 in the absence and presence of Brilliant Black BN, respectively. In contrast, Brilliant Black BN significantly reduced the affinity of XAC at CHO A1 cells with estimated pKB values in the absence and presence of Brilliant Black BN of 7.33 ± 0.10 and 5.36 ± 0.21, respectively.
Fig. 7.

Brilliant Black BN (500 μM) significantly decreases the affinity of XAC, but not DPCPX or NECA, for the adenosine A1 receptor. The inhibition of [3H]DPCPX (1 nM) specific binding by DPCPX (circles), NECA (triangles), or XAC (squares) in the absence (closed symbols) and presence (open symbols) of Brilliant Black BN (500 μM) to CHO A1 cells at 37°C. Nonspecific binding was defined 1 nM [3H]DPCPX binding in the presence of 10 μM DPCPX. Data are expressed as the percentage of [3H]DPCPX-specific binding and represent the mean ± S.E.M. of four experiments conducted in triplicate.
Live Cell Imaging of XAC-X-BY630 Dissociation Kinetics in the Absence and Presence of Brilliant Black BN.
To investigate the mechanism driving the decrease in XAC affinity caused by Brilliant Black BN, the fluorescent derivative of XAC, XAC-X-BY630 was used. Live cell confocal imaging of XAC-X-BY630 binding to CHO A1 cells was performed using a closed, temperature-controlled perfusion system. Figure 8A shows simultaneous phase and fluorescence intensity readouts from the plasma membrane of CHO A1 cells during a time-course experiment. The rapid change in intensity seen for the phase image during the exposure of CHO A1 cells to 50 μM Brilliant Black BN (Fig. 8A, section III) reveals that when using the perfusion system, less than 10 s is required for complete fluid exchange within the field of view. Perfusion of 3 nM XAC-X-BY630 caused a time-dependent increase in the fluorescence detected on the plasma membrane of CHO A1 cells (Fig. 8A, section I). Given the rapid fluid exchange achieved using the perfusion system, the method of infinite dilution in the absence (Fig. 8A, section III) and presence of 50 μM Brilliant Black BN (Fig. 8A, section IV) was used to estimate the dissociation rate of XAC-X-BY630 from the plasma membrane of CHO A1 cells. In the absence of Brilliant Black BN, the fluorescent intensity decreased by approximately 30% after 14 min of infinite dilution (Fig. 8B). Immediately after the addition of Brilliant Black BN, membrane fluorescence was still detectable, indicating that membrane binding of XAC-X-BY630 to adenosine receptors at the cell surface can still be monitored by virtue of the fact that the lipophilic BODIPY dye is in a membrane environment and protected from the quenching effect of Brilliant Black BN in the incubation medium (Baker et al., 2010). Within 2 min of infinite dilution in the presence of 50 μM Brilliant Black BN, the membrane-bound fluorescent intensity was decreased by approximately 70% (Fig. 8B). Fitting this data to a monoexponential decay revealed that the dissociation rate of XAC-X-BY630 from CHO A1 cells was increased more than 40-fold, from 0.023 ± 0.01 min−1 in the absence to 0.96 ± 0.17 min−1 in the presence of 50 μM Brilliant Black BN.
Fig. 8.

Brilliant Black BN (50 μM) enhances the dissociation rate of XAC-X-BY630 from the adenosine A1 receptor. A, real-time confocal imaging showing XAC-X-BY630 (●; 3 nM) association kinetics (I) followed by the dissociation kinetics in the absence (II) and presence (III) of Brilliant Black BN (50 μM). Fluid exchange was attained using a perfusion system. The intensity readout from the phase image (○; upper trace) clearly shows the rapid addition (III) and removal (IV) of Brilliant Black BN from the field of view. Data represents the mean intensity ± S.E.M. from the plasma membrane of 10 cells within a single experiment. B, the dissociation kinetics of 3 nM XAC-X-BY630 in the absence (●) and presence (○) of 50 μM Brilliant Black BN from CHO A1 cells at 37°C. Data are expressed as the percentage fluorescent intensity and represent the mean ± S.E.M. from four separate experiments in which each replicate reflects the fluorescent intensity from the plasma membrane of 10 cells. Confocal microscopy was performed on a Zeiss LSM 510 confocal microscope using a helium neon laser emitting at 633 nm and a long-pass emission filter at 650 nm.
Discussion
The largest proportion of currently marketed pharmaceuticals target GPCRs, and these receptors remain a key focus within the pharmaceutical industry. Within this, members of the adenosine receptor family are of interest because they represent novel therapeutic targets for conditions involving metabolic stress. Calcium mobilization assays remain the principle method within GPCR drug discovery for high-throughput screening of large compound libraries. A key feature of these assays that makes them particularly suitable for high-throughput screening programs involves the use of quenching agents, such as the food dye Brilliant Black BN, which removes the need for any wash steps because of its ability to quench extracellular fluorescence. Despite the use of Brilliant Black BN as a food dye and pharmaceutical excipient in addition to its wide use within GPCR drug discovery, there has been no investigation into the influence of Brilliant Black BN on ligand-receptor interactions at any GPCR. Therefore, the aim of this study was to assess whether Brilliant Black BN had any effect on ligand potency or affinity at adenosine A1 and A3 receptors. Calcium mobilization assays were used to investigate the effect of Brilliant Black BN on agonist and antagonist potency, whereas equilibrium and kinetic binding assays assessed the effect of Brilliant Black BN on ligand affinity. Brilliant Black was found to inhibit, in a probe-dependent manner, ligand affinity at both A1 and A3 receptors. Furthermore, dissociation kinetic binding assays suggest that Brilliant Black BN modulates ligand-receptor interactions through an allosteric mechanism of action.
Previous studies have shown that a range of adenosine A1 and A3 receptor agonists can stimulate calcium mobilization. In CHO cells, the calcium response mediated by these receptors is pertussis toxin-sensitive and therefore likely to be mediated through βγ subunits released from Gi/o proteins (Iredale et al., 1994; Schulte and Fredholm, 2002). In our studies, the nonselective adenosine receptor agonist NECA stimulated a robust increase in the intracellular calcium concentration with potencies of approximately 1 and 8 nM at A1 and A3 receptors, respectively. [3H]DPCPX competition binding assays estimated an equilibrium dissociation constant for NECA (KB) of approximately 2 μM at the A1 receptor, which is in agreement with previous estimates of NECA affinity at this receptor (Baker and Hill, 2007). The 2000-fold leftward shift in potency compared with binding affinity reflects the ability of NECA to stimulate a full calcium response in the presence of a large receptor reserve in this A1 receptor cell line. The potency of NECA at stimulating a calcium response through A1 and A3 receptors was largely unaffected by the exposure of cells to increasing concentrations of Brilliant Black BN. In support of this finding, NECA affinity at the A1 receptor was not significantly different in the absence and presence of 500 μM Brilliant Black.
In the absence of Brilliant Black BN, XAC behaved as a classic competitive antagonist at both adenosine A1 and A3 receptors. Exposure of CHO A1 and CHO A3 cells to increasing concentrations of XAC caused a progressive parallel rightward shift in the NECA concentration-response curve with no effect on basal or maximal responses. As expected for a competitive antagonist, the Schild slope estimated from global nonlinear regression of the entire family of curves was not significantly different from unity at either receptor. The equilibrium dissociation constants for XAC at the A3 receptor, as estimated by Shild and Gaddum analyses of calcium mobilization assays, were approximately 60 and 30 nM, respectively, which is consistent with previous estimates from binding assays (Klotz et al., 1998). At the A1 receptor, the equilibrium dissociation constants for XAC were approximately 100 and 70 nM when estimated from Shild and Gaddum analyses of calcium mobilization assays, respectively, and 50 nM from [3H]DPCPX competition binding assays. These equilibrium dissociation constant estimates are also consistent with previous estimates from radioligand binding assays (Klotz et al., 1998; Baker and Hill, 2007).
In the presence of increasing concentrations of Brilliant Black BN, the antagonism mediated by 1 μM XAC and its fluorescent derivative, XAC-X-BY630, decreased in a concentration-dependent manner at both A1 and A3 receptors. At the highest concentration of Brilliant Black BN used, XAC (1 μM) and XAC-X-BY630 (1 μM) were unable to mediate any significant antagonism of the NECA concentration-response curve at either receptor. Inhibition of XAC antagonism was rapid; that is, 1-min exposure of both CHO A1 and CHO A3 cells to 500 μM Brilliant Black BN was sufficient to remove any antagonism by XAC (1 μM) of the NECA-stimulated calcium response that had developed during the preceding 30 min incubation with XAC. Antagonist functional inhibition curves suggested that the decrease in XAC and XAC-X-BY630 potency was due to a decrease of approximately 30- to 50-fold in affinity at the A1 and A3 receptor. To further investigate the scope of the modulation mediated by Brilliant Black BN, its effect on additional selective antagonists, DPCPX and MRS1220, was assessed. Gaddum analysis of functional inhibition curves suggested that the affinity of MRS1220 at the A3 receptor was reduced by approximately 4-fold in the presence of 500 μM Brilliant Black BN. In contrast, the effect of Brilliant Black BN on DPCPX antagonism at A1 and A3 receptors, respectively, seemed minimal. In support of the findings from functional assays, [3H]DPCPX binding at the A1 receptor suggested that the affinity of XAC, but not NECA and DPCPX, was significantly decreased in the presence of 500 μM Brilliant Black BN.
Inhibition of XAC antagonism may be caused by Brilliant Black BN interacting directly with the ligand, such that it is removed from solution (e.g., by reducing its solubility or causing aggregation). Alternatively, the modulation of XAC affinity may be through a receptor interaction; that is, Brilliant Black BN may recognize an allosteric binding site on A1 and A3 receptors. To further investigate the possibility that Brilliant Black BN was simply removing unbound antagonist from solution, the time dependence of the effect of Brilliant Black BN was assessed. The Brilliant Black BN-mediated inhibition of XAC antagonism at A1 and A3 receptors was mediated within 1 min, despite receptors being pre-equilibrated with antagonist. However, the rate of dissociation of the fluorescently labeled version of XAC, XAC-X-BY630, from the A1 receptor was found to be approximately 0.023 min−1 in the absence of Brilliant Black BN. From this, it can be estimated that even upon complete removal of free ligand, approximately 97% of XAC-X-BY630 remains bound after 1 min. As such, the Brilliant Black BN-mediated inhibition of antagonism is unlikely to be the result of decreased antagonist solubility and instead may be due to a direct receptor interaction.
Subsequent assays took advantage of the fluorescent nature of XAC-X-BY630 to investigate the mechanistic basis driving the decrease in antagonist affinity observed in the presence of Brilliant Black BN. Because allosteric and orthosteric ligands can bind the receptor simultaneously, a sensitive method to detect an allosteric mechanism of action is to observe a change in the dissociation kinetics of a labeled orthosteric ligand. Confocal microscopy in conjunction with a perfusion system was used to directly quantify, at a single-cell level, the influence of Brilliant Black BN on XAC-X-BY630 dissociation kinetics. An important aspect of this system is that it allows the use of “infinite dilution.” That is, dissociated fluorescent ligand is rapidly removed by buffer perfusion at a rate of at least 12 complete fluid exchanges per min, such that subsequent reassociation of the ligand with the receptor is negligible. In these assays, Brilliant Black BN significantly enhanced the dissociation rate of XAC-X-BY630 from the A1 receptor, a feature that is characteristic of allosteric modulators. Furthermore, the change in the dissociation rate of XAC-X-BY630 at the A1 receptor from 0.023 min−1 to 0.96 min−1 in the absence and presence of Brilliant Black BN, respectively, predicts a decrease in the observed pKB value from approximately 7 to 5.46. This correlates well with the observed decrease in XAC-X-BY630 affinity at the A1 receptor from Gaddum analysis of functional inhibition curves, where the estimated pKB value decreased from approximately 7 to 5.3 in the absence and presence of Brilliant Black BN, respectively. Together, these results suggest that Brilliant Black BN can act as an allosteric modulator at adenosine A1 and A3 receptors. Similar to a number of well characterized allosteric ligands, the modulation mediated by Brilliant Black BN seems to be highly probe dependent (May et al., 2007). That is, although Brilliant Black BN caused a significant decrease in XAC and XAC-X-BY630 antagonism at A1 and A3 receptors and MRS1220 at A3 receptors, it had very little effect on NECA at A1 and A3 receptors and DPCPX at A1 receptors. As an allosteric modulator of adenosine A1 and A3 receptors, Brilliant Black BN is not an inert substance and as such should be carefully evaluated before being used as a food dye or pharmaceutical excipient. Furthermore, the influence of Brilliant Black BN on ligand-receptor interactions should be assessed at other GPCRs, because its use in drug discovery could have a significant bearing on the nature of the ligands identified.
This work was supported by the UK Medical Research Council [Grant G0800006] and by a National Health and Medical Research Council of Australia Postdoctoral Fellowship (to L.T.M.).
Article, publication date, and citation information can be found at http://molpharm.aspetjournals.org.
doi:10.1124/mol.109.063065.
- GPCR
- G protein-coupled receptor
- NECA
- 5′-(N-ethylcarboxamido)adenosine
- DPCPX
- 8-cyclopentyl-1,3-dipropylxanthine
- MRS1220
- N-[9-chloro-2-(2-furanyl)[1,2,4]-triazolo[1,5-c]quinazolin-5-yl]benzene acetamide
- XAC
- xanthine amine congener
- CHO
- Chinese hamster ovary
- DMEM
- Dulbecco's modified Eagle's medium
- FCS
- fetal calf serum
- AM
- acetoxymethyl ester
- HBSS
- HEPES-buffered saline solution
- PBS
- phosphate-buffered saline.
References
- Alexander K, Niforatos W, Bianchi B, Burgard EC, Lynch KJ, Kowaluk EA, Jarvis MF, van Biesen T. (1999) Allosteric modulation and accelerated resensitization of human P2X(3) receptors by cibacron blue. J Pharmacol Exp Ther 291:1135–1142 [PubMed] [Google Scholar]
- Aurelio L, Valant C, Flynn BL, Sexton PM, Christopoulos A, Scammells PJ. (2009) Allosteric modulators of the adenosine A1 receptor: synthesis and pharmacological evaluation of 4-substituted 2-amino-3-benzoylthiophenes. J Med Chem 52:4543–4547 [DOI] [PubMed] [Google Scholar]
- Australian Department of Health and Ageing (2007) Substances that may be used in listed medicines in Australia, Department of Health and Ageing, Therapeutic Goods Administration, Symonston, Australia: Available at http://www.tga.gov.au/cm/listsubs.pdf [Google Scholar]
- Baker JG, Hill SJ. (2007) A comparison of the antagonist affinities for the Gi- and Gs-coupled states of the human adenosine A1-receptor. J Pharmacol Exp Ther 320:218–228 [DOI] [PubMed] [Google Scholar]
- Baker JG, Middleton R, Adams L, May LT, Briddon SJ, Kellam B, Hill SJ. (2010) Influence of fluorophore and linker composition on the pharmacology of fluorescent adenosine A1 receptor ligands. Br J Pharmacol doi: 10.1111/j.1476–5381.2009.00488.x [DOI] [PMC free article] [PubMed] [Google Scholar]
- Baraldi PG, Zaid AN, Lampronti I, Fruttarolo F, Pavani MG, Tabrizi MA, Shryock JC, Leung E, Romagnoli R. (2000) Synthesis and biological effects of a new series of 2-amino-3-benzoylthiophenes as allosteric enhancers of A1-adenosine receptor. Bioorg Med Chem Lett 10:1953–1957 [DOI] [PubMed] [Google Scholar]
- Briddon SJ, Middleton RJ, Cordeaux Y, Flavin FM, Weinstein JA, George MW, Kellam B, Hill SJ. (2004) Quantitative analysis of the formation and diffusion of A1-adenosine receptor-antagonist complexes in single living cells. Proc Natl Acad Sci USA 101:4673–4678 [DOI] [PMC free article] [PubMed] [Google Scholar]
- Brighton PJ, Wise A, Dass NB, Willars GB. (2008) Paradoxical behavior of neuromedin U in isolated smooth muscle cells and intact tissue. J Pharmacol Exp Ther 325:154–164 [DOI] [PubMed] [Google Scholar]
- Bruns RF, Fergus JH. (1990) Allosteric enhancement of adenosine A1 receptor binding and function by 2-amino-3-benzoylthiophenes. Mol Pharmacol 38:939–949 [PubMed] [Google Scholar]
- Burnstock G, Williams M. (2000) P2 purinergic receptors: modulation of cell function and therapeutic potential. J Pharmacol Exp Ther 295:862–869 [PubMed] [Google Scholar]
- Christopoulos A. (1998) Assessing the distribution of parameters in models of ligand-receptor interaction: to log or not to log. Trends Pharmacol Sci 19:351–357 [DOI] [PubMed] [Google Scholar]
- Christopoulos A, Kenakin T. (2002) G protein-coupled receptor allosterism and complexing. Pharmacol Rev 54:323–374 [DOI] [PubMed] [Google Scholar]
- Cohen MV, Downey JM. (2008) Adenosine: trigger and mediator of cardioprotection. Basic Res Cardiol 103:203–215 [DOI] [PubMed] [Google Scholar]
- Cordeaux Y, Briddon SJ, Alexander SP, Kellam B, Hill SJ. (2008) Agonist-occupied A3 adenosine receptors exist within heterogeneous complexes in membrane microdomains of individual living cells. FASEB J 22:850–860 [DOI] [PubMed] [Google Scholar]
- Cordeaux Y, Briddon SJ, Megson AE, McDonnell J, Dickenson JM, Hill SJ. (2000) Influence of receptor number on functional responses elicited by agonists acting at the human adenosine A(1) receptor: evidence for signaling pathway-dependent changes in agonist potency and relative intrinsic activity. Mol Pharmacol 58:1075–1084 [DOI] [PubMed] [Google Scholar]
- Cronshaw DG, Kouroumalis A, Parry R, Webb A, Brown Z, Ward SG. (2006) Evidence that phospholipase-C-dependent, calcium-independent mechanisms are required for directional migration of T-lymphocytes in response to the CCR4 ligands CCL17 and CCL22. J Leukoc Biol 79:1369–1380 [DOI] [PubMed] [Google Scholar]
- Fredholm BB, IJzerman AP, Jacobson KA, Klotz KN, Linden J. (2001) International Union of Pharmacology. XXV. Nomenclature and classification of adenosine receptors. Pharmacol Rev 53:527–552 [PMC free article] [PubMed] [Google Scholar]
- Gao ZG, Gross AS, Jacobson KA. (2004) Effects of the allosteric modulator SCH-202676 on adenosine and P2Y receptors. Life Sci 74:3173–3180 [DOI] [PMC free article] [PubMed] [Google Scholar]
- Gao ZG, Melman N, Erdmann A, Kim SG, Müller CE, IJzerman AP, Jacobson KA. (2003) Differential allosteric modulation by amiloride analogues of agonist and antagonist binding at A(1) and A(3) adenosine receptors. Biochem Pharmacol 65:525–534 [DOI] [PMC free article] [PubMed] [Google Scholar]
- Gao ZG, Van Muijlwijk-Koezen JE, Chen A, Müller CE, Ijzerman AP, Jacobson KA. (2001) Allosteric modulation of A(3) adenosine receptors by a series of 3-(2-pyridinyl)isoquinoline derivatives. Mol Pharmacol 60:1057–1063 [PMC free article] [PubMed] [Google Scholar]
- Göblyös A, Gao ZG, Brussee J, Connestari R, Santiago SN, Ye K, Ijzerman AP, Jacobson KA. (2006) Structure-activity relationships of new 1H-imidazo[4,5-c]quinolin-4-amine derivatives as allosteric enhancers of the A3 adenosine receptor. J Med Chem 49:3354–3361 [DOI] [PMC free article] [PubMed] [Google Scholar]
- Hansen KB, Bräuner-Osborne H. (2009) FLIPR assays of intracellular calcium in GPCR drug discovery. Methods Mol Biol 552:269–278 [DOI] [PubMed] [Google Scholar]
- Iredale PA, Alexander SP, Hill SJ. (1994) Coupling of a transfected human brain A1 adenosine receptor in CHO-K1 cells to calcium mobilisation via a pertussis toxin-sensitive mechanism. Br J Pharmacol 111:1252–1256 [DOI] [PMC free article] [PubMed] [Google Scholar]
- Jarvis MF, Wismer CT, Schweitzer E, Yu H, van Biesen T, Lynch KJ, Burgard EC, Kowaluk EA. (2001) Modulation of BzATP and formalin induced nociception: attenuation by the P2X receptor antagonist, TNP ATP and enhancement by the P2X(3) allosteric modulator, cibacron blue. Br J Pharmacol 132:259–269 [DOI] [PMC free article] [PubMed] [Google Scholar]
- Klotz KN, Hessling J, Hegler J, Owman C, Kull B, Fredholm BB, Lohse MJ. (1998) Comparative pharmacology of human adenosine receptor subtypes - characterization of stably transfected receptors in CHO cells. Naunyn Schmiedebergs Arch Pharmacol 357:1–9 [DOI] [PubMed] [Google Scholar]
- Lazareno S, Birdsall NJ. (1993) Estimation of competitive antagonist affinity from functional inhibition curves using the Gaddum, Schild and Cheng-Prusoff equations. Br J Pharmacol 109:1110–1119 [DOI] [PMC free article] [PubMed] [Google Scholar]
- Leach K, Charlton SJ, Strange PG. (2007) Analysis of second messenger pathways stimulated by different chemokines acting at the chemokine receptor CCR5. Biochem Pharmacol 74:881–890 [DOI] [PubMed] [Google Scholar]
- Macioszek VK, Kononowicz AK. (2004) The evaluation of the genotoxicity of two commonly used food colors: Quinoline Yellow (E 104) and Brilliant Black BN (E 151). Cell Mol Biol Lett 9:107–122 [PubMed] [Google Scholar]
- May LT, Leach K, Sexton PM, Christopoulos A. (2007) Allosteric modulation of G protein-coupled receptors. Annu Rev Pharmacol Toxicol 47:1–51 [DOI] [PubMed] [Google Scholar]
- Peng W, Cotrina ML, Han X, Yu H, Bekar L, Blum L, Takano T, Tian GF, Goldman SA, Nedergaard M. (2009) Systemic administration of an antagonist of the ATP-sensitive receptor P2X7 improves recovery after spinal cord injury. Proc Natl Acad Sci USA 106:12489–12493 [DOI] [PMC free article] [PubMed] [Google Scholar]
- Rhee SG. (2001) Regulation of phosphoinositide-specific phospholipase C. Annu Rev Biochem 70:281–312 [DOI] [PMC free article] [PubMed] [Google Scholar]
- Rosethorne EM, Leighton-Davies JR, Beer D, Charlton SJ. (2004) ATP priming of macrophage-derived chemokine responses in CHO cells expressing the CCR4 receptor. Naunyn Schmiedebergs Arch Pharmacol 370:64–70 [DOI] [PubMed] [Google Scholar]
- Roth AL, Marzola E, Rizzi A, Arduin M, Trapella C, Corti C, Vergura R, Martinelli P, Salvadori S, Regoli D, et al. (2006) Structure-activity studies on neuropeptide S: identification of the amino acid residues crucial for receptor activation. J Biol Chem 281:20809–20816 [DOI] [PubMed] [Google Scholar]
- Schulte G, Fredholm BB. (2002) Signaling pathway from the human adenosine A(3) receptor expressed in Chinese hamster ovary cells to the extracellular signal-regulated kinase 1/2. Mol Pharmacol 62:1137–1146 [DOI] [PubMed] [Google Scholar]
- Su X, Leon LA, Wu CW, Morrow DM, Jaworski JP, Hieble JP, Lashinger ES, Jin J, Edwards RM, Laping NJ. (2008) Modulation of bladder function by prostaglandin EP3 receptors in the central nervous system. Am J Physiol Renal Physiol 295:F984–F994 [DOI] [PubMed] [Google Scholar]
- Tranberg CE, Zickgraf A, Giunta BN, Luetjens H, Figler H, Murphree LJ, Falke R, Fleischer H, Linden J, Scammells PJ, et al. (2002) 2 Amino-3-aroyl-4,5-alkylthiophenes: agonist allosteric enhancers at human A(1) adenosine receptors. J Med Chem 45:382–389 [DOI] [PubMed] [Google Scholar]
- van den Nieuwendijk AM, Pietra D, Heitman L, Göblyös A, IJzerman AP. (2004) Synthesis and biological evaluation of 2,3,5-substituted [1,2,4]thiadiazoles as allosteric modulators of adenosine receptors. J Med Chem 47:663–672 [DOI] [PubMed] [Google Scholar]
- van der Klein PA, Kourounakis AP, IJzerman AP. (1999) Allosteric modulation of the adenosine A(1) receptor. Synthesis and biological evaluation of novel 2- amino-3-benzoylthiophenes as allosteric enhancers of agonist binding. J Med Chem 42:3629–3635 [DOI] [PubMed] [Google Scholar]
- Yan L, Burbiel JC, Maass A, Müller CE. (2003) Adenosine receptor agonists: from basic medicinal chemistry to clinical development. Expert Opin Emerg Drugs 8:537–576 [DOI] [PubMed] [Google Scholar]
- Yoshioka N, Ichihashi K. (2008) Determination of 40 synthetic food colors in drinks and candies by high-performance liquid chromatography using a short column with photodiode array detection. Talanta 74:1408–1413 [DOI] [PubMed] [Google Scholar]