

Abstract
The transcription factor nuclear factor erythroid 2-related factor 2 (Nrf2) induces a battery of cytoprotective genes after oxidative stress. Nrf2 aids in liver regeneration by altering insulin signaling; however, whether Nrf2 participates in hepatic glucose homeostasis is unknown. Compared with wild-type mice, mice lacking Nrf2 (Nrf2-null) have lower basal serum insulin and prolonged hyperglycemia in response to an intraperitoneal glucose challenge. In the present study, blood glucose, serum insulin, urine flow rate, and hepatic expression of glucose-related genes were quantified in male diabetic wild-type and Nrf2-null mice. Type 1 diabetes was induced with a single intraperitoneal dose (200 mg/kg) of streptozotocin (STZ). Histopathology and serum insulin levels confirmed depleted pancreatic β-cells in STZ-treated mice of both genotypes. Five days after STZ, Nrf2-null mice had higher blood glucose levels than wild-type mice. Nine days after STZ, polyuria occurred in both genotypes with more urine output from Nrf2-null mice (11-fold) than wild-type mice (7-fold). Moreover, STZ-treated Nrf2-null mice had higher levels of serum β-hydroxybutyrate, triglycerides, and fatty acids 10 days after STZ compared with wild-type mice. STZ reduced hepatic glycogen in both genotypes, with less observed in Nrf2-null mice. Increased urine output and blood glucose in STZ-treated Nrf2-null mice corresponded with enhanced gluconeogenesis (glucose-6-phosphatase and phosphoenolpyruvate carboxykinase)- and reduced glycolysis (pyruvate kinase)-related mRNA expression in their livers. Furthermore, the Nrf2 activator oltipraz lowered blood glucose in wild-type but not Nrf2-null mice administered STZ. Collectively, these data indicate that the absence of Nrf2 worsens hyperglycemia in type I diabetic mice and Nrf2 may represent a therapeutic target for reducing circulating glucose levels.
Type I diabetes is a disease characterized by chronic hyperglycemia resulting from a deficiency in insulin secretion. Persistent hyperglycemia in diabetic patients causes endothelial cell dysfunction and complications within the retina, kidneys, and vasculature. Because of the indispensable function of the pancreas in insulin secretion, animal models of type I diabetes involve the removal of the pancreas or destruction of insulin-producing β-cells of the pancreas using streptozotocin (STZ) (Like and Rossini, 1976; Rees and Alcolado, 2005). The STZ-induced model of type I diabetes is a classic method for investigating novel therapeutic modalities and gene profiling of glucose- and fatty acid-gene pathways.
Oxidative stress is a consequence of high circulating glucose levels in diabetic patients and rodents (Forbes et al., 2008). In vitro incubation of cardiomyocytes with high concentrations of glucose stimulates reactive oxygen species production (He et al., 2009). Several signaling pathways, most notably those controlled by the nuclear factor erythroid 2-related factor 2 (Nrf2) transcription factor, are activated in response to oxidative stress to counteract accumulating reactive oxygen species and electrophiles (for review, see Aleksunes and Manautou, 2007). Under unstressed conditions, Nrf2 is sequestered in the cytoplasm by the repressor protein Kelch-like ECH-associated protein 1 and targeted for proteasomal degradation (Itoh et al., 1999). In response to pharmacological activation or oxidative stress, Nrf2 translocates to the nucleus where it activates transcription of a large battery of genes by binding to antioxidant response elements in upstream promoter regions (Friling et al., 1990; Rushmore et al., 1991). Targets of Nrf2 transcription include proteins involved in drug metabolism, antioxidant response, and proteasomal degradation.
High glucose concentrations activate Nrf2 signaling in cardiomyocytes (He et al., 2009). In response to glucose exposure, cardiomyocytes lacking Nrf2 have slightly higher generation of reactive oxygen species and more apoptosis, as well as greater functional deficits in contractility than wild type (WT; He et al., 2009). These studies point to a role for Nrf2 in mitigating oxidative stress generated during hyperglycemic conditions in vitro. However, there is little information regarding how Nrf2 affects glucose handling under naïve conditions in vivo, as well as how Nrf2 influences the hepatic regulation of glucose, glycogen, and fatty acid pathways during hyperglycemia.
Nrf2-null mice are a useful model for investigating how deficiencies in this transcription factor influence susceptibility of the liver to chemical-induced toxicities (Enomoto et al., 2001; Xu et al., 2008), as well as dietary (Tanaka et al., 2008) and surgical interventions (Beyer et al., 2008). After a high-fat diet, livers from Nrf2-null mice demonstrate higher lipid peroxidation and dysregulation of lipid-related pathways compared with wild-type mice (Tanaka et al., 2008). Nrf2-null mice also have delayed liver regeneration after partial hepatectomy due to deficiencies in insulin signaling (Beyer et al., 2008). These studies demonstrate a critical role for Nrf2 in protecting the liver from stress probably by coordinately regulating expression of genes in cytoprotective and metabolic (e.g., insulin and fatty acid) pathways.
Peripheral tissues such as liver are important in regulating glucose homeostasis. Gluconeogenic enzymes, such as glucose-6-phosphatase and phosphoenolpyruvate carboxykinase (PEPCK) synthesize glucose, whereas glycolytic enzymes such as glucokinase, liver-type pyruvate kinase, and 6-phosphofructo-2-kinase catabolize glucose (for review, see Foufelle and Ferré, 2002). In addition, the metabolism of glycogen, fatty acids, and cholesterol are important in regulating glucose. Elevated glucose levels contribute to higher hepatic acetyl CoA and fatty acid levels (Foufelle and Ferré, 2002; Morral et al., 2007). Therefore, changes in expression of genes responsible for fatty acid metabolism and transport (and their upstream transcription factors) reflect an attempt by the liver to lower the body burden of high glucose and fatty acids (Foufelle and Ferré, 2002; Weickert and Pfeiffer, 2006; Morral et al., 2007). Fatty acid synthesis and transport genes include stearoyl-CoA desaturase 1, fatty acid synthase; fatty acid translocase (also known as CD36); and malic enzyme, and their upstream regulatory transcription factors include the peroxisome proliferator-activated receptor (PPAR) γ, PPARγ coactivator (PGC)-1α, carbohydrate-responsive element-binding protein (chREBP), and sterol regulatory element-binding protein 1c (SREBP-1c).
Presently, it is unknown whether absence of Nrf2 alters compensatory responses of the liver to persistent hyperglycemia. To address this question, we used two different models of hyperglycemia in wild-type and Nrf2-null mice: bolus glucose administration and STZ-induced diabetes. The purposes of the current studies were to determine 1) whether naïve Nrf2-null mice have altered glucose handling, 2) whether the absence of Nrf2 can alter the hepatic gene expression and phenotype profiles of type I diabetic mice, and 3) whether pharmacological activation of Nrf2 can reduce hyperglycemia in diabetic mice.
Materials and Methods
Chemicals.
Unless otherwise specified, all chemicals were obtained from Sigma-Aldrich (St. Louis, MO).
Animals.
Male C57BL/6 mice (WT) were purchased from Charles River Laboratories, Inc. (Wilmington, MA) and allowed to acclimate for at least 72 h. Breeding pairs of Nrf2-null mice were obtained from Dr. Jefferson Chan (University of California Irvine, Irvine, CA) and backcrossed with C57BL/6 mice until they were 99% congenic (confirmed by The Jackson Laboratory, Bar Harbor, ME). Mice were fed Teklad Rodent Diet 8604 (Harlan, Madison, WI) and allowed access to water ad libitum unless otherwise noted. All mice were housed in an Association for Assessment and Accreditation of Laboratory Animal Care-accredited animal care facility in temperature-, light-, and humidity-controlled rooms. The University of Kansas Medical Center Institutional Animal Care and Use Committee approved the studies.
Feed Deprivation and Glucose/Insulin Tolerance Test.
Glucose and insulin tolerance tests were conducted in feed-deprived (overnight for glucose tolerance test; 4 h for insulin tolerance test) male wild-type and Nrf2-null mice (10–12 weeks old). For the glucose tolerance test, a single dose of d-glucose (20% solution in water; 10 ml/kg) was injected intraperitoneally. For the insulin tolerance test, a single dose of normal insulin (Humulin N) (0.75 U/kg; 5 ml/kg in saline) was injected intraperitoneally. Humulin N was purchased from CVS Pharmacy (Mission, KS). Blood (less than 25 μl) was obtained at −15, 15, 30, 60, 120, 180, and 240 min from the tail, and glucose was quantified using a One Touch Ultra2 glucose monitor (Lifescan, Inc., Milpitas, CA). After glucose and insulin tolerance tests, feed was returned to the cages and mice were allowed to recover.
Type I Diabetes.
STZ was dissolved in citrate buffer (0.1 M; pH 4.5) and mixed immediately before use. Male wild-type and Nrf2-null mice (8–10 weeks old) received a single intraperitoneal injection of either citrate buffer vehicle (5 ml/kg) or STZ (200 mg/kg). Body weight and blood glucose were monitored for the duration of study. Blood was obtained on days −1, 1, 3, 5, 7, 9, and 10 from the tail and glucose was quantified (between 9:00 and 11:00 AM). Mice were considered diabetic when blood glucose levels exceeded 250 mg/dl. Nondiabetic mice were excluded from subsequent analysis (final n = 4–6). If glucose readings exceeded the detection limit of the glucometer (600 mg/dl), blood from all STZ-treated mice were diluted 1:1 with sterile saline, and subsequent readings were adjusted using the dilution factor. On day 9, three mice per treatment group were placed in metabolic cages, and urine was collected for 6 h. Urine volume was normalized to animal weight to calculate urinary flow rate. On day 10, mice were euthanized with an overdose of sodium pentobarbital (50 mg/kg i.p.). All tissues were collected between 9:00 and 11:00 AM to minimize the effect of diurnal fluctuations. Blood was collected by cardiac puncture, fractionated for serum, and stored at −80°C until assayed. Portions of pancreas and liver for histological evaluation and immunohistochemistry were fixed in 10% formalin for 48 h, transferred to 70% ethanol for 48 h, and embedded in paraffin blocks for sectioning. The remaining liver was frozen in liquid nitrogen and stored at −80°C.
Oltipraz Administration.
Citrate buffer or STZ was administered to male wild-type and Nrf2-null mice as described above. Corn oil (5 ml/kg) or oltipraz (150 mg/kg) (LKT Labs, St. Paul, MN) was injected intraperitoneally on days 0.5 (12 h after STZ injection), 2, 4, 6, and 8. Blood glucose levels were quantified as described above.
Serum Analytes.
Serum insulin was quantified using an enzyme-linked immunosorbent assay kit from Linco Research (St. Louis, MO). Serum free-cholesterol, nonesterified fatty acids, and triglycerides were quantified using colorimetric assays from Wako Chemicals (Richmond, VA). Serum β-hydroxybutyrate was quantified using a colorimetric assay from Stanbio Laboratory (Boerne, TX). All assays were performed according to the manufacturers' protocols.
Histopathology.
Paraffin-embedded liver and pancreas sections (5 μm) were stained with hematoxylin and eosin using standard protocols and examined for histopathological changes by a board-certified veterinary pathologist. The area of pancreatic islets was quantified by Image-Pro Plus version 6.2 software (Media Cybernetics, Inc., Bethesda, MD), and the percentage of islet was calculated as the area of islet divided by the total area of tissue.
Insulin Immunohistochemistry and Periodic Acid-Schiff Staining.
Immunostaining for insulin was performed on paraffin-embedded pancreas sections (5 μm) from control wild-type and Nrf2-null mice. In brief, slides underwent deparaffinization, antigen retrieval, and avidin/biotin blocking as well as peroxidase blocking. Slides were blocked for 1 h with 5% normal goat serum (ab7481; Abcam Inc., Cambridge, MA) and then incubated with an anti-insulin antibody (ab7842; Abcam Inc.) diluted 1:100 in 1% normal goat serum. After washing, slides were incubated with an anti-guinea pig AlexaFluor 488 antibody (Invitrogen, Carlsbad, CA) diluted 1:200 in 1% normal goat serum. Sections were mounted in Prolong Gold containing 4′,6-diamidino-2-phenylindole (Invitrogen), which stains nuclei.
Periodic acid-Schiff (PAS) staining of glycogen was performed on liver cryosections (5 μm). Sections were fixed with 4% paraformaldehyde for 5 min, followed by incubation in Schiff reagent for 15 min, and counterstained with hematoxylin. Insulin and PAS staining was visualized on an Olympus BX41 microscope (Olympus Optical, Tokyo, Japan). Images were captured using a DP70 camera and DP Controller software (Olympus Optical).
RNA Isolation.
Total RNA was isolated from frozen livers using RNA-Bee reagent (Tel-Test Inc., Friendswood, TX) according to the manufacturer's protocol. The concentration of total RNA in each sample was quantified spectrophotometrically at 260 nm, and purity was confirmed by 260/280 nm ratio. RNA integrity was assessed by formaldehyde-agarose gel electrophoresis with visualization of 18S and 28S rRNA bands.
Messenger RNA Quantification.
Liver mRNA expression was determined by the QuantiGene Plex 2.0 Reagent System (Panomics Inc., Fremont, CA). Individual bead-based oligonucleotide probe sets specific for each gene examined were developed by Panomics Inc. The following Panomics Plex sets were used (and are freely available at http://www.panomics.com): 21076 (oxidative stress), 21072 (glucose), and 21064 (fatty acid). Ribosomal protein L13A mRNA expression was used as an internal control for each sample. Samples were analyzed by using a Bio-Plex System Array reader with Luminex 100 xMAP technology, and data were acquired using Bio-Plex Data Manager software version 5.0 (Bio-Rad Laboratories, Hercules, CA). Assays were performed according to the manufacturer's protocol (Panomics Inc.). In brief, 0.5 μg (panels 21072 and 21076) or 1 μg (panel 21072) of total RNA was incubated overnight at 53°C with X-MAP beads containing oligonucleotide capture probes, label extenders, and blockers. The next day, beads and bound target RNA were washed and subsequently incubated with preamplifier at 46°C for 1 h. Next, samples were washed and incubated with amplifier at 46°C for 1 h. Samples were washed again and incubated with label probe (biotin) at 46°C for 1 h. Samples were washed again and incubated with streptavidin-conjugated R-phycoerythrin, which binds biotinylated probes, at room temperature for 30 min. Streptavidin-conjugated R-phycoerythrin fluorescence was then detected for each analyte within each sample. All data were standardized to the internal control ribosomal protein L13A and normalized to wild-type control mice.
Branched DNA Signal Amplification Assay.
The mRNA expression of mouse PGC-1α, PPARγ, and SREBP-1 was quantified using the branched signal amplification assay with modifications (QuantiGene, High Volume Branched DNA Signal Amplification kit; Panomics, Fremont, CA) (Hartley and Klaassen, 2000). Multiple oligonucleotide probe sets (containing capture, label, and blocker probes) (Supplemental Table 1) specific to mouse SREBP-1 mRNA transcripts were designed using ProbeDesigner software version 1.0 (Bayer Corp., Emeryville, CA).
Western Blot Analysis.
NAD(P)H quinone oxidoreductase 1 (Nqo1) expression was determined in cytosolic extracts, prepared with the NE-PER nuclear extraction kit according to the manufacturer (Pierce Chemical, Rockford, IL). Protein concentrations were determined by the bicinchoninic acid assay (Pierce Chemical). Cytosolic proteins (40 μg/lane) were electrophoretically resolved using polyacrylamide gels (12% resolving; 4% stacking). Gels were transblotted overnight at 4°C onto polyvinylidene fluoride membrane. Nqo1 and β-actin antibodies were purchased from Abcam Inc. (ab2346 and ab8227, respectively). Western blot staining was performed as described previously (Aleksunes et al., 2008). Equal protein loading was confirmed by β-actin. Nqo1 and β-actin were observed at approximately 32 and 45 kDa, respectively. The Discovery Series Quantity One 1-D Analysis software (Bio-Rad Laboratories) was used to quantify the intensity of protein bands. Individual blot densities were normalized to wild-type controls.
Statistical Analysis.
The software program Prism version 4 (GraphPad Software Inc., San Diego, CA) was used for statistical analysis. Differences among individual groups were evaluated by one-way analysis of variance followed by Tukey's multiple comparison test. Differences were considered statistically significance at p < 0.05.
Results
Blood Glucose as Well as Serum and Pancreatic Insulin in Wild-Type and Nrf2-Null Mice.
Blood glucose levels were similar in naive wild-type and Nrf2-null mice (Fig. 1A). Likewise, overnight feed-deprivation of wild-type and Nrf2-null mice slightly reduced blood glucose to a similar degree (Fig. 1A). Serum insulin levels were 45% lower in naive (fed) Nrf2-null mice, although not statistically significant (p = 0.1) (Fig. 1B). Immunohistochemical staining of insulin (green) was similar in pancreatic sections of wild-type and Nrf2-null mice (Fig. 1C).
Fig. 1.

Blood glucose and serum and pancreatic insulin in wild-type and Nrf2-null mice. A, blood glucose levels in fed and fasted WT and Nrf2-null mice. B, serum insulin levels in naive (fed) WT and Nrf2-null mice. C, indirect immunofluorescent staining of insulin (green) in paraffin-embedded pancreatic sections (5 μm) from WT and Nrf2-null mice. Nuclei are stained with 4′,6-diamidino-2-phenylindole (blue). Magnification, 400×. D, serial blood glucose levels in WT and Nrf2-null mice after a bolus intraperitoneal injection of 20% glucose. Data are presented as mean ± S.E. (n = 3–6). Black bars represent wild-type mice, and gray bars represent Nrf2-null mice. Asterisks (∗) represent statistically significant differences (p < 0.05) compared with baseline glucose levels (−15 min) for each genotype. Daggers (†) represent a statistically significant difference (p < 0.05) between wild-type and Nrf2-null mice at that time point.
Glucose and Insulin Tolerance of Wild-Type and Nrf2-Null Mice.
To characterize basal differences in glucose handling of wild-type and Nrf2-null mice, feed-deprived mice were administered a single intraperitoneal dose of glucose, and blood glucose was quantified from 15 through 240 min. By 15 min, blood glucose levels were increased 2.2- and 2.9-fold in wild-type and Nrf2-null mice, respectively (Fig. 1D). Blood glucose levels returned to baseline by 60 min in wild-type mice but remained elevated 2.4-fold in Nrf2-null mice. It was not until 180 min that blood glucose levels of Nrf2-null mice returned to pretreatment levels.
In a similar experiment, another set of feed-deprived wild-type and Nrf2-null mice was injected with a single intraperitoneal dose of insulin, and blood glucose was quantified from 15 through 240 min. Insulin treatment reduced blood glucose levels in wild-type and Nrf2-null mice to approximately 50% of pretreatment levels between 15 and 60 min (data not shown). No differences in blood glucose levels were observed between genotypes at any time point.
Concentration of Blood Glucose and Urinary Flow Rate in Wild-Type and Nrf2-Null Mice after STZ.
To determine whether the absence of Nrf2 alters glucose handling in diabetic mice, wild-type mice and Nrf2-null mice were administered a single intraperitoneal dose of STZ (200 mg/kg) and evaluated for 10 days. Control wild-type and Nrf2-null mice injected with citrate vehicle had similar glucose levels throughout the 10-day study (wild type, 141–227 mg/dl; Nrf2-null, 165–198 mg/dl). STZ increased blood glucose levels to a similar extent in wild-type and Nrf2-null mice at 3 days (Fig. 2A). Between 5 and 7 days, blood glucose was significantly increased in both genotypes. Blood glucose levels increased 2-fold in STZ-treated wild-type mice, whereas levels were elevated to an even greater extent (4-fold) in STZ-treated Nrf2-null mice. At 10 days after STZ, blood glucose was similarly elevated in wild-type and Nrf2-null mice. Of note, blood glucose was unchanged over 10 days in wild-type and Nrf2-null mice treated with a lower dose of STZ (100 mg/kg) (data not shown).
Fig. 2.

Blood glucose and urinary flow rate of wild-type and Nrf2-null mice after STZ. A, blood glucose levels in STZ-treated wild-type and Nrf2-null mice from days −1 to 10. STZ was administered on day 0. Day −1 blood glucose levels represent pretreatment values. Black bars represent wild-type mice, and gray bars represent Nrf2-null mice. Data are presented as mean ± S.E. (n = 4–6). Asterisks (∗) represent statistically significant differences (p < 0.05) compared with control mice for each genotype. Daggers (†) represent a statistically significant difference (p < 0.05) between wild-type and Nrf2-null mice at that time point. B, urinary flow rate of control and STZ-treated WT and Nrf2-null mice on day 9. Urine volume was quantified from three mice per group housed in a single metabolic cage (pooled urine) for 6 h and normalized to body weight and time. Black bars represent wild-type mice, and gray bars represent Nrf2-null mice.
Urine was collected from control and STZ-treated wild-type and Nrf2-null mice in metabolism cages on day 9 (Fig. 2B). Urine flow rates were similar between control wild-type and Nrf2-null mice. STZ increased urine flow in both genotypes, with higher levels in Nrf2-null mice (11-fold) compared with wild-type mice (7-fold).
Serum Insulin and Pancreas Histopathology in Wild-Type and Nrf2-Null Mice after STZ.
To determine whether higher glucose levels in STZ-treated Nrf2-null mice were due to differences in susceptibility of wild-type and Nrf2-null β-cells, serum insulin and pancreatic islet area were quantified at 10 days. Consistent with Fig. 1B, serum insulin levels were 56% lower in control Nrf2-null mice compared with wild-type mice, although not statistically significant (Fig. 3A). STZ reduced serum insulin to a similar concentration in wild-type and Nrf2-null mice.
Fig. 3.

Serum insulin and pancreatic histopathology in wild-type and Nrf2-null mice after STZ. A, serum insulin was quantified in control and STZ-treated wild-type and Nrf2-null mice on day 10 (n = 4–6). B, quantification of pancreatic islet area. Pancreatic sections (5 μm) were stained with hematoxylin and eosin. The percentage islet was calculated as the area of islet divided by the total area of tissue. Data are presented as mean ± S.E. Black bars represent wild-type mice, and gray bars represent Nrf2-null mice. Asterisks (∗) represent statistically significant differences (p < 0.05) compared with control mice of that genotype. C, histological morphology of pancreas sections from control and STZ-treated wild-type and Nrf2-null mice are shown. Magnification, 200×.
Histopathological and morphometric analyses demonstrated normal lobules of pancreatic acini and similar pancreatic islet area (Fig. 3, B and C) in control wild-type and Nrf2-null mice. STZ markedly reduced the total islet area similarly within pancreas sections from both wild-type and Nrf2-null mice. The serum insulin and pancreas histopathology were consistent with near-complete β-cell depletion in STZ-treated wild-type and Nrf2-null mice.
Serum Ketones, Triglycerides, Nonesterified Fatty Acids, and Cholesterol in Wild-Type and Nrf2-Null Mice after STZ.
No basal differences in serum β-hydroxybutyrate, triglycerides, and nonesterified fatty acids were observed between wild-type and Nrf2-null mice (Fig. 4). A trend of 33% lower total cholesterol was observed in Nrf2-null mice. Additional analysis of serum cholesterol in naive wild-type and Nrf2-null mice demonstrated significantly lower levels of high- and low-density lipoproteins of Nrf2-null mice compared with wild-type mice (data not shown). STZ slightly increased serum β-hydroxybutyrate (3.5-fold) and cholesterol (1.5-fold) in wild-type mice at 10 days, although not statistically significant (Fig. 4). No changes in serum triglycerides or nonesterified fatty acids were observed in STZ-treated wild-type mice. However, in Nrf2-null mice, STZ markedly elevated β-hydroxybutyrate (4.7-fold), triglycerides (9.4-fold), nonesterified fatty acids (2.4-fold), and cholesterol (2.2-fold) at 10 days.
Fig. 4.

Serum analytes in wild-type and Nrf2-null mice after STZ. Serum β-hydroxybutyrate, triglycerides, nonesterified fatty acids, and cholesterol were quantified in control and STZ-treated wild-type and Nrf2-null mice on day 10. Data are presented as mean ± S.E. (n = 3–6). Black bars represent wild-type mice, and gray bars represent Nrf2-null mice. Asterisks (∗) represent statistically significant differences (p < 0.05) compared with control mice of that genotype. Daggers (†) represent a statistically significant difference (p < 0.05) from STZ-treated WT mice.
Hepatic Glycogen Staining in Wild-Type and Nrf2-Null Mice after STZ.
Glycogen staining was performed on frozen liver sections from control and STZ-treated wild-type and Nrf2-null mice at 10 days (Fig. 5). Liver sections from control wild-type and Nrf2-null mice had glycogen staining (dark pink) predominantly in hepatocytes surrounding central veins. STZ reduced glycogen staining in both genotypes, with more marked depletion in livers of Nrf2-null mice.
Fig. 5.

Hepatic glycogen staining in wild-type and Nrf2-null mice after STZ. Periodic acid-Schiff staining for glycogen (dark pink) was performed on hepatic cryosections (5 μm) from control and STZ-treated wild-type and Nrf2-null mice on day 10. Magnification, 200×.
Serum Alanine Aminotransferase Levels and Liver Histology in Wild-Type and Nrf2-Null Mice after STZ.
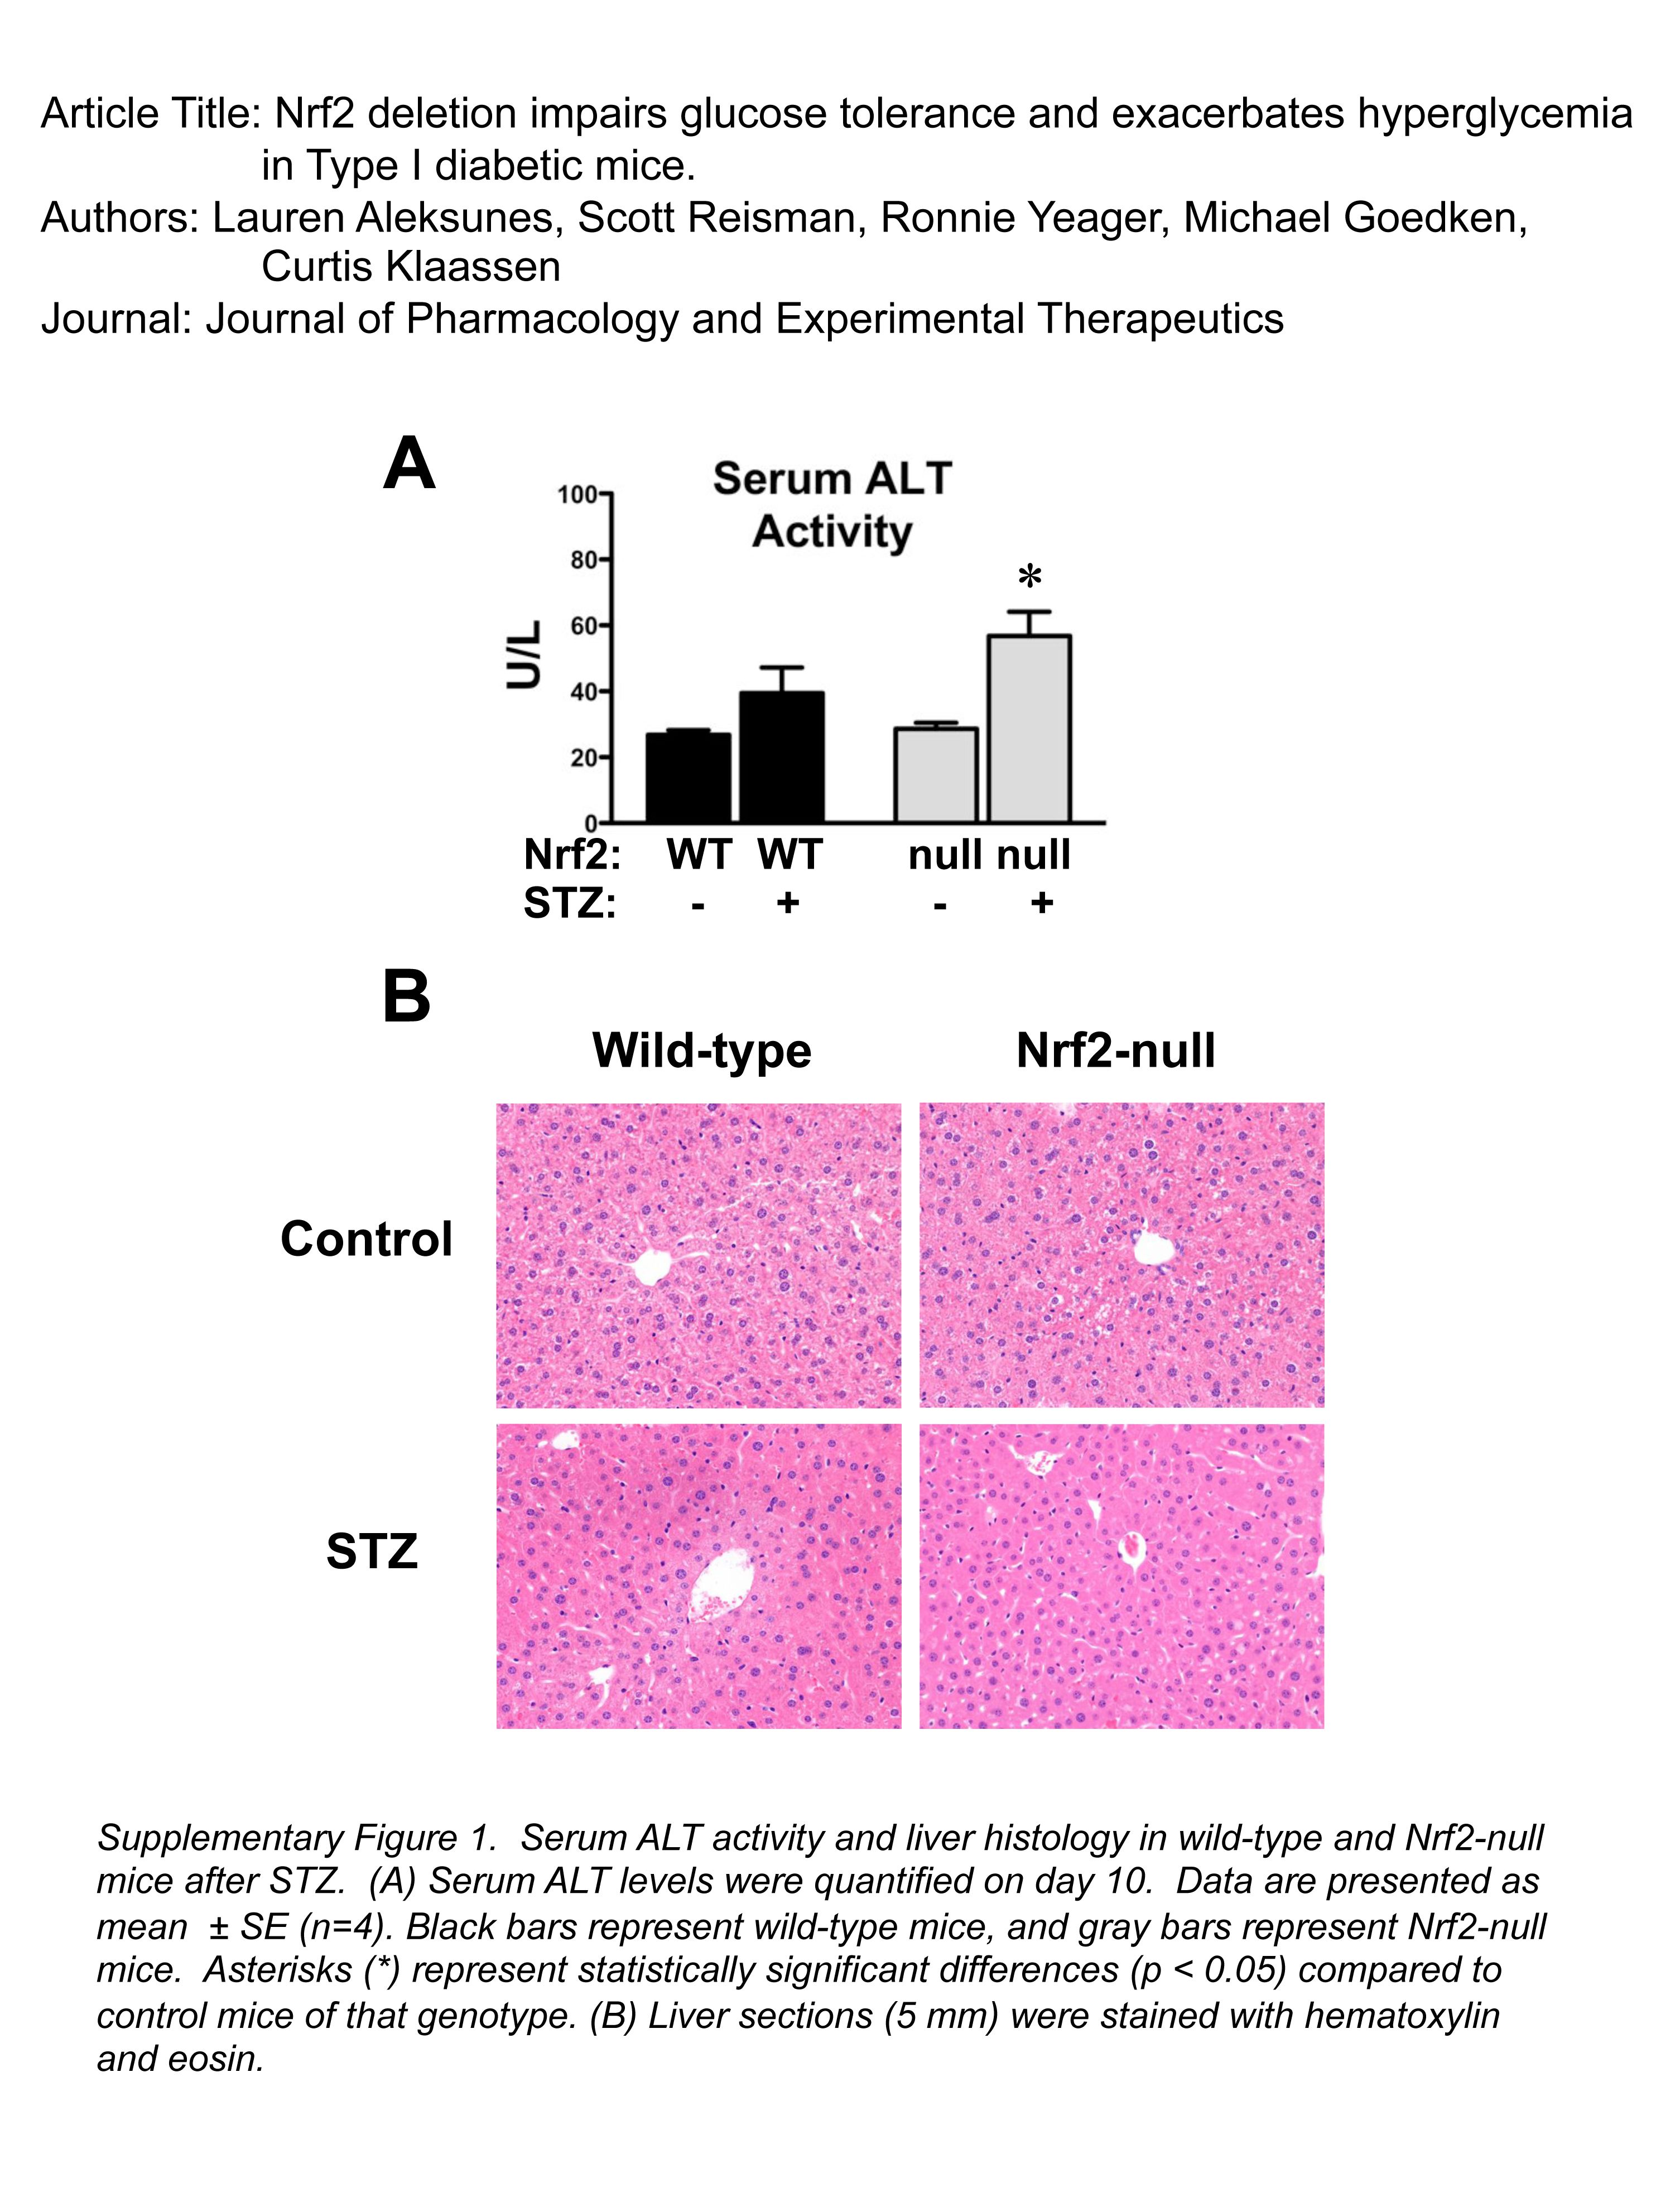
Hepatic injury was assessed by serum alanine aminotransferase (ALT) and histopathological evaluation of liver sections from STZ-treated wild-type and Nrf2-null mice (Supplemental Fig. 1). STZ increased serum ALT levels slightly in wild-type (1.5-fold) and Nrf2-null (2-fold) mice, although only the elevation in Nrf2-null mice was statistically significant. Histopathological analysis revealed normal liver histology in vehicle-treated wild-type and Nrf2-null mice as well as STZ-treated wild-type mice. There was minimal cell swelling characterized by small numbers of scattered centrilobular to midzonal hepatocytes with perinuclear cytoplasmic pallor in livers of some STZ-treated Nrf2-null mice. Hepatocyte proliferation was also evident in STZ-treated Nrf2-null mice. Neither hepatocyte necrosis nor inflammation was observed in any group.
Hepatic mRNA Expression of Nrf2 and Target Gene Nqo1 in Wild-Type and Nrf2-Null Mice after STZ.
The liver is important for regulating both circulating and stored glucose levels. Because STZ increased blood glucose and reduced hepatic glycogen to a greater extent in Nrf2-null mice, additional studies were conducted to determine whether STZ activates hepatic Nrf2. STZ increased hepatic mRNA expression of Nrf2 (1.9-fold) and its target gene Nqo1 (3.6-fold) in wild-type mice (Fig. 6A). Moreover, STZ increased Nqo1 protein levels (2.8-fold) in livers from wild-type mice (Fig. 6B). No significant changes in Nqo1 mRNA or protein were observed in livers from Nrf2-null mice.
Fig. 6.

Hepatic mRNA and protein expression of Nrf2 and target gene Nqo1 in wild-type and Nrf2-null mice after STZ. A, messenger RNA expression of Nrf2 and Nqo1 were quantified using total hepatic RNA from control and STZ-treated wild-type and Nrf2-null mice on day 10. B, Western immunoblots were performed using the cytosol fraction from control and STZ-treated wild-type and Nrf2-null mice on day 10. Western blot data were quantified. Data were normalized to wild-type controls and presented as mean relative expression ± S.E. Black bars represent wild-type mice, and gray bars represent Nrf2-null mice. Asterisks (∗) represent statistically significant differences (p < 0.05) compared with control mice of that genotype. Daggers (†) represent a statistically significant difference (p < 0.05) between wild-type and Nrf2-null mice with the same treatment.
Hepatic mRNA Expression of Glucose- and Glycogen-Related Genes in Wild-Type and Nrf2-Null Mice after STZ.
Glucose homeostasis is regulated by transport into peripheral tissues such as liver, gluconeogenesis and glycolysis signaling, as well as glycogen turnover. To determine whether hepatic mRNA expression profiles corresponded with the enhanced hyperglycemic phenotype observed in STZ-treated Nrf2-null mice, the mRNA expression of critical genes was quantified (Fig. 7). No significant differences in the hepatic glucose uptake transporter Glut2 were observed in livers of control and STZ-treated wild-type and Nrf2-null mice (data not shown).
Fig. 7.

Hepatic mRNA expression of glucose- and fatty acid-related genes in wild-type and Nrf2-null mice after STZ. Total RNA isolated from livers of control and STZ-treated wild-type and Nrf2-null mice on day 10 were evaluated for mRNA expression of gluconeogenesis genes glucose-6-phosphatase and PEPCK (A); glycolysis genes glucokinase and liver-type pyruvate kinase (B); and fatty acid synthesis/metabolism genes stearoyl-CoA desaturase-1, malic enzyme-1, fatty acid synthase, and fatty acid translocase (CD36) (C). Data were normalized to wild-type controls and presented as mean relative expression ± S.E. (n = 3–6). Black bars represent wild-type mice, and gray bars represent Nrf2-null mice. Asterisks (∗) represent statistically significant differences (p < 0.05) compared with control mice of that genotype. Daggers (†) represent a statistically significant difference (p < 0.05) between wild-type and Nrf2-null mice with the same treatment.
Two gluconeogenesis genes, glucose-6-phosphatase and PEPCK, were quantified in control and STZ-treated wild-type and Nrf2-null mice. The basal expression of these genes was similar between genotypes. STZ increased glucose-6-phosphatase mRNA 2.8-fold in Nrf2-null mice, with no change in wild-type mice (Fig. 7A). PEPCK mRNA was similarly elevated 1.6- to 1.8-fold in both genotypes after STZ (Fig. 7A). Elevated expression of glucose-6-phosphatase and PEPCK are consistent with hyperglycemia, particularly in STZ-treated Nrf2-null mice.
Three glycolysis genes, glucokinase, liver-type pyruvate kinase, and 6-phosphofructo-2-kinase, were quantified in control and STZ-treated wild-type and Nrf2-null mice. Although constitutive glucokinase levels were similar between genotypes, liver-type pyruvate kinase mRNA was 54% lower in Nrf2-null mice (Fig. 7B). STZ significantly decreased glucokinase mRNA expression in both genotypes. Similarly, STZ reduced liver-type pyruvate kinase mRNA 50 to 60% in both genotypes, with the lowest levels in Nrf2-null mice. In contrast, mRNA expression of 6-phosphofructo-2-kinase was similar among the treatment groups (data not shown; summarized in Table 1).
TABLE 1.
Summary of STZ-induced mRNA changes in wild-type and Nrf2-null mice
| Wild Type | Nrf2-Null | |
|---|---|---|
| Glucose uptake/synthesis | ||
| Glut2 transporter | ↔ | ↔ |
| Glucose-6-phosphatase | ↔ | ↑ |
| PEPCK | ? | ↑ |
| Glycolytic enzymes | ||
| Glucokinase | ↓ | ↓ |
| Pyruvate kinase liver-type | ↓ | ↔ (↓)* |
| 6-Phosphofructo-2-kinase | ↔ | ↔ |
| Glycogen synthesis/metabolism | ||
| Glycogen synthase 2 | ↔ | ↔ |
| Glycogen phosphorylase | ↔ | ↔ |
| Fatty acid uptake/synthesis | ||
| Steroyl-CoA desaturase 1 | ↓ | ⇊ |
| Fatty acid synthase | ↔ | ↓ |
| Fatty acid translocase (CD36) | ↔ | ↑ |
| Malic enzyme | ↓ | ↔ (↓)* |
| Acetyl-coenzyme A carboxylase | ↔ | ↔ |
| Fatty acid elongase | ↔ | ↔ |
| Fatty acid metabolism/export | ||
| Carnitine palmitoyltransferase 1 | ↔ | ↔ |
| Malonyl-CoA decarboxylase | ↔ | ↔ |
| Acyl-coenzyme A oxidase 1 | ↔ | ↔ |
| Cholesterol and lipoprotein-related metabolism/transport | ||
| Scavenger receptor B1 | ↔ | ↑ |
| Lecithin-cholesterol acyltransferase | ↔ | ↑ |
| Low-density lipoprotein receptor-related protein 1 | ↔ | ↔ |
| 3-Hydroxy-3-methylglutaryl-CoA reductase | ↔ | ↔ |
| 3-Hydroxy-3-methylglutaryl-CoA synthase | ↔ | ↔ |
| ATP-binding cassette transporter A1 | ↔ | ↔ |
| Microsomal triglyceride transfer protein | ↔ | ↔ |
| Apolipoprotein A1 | ↔ | ↔ |
| Apolipoprotein B1 | ↔ | ↔ |
| Apolipoprotein E | ↔ | ↔ |
| Low-density lipoprotein receptor | ↔ | ↔ |
(↓)* designates genes that are basally lower in Nrf2-null mice.
Because hepatic glycogen storage was reduced in mouse liver by STZ (more notably, in Nrf2-null livers; Fig. 5), the mRNA expression of the glycogen synthesis gene glycogen synthase 2 and the glycogen breakdown gene glycogen phosphorylase were quantified. Levels of glycogen synthase 2 and glycogen phosphorylase were not changed by STZ in either genotype (data not shown; summarized in Table 1).
Hepatic mRNA Expression of Fatty Acid-Related Genes in Wild-Type and Nrf2-Null Mice after STZ.
Compared with wild-type mice, Nrf2-null mice also exhibited higher levels of serum fatty acids, β-hydroxybutyrate, triglycerides, as well as cholesterol in response to STZ (Fig. 4). Because elevated glucose levels can contribute to higher acetyl CoA levels and fatty acids as well as triglycerides and ketones (Foufelle and Ferré, 2002; Morral et al., 2007), the expression of genes involved in fatty acid synthesis and metabolism was quantified in wild-type and Nrf2-null mice after STZ. Compared with wild-type mice, the basal expression of stearoyl-CoA desaturase 1 and malic enzyme-1 in livers of Nrf2-null mice was higher and lower, respectively (Fig. 7C). In response to STZ, mRNA levels of stearoyl-CoA desaturase-1 decreased 95% in livers from wild-type and Nrf2-null mice. Likewise after STZ, the expression of malic enzyme-1 declined 40% in wild-type but not in Nrf2-null mice. Instead, Nrf2-null mice exhibited 65% lower expression of fatty acid synthase and 291% higher expression of fatty acid translocase (CD36) in response to STZ.
Hepatic mRNA Expression of Transcription Factors in Wild-Type and Nrf2-Null Mice after STZ.
To delineate the signaling pathways involved in regulating the expression of gluconeogenesis, glycolysis, and fatty acid genes, the mRNA levels of transcription factors were quantified in control and STZ-treated wild-type and Nrf2-null mice (Fig. 8). Compared with wild-type mice, Nrf2-null mice expressed lower constitutive mRNA levels of PPARγ (31% of wild type) and chREBP (71% of wild type). STZ differentially regulated the expression of several hepatic transcription factors known to be involved in regulating glucose pathways. STZ increased PGC-1α levels 4.5-fold in Nrf2-null mice, with no significant change in livers of wild-type mice. In contrast to PGC-1α, STZ reduced chREBP and SREBP-1c to similar extents in both genotypes. Although not statistically significant, PPARγ tended to be decreased by STZ in both wild-type and Nrf2-null mice. Furthermore, mRNA expression of the liver X receptor (α isoform) was not affected by STZ in either genotype (data not shown).
Fig. 8.

Hepatic mRNA expression of transcription factors in wild-type and Nrf2-null mice after STZ. Total RNA isolated from livers of control and STZ-treated wild-type and Nrf2-null mice on day 10 were evaluated for mRNA expression of PGC1α, PPARγ, chREBP, and SREBP-1c. Data were normalized to wild-type controls and presented as mean relative expression ± S.E. (n = 3–4). Black bars represent wild-type mice, and gray bars represent Nrf2-null mice. Asterisks (∗) represent statistically significant differences (p < 0.05) compared with control mice of that genotype. Daggers (†) represent a statistically significant difference (p < 0.05) between wild-type and Nrf2-null mice with the same treatment.
Effect of Oltipraz on Blood Glucose and Serum Ketones, Triglycerides, Fatty Acids, and Cholesterol Levels of Wild-Type and Nrf2-Null Mice after STZ.
To determine whether the pharmacological activation of Nrf2 is effective in lowering blood glucose levels, oltipraz was administered to vehicle-treated and STZ-treated wild-type and Nrf2-null mice. Blood glucose levels were similar between wild-type and Nrf2-null control (148–184 mg/dl) and oltipraz-only (129–160 mg/dl) mice (data not shown). Similar to Fig. 2, STZ increased blood glucose levels at 3 days in wild-type mice (Fig. 9). By day 5, oltipraz reduced blood glucose levels 33% in STZ-treated mice (Fig. 9). Compared with mice treated only with STZ, blood glucose levels remained lower in STZ/oltipraz-treated wild-type mice, although it was not statistically significant at 7 or 10 days. Oltipraz was also administered to STZ-treated Nrf2-null mice. Four of the five Nrf2-null mice that received both STZ and oltipraz died between days 3 through 7 (data not shown).
Fig. 9.

Effect of oltipraz on blood glucose levels of wild-type mice after STZ. Blood glucose levels were quantified on days −1, 1, 3, 5, 7, 9, and 10 in wild-type mice treated with citrate buffer or STZ (200 mg/kg i.p.) on day 0 and either corn oil (5 ml/kg) or oltipraz (150 mg/kg i.p.). Corn oil or oltipraz was administered on days 0.5 (12 h after STZ), 2, 4, 6, and 8. Day −1 blood glucose levels represent pretreatment values. Blood glucose levels were similar between citrate vehicle-only (148–184 mg/dl) and oltipraz-only (129–160 mg/dl) mice of both genotypes (data not shown). Data are presented as mean ± S.E. (n = 4). Asterisks (∗) represent statistically significant differences (p < 0.05) compared with control mice of that genotype. Daggers (†) represent a statistically significant difference (p < 0.05) from STZ-only treatment.
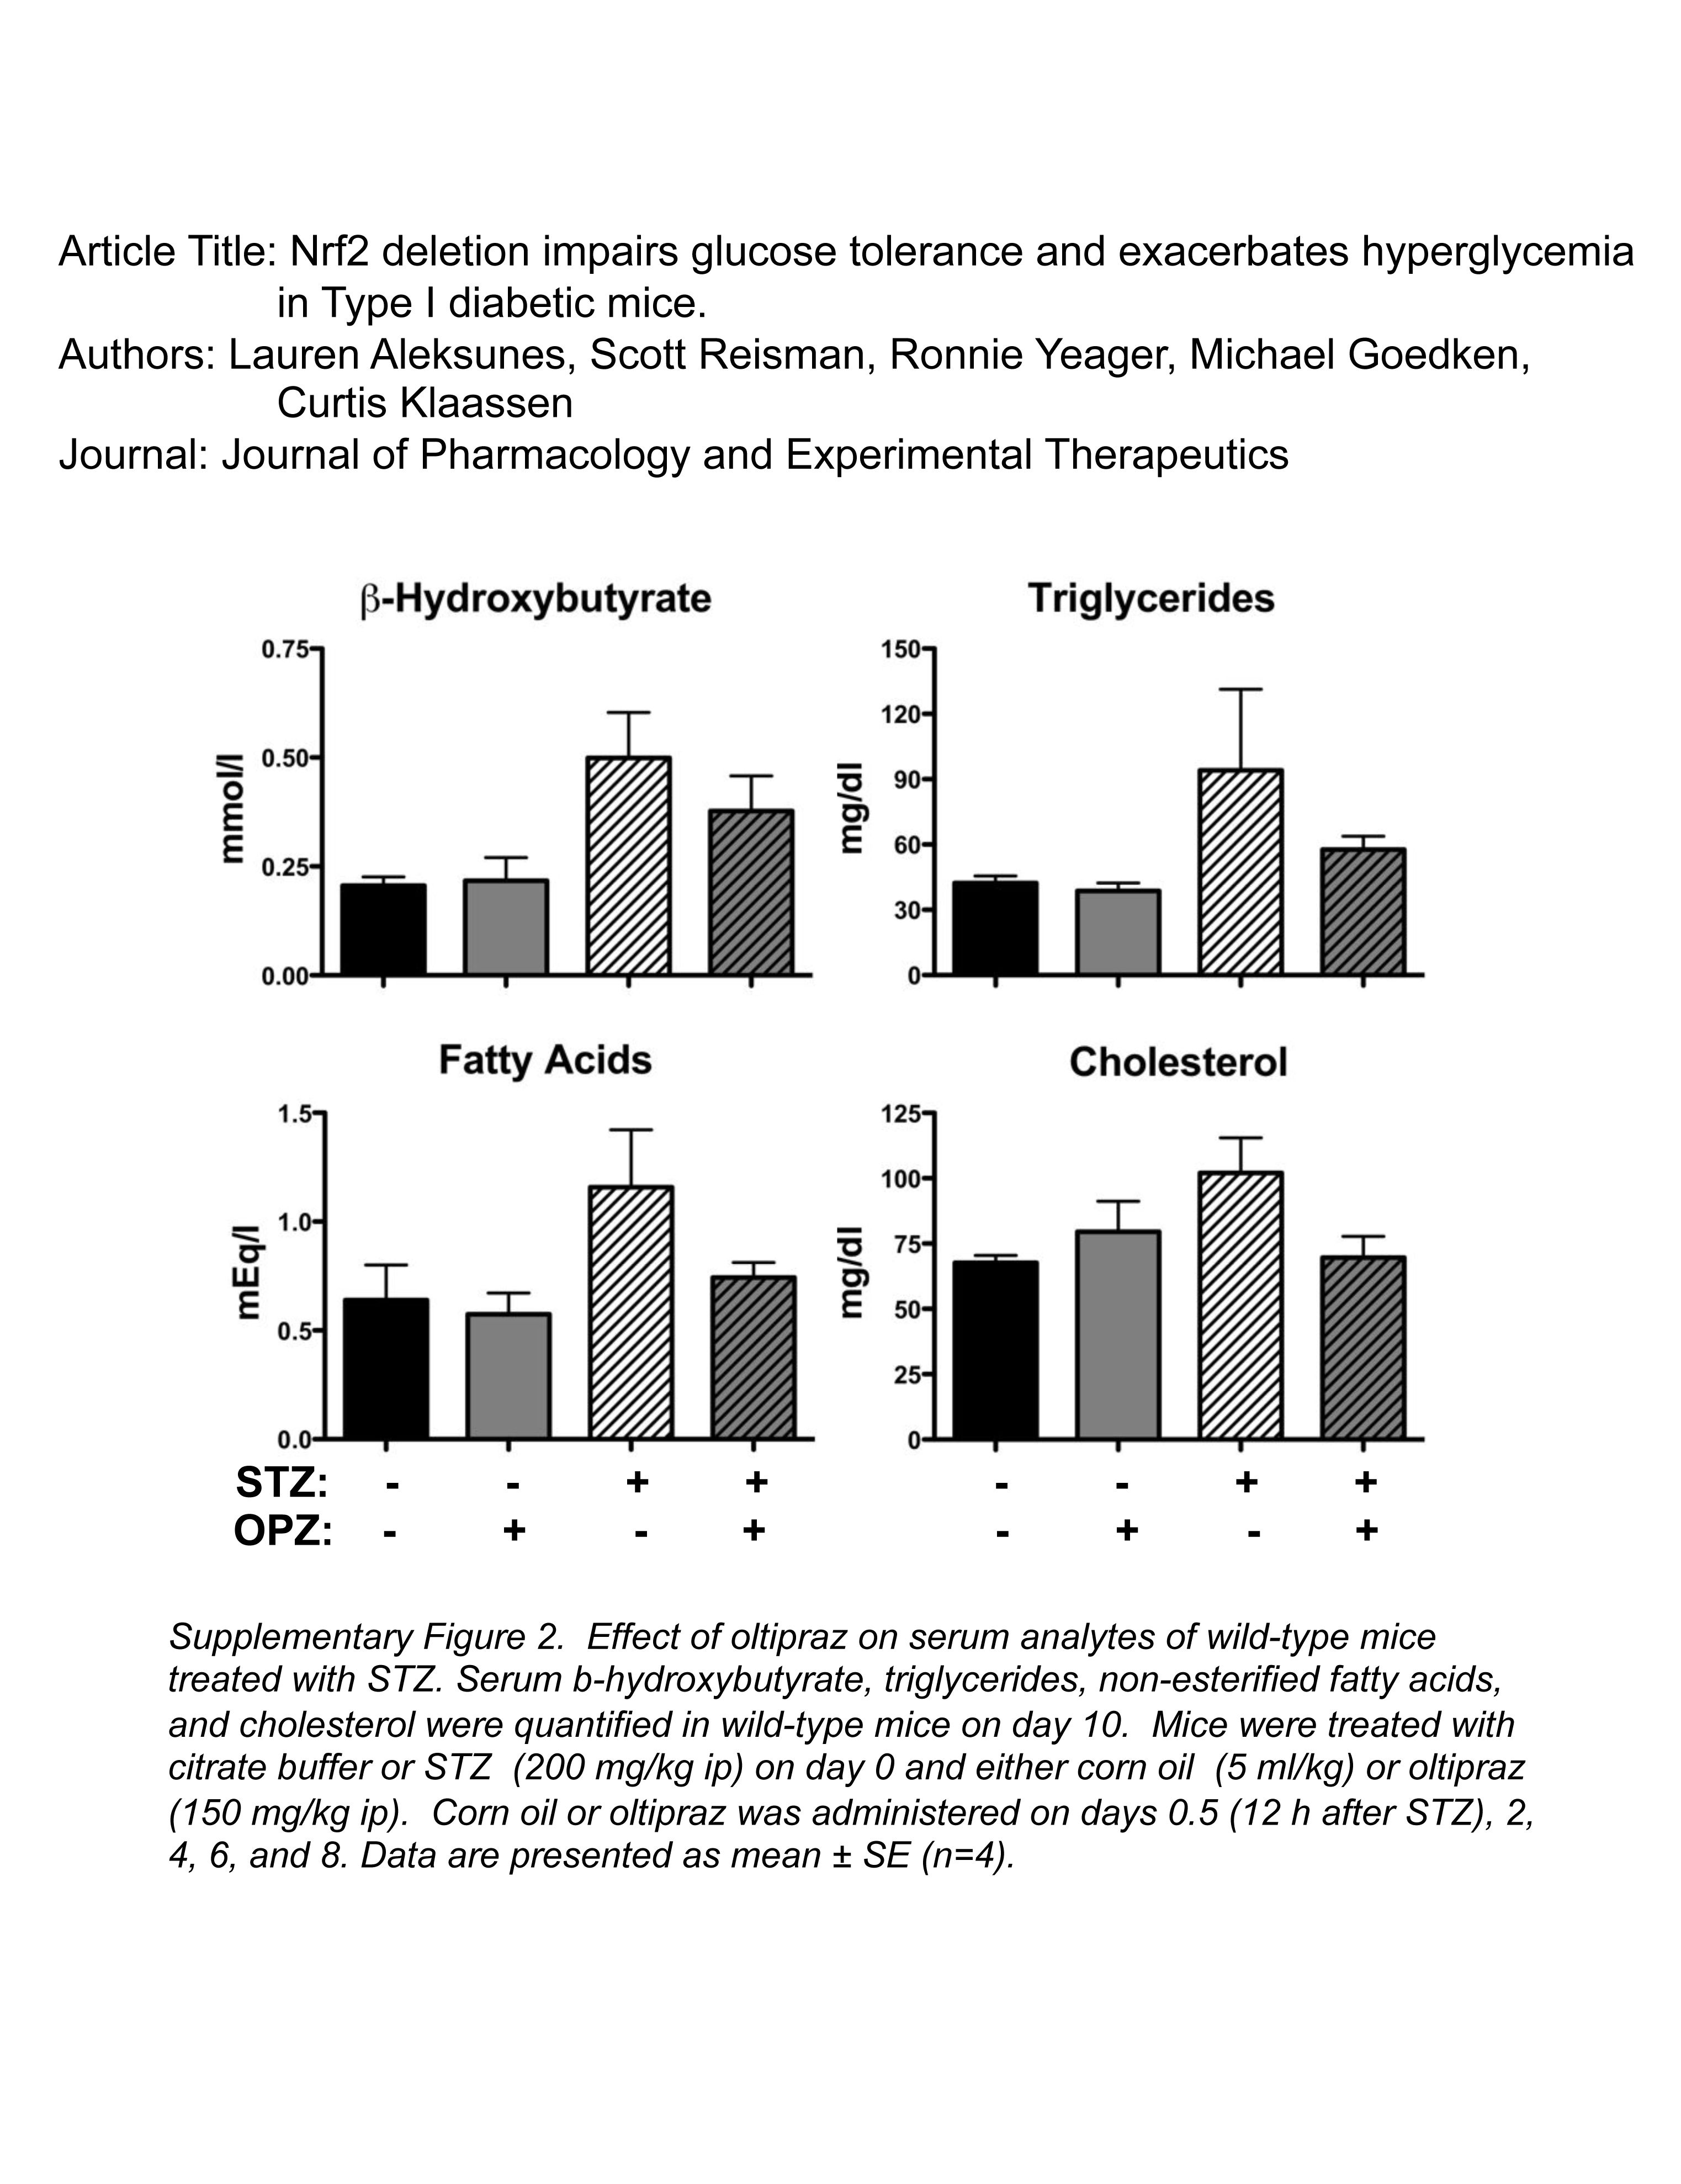
There was a trend for elevated serum levels of β-hydroxybutyrate, triglycerides, fatty acids, and cholesterol in wild-type mice treated with STZ (Supplemental Fig. 2). Oltipraz reduced serum levels of these analytes, although these findings were not statistically significant (Supplemental Fig. 2).
Discussion
The present study investigated glucose homeostasis in naive and diabetic Nrf2-null mice. Consistent with a previous report (Pearson et al., 2008), fed and feed-deprived Nrf2-null mice exhibit similar blood glucose levels to wild-type counterparts. In response to a single bolus injection of glucose, it takes longer for blood glucose levels to return to baseline in Nrf2-null mice compared with wild-type mice. Based on these findings, the response of Nrf2-null mice to a second model of hyperglycemia (STZ-induced type I diabetes) was investigated. Similar to cardiomyocytes (He et al., 2009) and renal cells (Yoh et al., 2008), high glucose levels in STZ-treated wild-type mice activated Nrf2 signaling in the liver, as evidenced by up-regulation of Nrf2 and Nqo1 mRNA. STZ-treated Nrf2-null mice had more profound increases in blood glucose and urine output as well as serum ketones, triglycerides, fatty acids, and cholesterol in comparison with wild-type mice. In addition, Nrf2-null mice exhibited slightly higher serum ALT levels and variable hepatocyte cell swelling after STZ compared with wild-type mice. Higher glucose levels in Nrf2-null mice corresponded with the hepatic expression of genes involved in glucose turnover (elevated gluconeogenesis gene, glucose-6-phosphatase, and reduced glycolytic gene, pyruvate kinase). In contrast, genes involved in fatty acid synthesis (stearoyl-CoA desaturase-1, malic enzyme-1, and fatty acid synthase) were down-regulated in STZ-treated mice, in general, to a greater extent in Nrf2-null mice. Because the gene patterns were opposite to the serum fatty acid levels, we hypothesize that this transcriptional regulation was a compensatory response attempting to decrease circulating levels of fatty acids. Glucose, glycogen, fatty acid, and cholesterol gene changes are summarized in Table 1. Hepatic mRNA levels of upstream transcription factors were also differentially regulated in Nrf2-null mice (vehicle- and STZ-treated). Minimal hepatic pathological changes in this study suggest that differential hepatic mRNA changes are probably a result of differences in hyperglycemia between genotypes rather than liver injury. Furthermore, a Nrf2 activator decreased circulating glucose levels in diabetic wild-type mice. Collectively, these findings suggest Nrf2 influences the coordinated transcriptional regulation of hepatic metabolic genes during periods of hyperglycemia.
A delay in the clearance of exogenous glucose from the blood of Nrf2-null mice (Fig. 1D) may be due to basal differences in hepatic gene expression and/or serum insulin levels. Nrf2-null mice exhibited lower constitutive mRNA expression of transcription factors, PPARγ and chREBP, as well as metabolic enzymes, pyruvate kinase and malic enzyme (Thimmulappa et al., 2002; Tanaka et al., 2008). Furthermore, a nonsignificant trend of 50% lower hepatic expression of the Glut2 uptake transporter in Nrf2-null mice was observed (data not shown). Moreover, it is possible that lower serum insulin in Nrf2-null mice may contribute to prolonged hyperglycemia after a bolus glucose dose. It should be noted that there was no difference in insulin staining in pancreatic β-cells between genotypes, suggesting that the trend toward less serum insulin in Nrf2-null mice is not due to synthesis. Additional studies are needed to identify whether Nrf2 deficiency in patients also alters the handling of a spike in blood glucose.
In livers of diabetic mice, expression of target genes paralleled upstream transcription factors. Markedly elevated mRNA expression of glucose-6-phosphatase in STZ-treated Nrf2-null mice is consistent with higher blood glucose and a more pronounced diabetic phenotype in these animals. Overexpression of PGC-1α in hepatocytes up-regulates glucose-6-phosphatase (Yoon et al., 2001); therefore, it was not surprising that the mRNA profiles of these two genes were similar in this study. A marked increase in PGC-1α mRNA in STZ-treated Nrf2-null mice is similar to data reported for Nrf2-null mice fed a high-fat diet (Tanaka et al., 2008). The almost complete loss of glucokinase expression in both genotypes after STZ was anticipated because insulin is necessary for transcription of this gene (Sols et al., 1965). It is interesting to note that liver-type pyruvate kinase levels were lowest in STZ-treated Nrf2-null mice, suggesting a reduced ability of these mice to convert phosphoenol pyruvate to pyruvate, which is an important step in glucose breakdown. Pyruvate kinase and fatty acid synthase are target genes of chREBP signaling (Shih et al., 1995; da Silva Xavier et al., 2006). Possibly, the lower basal expression of liver-type pyruvate kinase in Nrf2-null mice may be due to reduced chREBP mRNA. It should be noted that research into the regulation of chREBP has focused largely upon post-translational modifications and subcellular trafficking (Kabashima et al., 2003; Iizuka and Horikawa, 2008); however, the data in this study suggest that transcriptional mechanisms should also be considered. A screen of the upstream promoter region (10 kilobases) of mouse chREBP reveals two putative antioxidant binding sites (data not shown), suggesting that Nrf2 may participate in the regulation of this gene. Collectively, mRNA profiling of livers from STZ-treated wild-type and Nrf2-null mice demonstrates that expression of enzymes involved in glucose metabolism is similar to upstream target genes and corresponds with phenotypic patterns. Reduced expression of fatty acid synthesis genes, particularly in Nrf2-null mice, is probably a compensatory response to high circulating levels of nonesterified fatty acids.
Both glucose and insulin activate Nrf2-mediated transcription. Several possible mechanisms regarding how Nrf2 is activated by glucose have been put forth (Yoh et al., 2008; He et al., 2009), including reactive oxygen species, inflammation, glycated proteins and secondary oxidants, declines in NADPH:NADH ratios, and NADPH oxidase-mediated activation of protein kinase C. The signaling pathways are complicated by the fact that insulin also stimulates Nrf2-mediated transcription. Insulin stimulates Nrf2 nuclear translocation (Harrison et al., 2006) and induces the Nrf2 targets γ-glutamyl cystine ligase and heme oxygenase-1 in endothelial and adenocarcinoma cells, respectively (Harrison et al., 2006; Langston et al., 2008). These findings point to a complex role for Nrf2 in glucose-insulin signaling pathways.
β-Cells have low expression of antioxidant enzymes (Lenzen et al., 1996; Tiedge et al., 1997). Because of this finding, we hypothesized that the absence of Nrf2 would not alter the susceptibility of β-cells to the single large dose of STZ in this study. In support of this, near-complete loss of pancreatic β-cells and diminished serum insulin were similarly observed in wild-type and Nrf2-null mice treated with STZ. Therefore, we conclude that the higher blood glucose of diabetic Nrf2-null mice was not due to heightened susceptibility of Nrf2-null β-cells to STZ cytotoxicity. Although there is low expression of cytoprotective genes in β-cells, pretreatment with the Nrf2 activator sulforaphane can protect against STZ-induced hyperglycemia in mice by restoring insulin levels and islet morphology (Song et al., 2009).
Because of its ubiquitous expression, Nrf2 is important in the response of not only the liver but also the kidneys and heart, to hyperglycemia. Similar to the findings in our study, STZ-treated Nrf2-null mice exhibit a more severe diabetic phenotype in the kidneys and the heart compared with wild-type mice. Nrf2-null mice treated with STZ overproduce nitric oxide that is probably responsible for accelerated renal injury (Yoh et al., 2008). Moreover, cardiomyocytes from diabetic Nrf2-null mice have impaired cytoprotective gene induction as well as diminished contractility (He et al., 2009). It has been proposed that Nrf2 protects cardiomyocytes against hyperglycemia by preventing mitochondrial damage (He et al., 2009). Taken together, Nrf2 participates in responses of peripheral tissues to STZ-induced hyperglycemia.
Oltipraz is a dithiolethione that activates Nrf2 and protects against carcinogenesis in rodents (Primiano et al., 1995; Ramos-Gomez et al., 2001). In the present study, oltipraz was administered after STZ to determine whether this therapeutic intervention might lower blood glucose without affecting pancreatic susceptibility to STZ cytotoxicity. Intermittent oltipraz treatment reduced blood glucose levels of STZ-treated wild-type mice. In contrast, this treatment regimen caused mortality of Nrf2-null mice from an unknown etiology. The mechanism of oltipraz protection against STZ-induced hyperglycemia is not entirely clear, but clues can be ascertained from prior investigations. Oltipraz reduces hepatocyte production of glucose, lowers blood glucose levels of ob/ob mice without changing insulin levels, and improves insulin-mediated uptake of glucose into cultured muscle cells (Bae et al., 2007). When considering Nrf2 as a potential therapeutic target to prevent diabetes, one should take into account an interesting hypothesis (Pi et al., 2007). According to this hypothesis, low levels of hydrogen peroxide act as signaling molecules for glucose-stimulated insulin secretion. If antioxidant capacities are enhanced (due to pharmacological Nrf2 activation), this may blunt reactive oxygen species signaling necessary for insulin secretion from pancreatic β-cells (Pi et al., 2009). Collectively, these studies suggest that additional work is required to discriminate the role(s) for Nrf2 activators in the prevention and/or treatment of diabetes and related complications.
Using glucose bolus and chemical-induced hyperglycemia models, the present study identifies an important role for Nrf2 in limiting hyperglycemia. Nrf2-null mice exhibit prolonged circulating glucose after a bolus injection and increased glucose levels at an earlier time point in type I diabetic mice. Higher glucose levels in diabetic Nrf2-null mice are accompanied by higher urine output, reduced hepatic glycogen, impaired cytoprotective gene induction, and hepatic gene profiles favoring increased gluconeogenesis and reduced glycolysis. Collectively, these studies demonstrate that the absence of Nrf2 worsens the diabetic phenotype in mice, and this transcription factor may represent a novel therapeutic target for lowering blood glucose in diabetics.
Supplementary Material
Acknowledgments
We thank K. Brian Lee for assistance with imaging; Drs. Jon Maher, Angela Slitt, Pat Losco, and John Watkins, III, and Ruth Sanders for consultation regarding this project; and graduate students and fellows of the Klaassen laboratory for contributions to this project.
This work was supported in part by the National Institutes of Health National Institute of Diabetes and Digestive and Kidney Diseases [Grants DK080774, DK081461]; the National Institutes of Health National Institute of Environmental Health Sciences [Grants ES009649, ES009716, ES007079, ES013714]; and the National Institutes of Health National Center for Research Resources [Grant RR021940].
Portions of this work were presented in Aleksunes L, Reisman S, Yeager R, Goedken M, and Klaassen C (2009) Nrf2 deletion impairs glucose tolerance and exacerbates hyperglycemia in type 1 diabetic mice at the 2009 National Meeting of the Society of Toxicology; 2009 Mar 15–19, Baltimore, MD. Abstract 1141, Society of Toxicology; for which L.M.A. received the postdoctoral award from the Mechanisms Specialty section.
Article, publication date, and citation information can be found at http://jpet.aspetjournals.org.
doi:10.1124/jpet.109.162271.
The online version of this article (available at http://jpet.aspetjournals.org) contains supplemental material.
- STZ
- streptozotocin
- WT
- wild type
- Nrf2
- nuclear factor erythroid 2-related factor 2
- PEPCK
- phosphoenolpyruvate carboxykinase
- PPAR
- peroxisome proliferator-activated receptor
- PGC
- peroxisome proliferator-activated receptor coactivator
- chREBP
- carbohydrate-responsive element-binding protein
- SREBP-1c
- sterol regulatory element-binding protein 1c
- Nqo1
- NADPH quinone oxidoreductase 1
- PAS
- Periodic acid-Schiff
- ALT
- alanine aminotransferase.
References
- Aleksunes LM, Manautou JE. (2007) Emerging role of Nrf2 in protecting against hepatic and gastrointestinal disease. Toxicol Pathol 35:459–473 [DOI] [PubMed] [Google Scholar]
- Aleksunes LM, Slitt AL, Maher JM, Augustine LM, Goedken MJ, Chan JY, Cherrington NJ, Klaassen CD, Manautou JE. (2008) Induction of Mrp3 and Mrp4 transporters during acetaminophen hepatotoxicity is dependent on Nrf2. Toxicol Appl Pharmacol 226:74–83 [DOI] [PMC free article] [PubMed] [Google Scholar]
- Bae EJ, Yang YM, Kim JW, Kim SG. (2007) Identification of a novel class of dithiolethiones that prevent hepatic insulin resistance via the adenosine monophosphate-activated protein kinase-p70 ribosomal S6 kinase-1 pathway. Hepatology 46:730–739 [DOI] [PubMed] [Google Scholar]
- Beyer TA, Xu W, Teupser D, auf dem Keller U, Bugnon P, Hildt E, Thiery J, Kan YW, Werner S. (2008) Impaired liver regeneration in Nrf2 knockout mice: role of ROS-mediated insulin/IGF-1 resistance. EMBO J 27:212–223 [DOI] [PMC free article] [PubMed] [Google Scholar]
- da Silva Xavier G, Rutter GA, Diraison F, Andreolas C, Leclerc I. (2006) ChREBP binding to fatty acid synthase and L-type pyruvate kinase genes is stimulated by glucose in pancreatic beta-cells. J Lipid Res 47:2482–2491 [DOI] [PubMed] [Google Scholar]
- Enomoto A, Itoh K, Nagayoshi E, Haruta J, Kimura T, O'Connor T, Harada T, Yamamoto M. (2001) High sensitivity of Nrf2 knockout mice to acetaminophen hepatotoxicity associated with decreased expression of ARE-regulated drug metabolizing enzymes and antioxidant genes. Toxicol Sci 59:169–177 [DOI] [PubMed] [Google Scholar]
- Forbes JM, Coughlan MT, Cooper ME. (2008) Oxidative stress as a major culprit in kidney disease in diabetes. Diabetes 57:1446–1454 [DOI] [PubMed] [Google Scholar]
- Foufelle F, Ferré P. (2002) New perspectives in the regulation of hepatic glycolytic and lipogenic genes by insulin and glucose: a role for the transcription factor sterol regulatory element binding protein-1c. Biochem J 366:377–391 [DOI] [PMC free article] [PubMed] [Google Scholar]
- Friling RS, Bensimon A, Tichauer Y, Daniel V. (1990) Xenobiotic-inducible expression of murine glutathione S-transferase Ya subunit gene is controlled by an electrophile-responsive element. Proc Natl Acad Sci USA 87:6258–6262 [DOI] [PMC free article] [PubMed] [Google Scholar]
- Harrison EM, McNally SJ, Devey L, Garden OJ, Ross JA, Wigmore SJ. (2006) Insulin induces heme oxygenase-1 through the phosphatidylinositol 3-kinase/Akt pathway and the Nrf2 transcription factor in renal cells. FEBS J 273:2345–2356 [DOI] [PubMed] [Google Scholar]
- Hartley DP, Klaassen CD. (2000) Detection of chemical-induced differential expression of rat hepatic cytochrome P450 mRNA transcripts using branched DNA signal amplification technology. Drug Metab Dispos 28:608–616 [PubMed] [Google Scholar]
- He X, Kan H, Cai L, Ma Q. (2009) Nrf2 is critical in defense against high glucose-induced oxidative damage in cardiomyocytes. J Mol Cell Cardiol 46:47–58 [DOI] [PubMed] [Google Scholar]
- Iizuka K, Horikawa Y. (2008) ChREBP: a glucose-activated transcription factor involved in the development of metabolic syndrome. Endocr J 55:617–624 [DOI] [PubMed] [Google Scholar]
- Itoh K, Wakabayashi N, Katoh Y, Ishii T, Igarashi K, Engel JD, Yamamoto M. (1999) Keap1 represses nuclear activation of antioxidant responsive elements by Nrf2 through binding to the amino-terminal Neh2 domain. Genes Dev 13:76–86 [DOI] [PMC free article] [PubMed] [Google Scholar]
- Kabashima T, Kawaguchi T, Wadzinski BE, Uyeda K. (2003) Xylulose 5-phosphate mediates glucose-induced lipogenesis by xylulose 5-phosphate-activated protein phosphatase in rat liver. Proc Natl Acad Sci USA 100:5107–5112 [DOI] [PMC free article] [PubMed] [Google Scholar]
- Langston W, Circu ML, Aw TY. (2008) Insulin stimulation of gamma-glutamylcysteine ligase catalytic subunit expression increases endothelial GSH during oxidative stress: influence of low glucose. Free Radic Biol Med 45:1591–1599 [DOI] [PMC free article] [PubMed] [Google Scholar]
- Lenzen S, Drinkgern J, Tiedge M. (1996) Low antioxidant enzyme gene expression in pancreatic islets compared with various other mouse tissues. Free Radic Biol Med 20:463–466 [DOI] [PubMed] [Google Scholar]
- Like AA, Rossini AA. (1976) Streptozotocin-induced pancreatic insulitis: new model of diabetes mellitus. Science 193:415–417 [DOI] [PubMed] [Google Scholar]
- Morral N, Edenberg HJ, Witting SR, Altomonte J, Chu T, Brown M. (2007) Effects of glucose metabolism on the regulation of genes of fatty acid synthesis and triglyceride secretion in the liver. J Lipid Res 48:1499–1510 [DOI] [PubMed] [Google Scholar]
- Pearson KJ, Lewis KN, Price NL, Chang JW, Perez E, Cascajo MV, Tamashiro KL, Poosala S, Csiszar A, Ungvari Z, et al. (2008) Nrf2 mediates cancer protection but not prolongevity induced by caloric restriction. Proc Natl Acad Sci USA 105:2325–2330 [DOI] [PMC free article] [PubMed] [Google Scholar]
- Pi J, Bai Y, Zhang Q, Wong V, Floering LM, Daniel K, Reece JM, Deeney JT, Andersen ME, Corkey BE, et al. (2007) Reactive oxygen species as a signal in glucose-stimulated insulin secretion. Diabetes 56:1783–1791 [DOI] [PubMed] [Google Scholar]
- Pi J, Zhang Q, Fu J, Woods CG, Hou Y, Corkey BE, Collins S, Andersen ME. (2009) ROS signaling, oxidative stress and Nrf2 in pancreatic beta-cell function. Toxicol Appl Pharmacol doi.org/10.1016/j.taap.2009.05.025 [DOI] [PMC free article] [PubMed] [Google Scholar]
- Primiano T, Egner PA, Sutter TR, Kelloff GJ, Roebuck BD, Kensler TW. (1995) Intermittent dosing with oltipraz: relationship between chemoprevention of aflatoxin-induced tumorigenesis and induction of glutathione S-transferases. Cancer Res 55:4319–4324 [PubMed] [Google Scholar]
- Ramos-Gomez M, Kwak MK, Dolan PM, Itoh K, Yamamoto M, Talalay P, Kensler TW. (2001) Sensitivity to carcinogenesis is increased and chemoprotective efficacy of enzyme inducers is lost in nrf2 transcription factor-deficient mice. Proc Natl Acad Sci USA 98:3410–3415 [DOI] [PMC free article] [PubMed] [Google Scholar]
- Rees DA, Alcolado JC. (2005) Animal models of diabetes mellitus. Diabet Med 22:359–370 [DOI] [PubMed] [Google Scholar]
- Rushmore TH, Morton MR, Pickett CB. (1991) The antioxidant responsive element. Activation by oxidative stress and identification of the DNA consensus sequence required for functional activity. J Biol Chem 266:11632–11639 [PubMed] [Google Scholar]
- Shih HM, Liu Z, Towle HC. (1995) Two CACGTG motifs with proper spacing dictate the carbohydrate regulation of hepatic gene transcription. J Biol Chem 270:21991–21997 [DOI] [PubMed] [Google Scholar]
- Sols A, Sillero A, Salas J. (1965) Insulin-dependent synthesis of glucokinase. J Cell Physiol 66 (Suppl 1):23–38 [DOI] [PubMed] [Google Scholar]
- Song MY, Kim EK, Moon WS, Park JW, Kim HJ, So HS, Park R, Kwon KB, Park BH. (2009) Sulforaphane protects against cytokine- and streptozotocin-induced beta-cell damage by suppressing the NF-kappaB pathway. Toxicol Appl Pharmacol 235:57–67 [DOI] [PubMed] [Google Scholar]
- Tanaka Y, Aleksunes LM, Yeager RL, Gyamfi MA, Esterly N, Guo GL, Klaassen CD. (2008) NF-E2-related factor 2 inhibits lipid accumulation and oxidative stress in mice fed a high-fat diet. J Pharmacol Exp Ther 325:655–664 [DOI] [PubMed] [Google Scholar]
- Thimmulappa RK, Mai KH, Srisuma S, Kensler TW, Yamamoto M, Biswal S. (2002) Identification of Nrf2-regulated genes induced by the chemopreventive agent sulforaphane by oligonucleotide microarray. Cancer Res 62:5196–5203 [PubMed] [Google Scholar]
- Tiedge M, Lortz S, Drinkgern J, Lenzen S. (1997) Relation between antioxidant enzyme gene expression and antioxidative defense status of insulin-producing cells. Diabetes 46:1733–1742 [DOI] [PubMed] [Google Scholar]
- Weickert MO, Pfeiffer AF. (2006) Signalling mechanisms linking hepatic glucose and lipid metabolism. Diabetologia 49:1732–1741 [DOI] [PubMed] [Google Scholar]
- Xu W, Hellerbrand C, Köhler UA, Bugnon P, Kan YW, Werner S, Beyer TA. (2008) The Nrf2 transcription factor protects from toxin-induced liver injury and fibrosis. Lab Invest 88:1068–1078 [DOI] [PubMed] [Google Scholar]
- Yoh K, Hirayama A, Ishizaki K, Yamada A, Takeuchi M, Yamagishi S, Morito N, Nakano T, Ojima M, Shimohata H, et al. (2008) Hyperglycemia induces oxidative and nitrosative stress and increases renal functional impairment in Nrf2-deficient mice. Genes Cells 13:1159–1170 [DOI] [PubMed] [Google Scholar]
- Yoon JC, Puigserver P, Chen G, Donovan J, Wu Z, Rhee J, Adelmant G, Stafford J, Kahn CR, Granner DK, et al. (2001) Control of hepatic gluconeogenesis through the transcriptional coactivator PGC-1. Nature 413:131–138 [DOI] [PubMed] [Google Scholar]
Associated Data
This section collects any data citations, data availability statements, or supplementary materials included in this article.