Abstract
We report the enhanced intrinsic fluorescence from several proteins in proximity to aluminum nanostructured surfaces. Intrinsic fluorescence in proteins is dominated by the tryptophan residues. Intensities and lifetimes of several proteins with different numbers of tryptophan residues assembled on the surfaces of quartz or aluminum nanostructured films were measured. Immobilized protein molecules on the surface of an aluminum nanostructured film resulted in a significant fluorescence intensity enhancement (up to 14-fold) and lifetime decrease (up to 6-fold) compared to the quartz substrates. These large spectroscopic changes allow design of label-free bioassays where detection of binding interactions between proteins can be observed in the presence of a bulk sample solution. Binding of streptavidin to the biotinylated aluminum surface was demonstrated in the presence of 100 µg/mL bovine serum albumin in the sample solution by measurements of tryptophan intensity and lifetime changes.
Fluorescence detection is a central technology in analytical chemistry, clinical chemistry, drug discovery, proteomics, genomics, and biochemical research. Almost without exception, fluorescence detection is accomplished using extrinsic fluorophores which are used to label the biomolecules. There is an increasing need for rapid and inexpensive detection of a large number of biomolecules. For example, protein arrays can contain tens or hundreds of spots.1–3 Testing of thousands of samples are performed for drug discovery using high throughput screening (HTS).4,5 Because of the added complexity of labeling on traditional fluorescence-based bioassays, there is a growing interest in optical methods which provide label-free detection (LFD),6–8 such as surface plasmon resonance (SPR)9,10 or Raman scattering.11,12 Also, efforts are currently underway for the direct measurement of the native fluorescence of proteins to eliminate the problems of external tagging in many biological applications.13–15 It is difficult to use intrinsic fluorescence of proteins for specific assays because almost all proteins display tryptophan emission. Additionally, there is typically a high background emission due to the UV absorption and emission wavelengths of 280 and 350 nm, respectively.
During the past several years, there have been significant efforts in utilizing the metallic nanostructures or nanoparticles for improved detection of fluorescence.16–22 This approach represents a fundamental change in fluorescence technology because the fluorophores can be excited by the near fields created by plasmons on the metallic structures, rather than freely propagating light. Additionally, the metallic structure can substantially modify the rates of spontaneous emission and the directionality of the emission. It has been shown that the fluorescence intensity of a number of probes can be increased by proximity to metal island films or nanoparticles. We referred to this phenomenon as metal-enhanced fluorescence (MEF). MEF occurs due to a short-range interaction of fluorophores with metallic particles and roughened surfaces, which depending on the metal geometry; take place at distances from 5 to 30 nm.22–26 It is the short-range distance of MEF that can facilitate the label-free detection of proteins.
MEF has been observed mostly in the visible and near-infrared wavelength range using silver nanostructures.16–20 There are a few recent reports on the use of metal nanostructures in the UV range which indicate that aluminum has better plasmonic properties than silver for enhancement of UV fluorescence.26,27 This is because aluminum has a low imaginary dielectric constant at wavelengths below 400 nm. These observations lead us to consider the use of aluminum nanoparticles for MEF of the intrinsic emission from proteins and development of label-free bioassays. Generally, proteins exhibit an absorption maximum in the ultraviolet (UV) region around 280 nm, which mainly arises from the absorption of the three aromatic amino acid residues tryptophan, tyrosine, and phenylalanine.28 The native fluorescence of proteins is usually dominated by tryptophan fluorescence, because of its high quantum yield compared to tyrosine and phenylalanine, and the fluorescence resonance energy transfer (FRET) that takes place from proximal phenylalanine and/or tyrosine to tryptophan. Since 99.5% of all human proteins contain at least one tryptophan residue, intrinsic protein fluorescence in the UV region can be used as an alternative detection technique for proteins. Recently, we have shown the enhanced fluorescence of a neutral tryptophan and tyrosine derivatives near metal nanostructured surfaces.27 This allows design of surface-based assays with a biorecognitive layer that specifically bind the protein of interest and thus enhance its intrinsic fluorescence. Large increases in fluorescence intensity and decreases in lifetime provide the means of direct detection of bound protein without separation from the unbound protein.
There is limited information available, in particular, related to the intrinsic fluorescence of proteins on metal nanostructured surfaces. In this paper, we report the intrinsic fluorescence for several proteins bound to the aluminum nanostructured surfaces. Our first goal is to demonstrate the MEF of proteins with different numbers of tryptophan residues. Next, we investigate the use of intrinsic fluorescence of proteins for detection of binding reactions on MEF surfaces. Herein, we present specific detection of individual types of proteins and measure the binding kinetics of proteins such as IgG and streptavidin. Additionally, specific detection of IgG and streptavidin was accomplished in the presence of large concentrations of other proteins in sample solutions.
EXPERIMENTAL SECTION
Aluminum slugs and silicon monoxide were purchased from Sigma-Aldrich and used as received. Aluminum was deposited on quartz slides using an Edwards Auto 306 vacuum evaporation chamber under high vacuum (<5 × 10⁻⁷ Torr). In each case, the metal deposition step was followed by the deposition of 5 nm of silica via evaporation of silicon monoxide without breaking the vacuum. The silica layer served as a spacer between the metal surface and adsorbed proteins that minimizes the effect of metal quenching and also allowed for comparable surface chemistry as on the control bare quartz substrates. The deposition rate was adjusted by the filament current and the thickness of film was measured with a quartz crystal microbalance. Structural characterization of these evaporated films26 were performed using a Hitachi SU-70 scanning electron microscope (SEM). The evaporated aluminum nanostructured substrates are very stable in buffers that contain chloride salts thus furthering the usefulness of these aluminum-based substrates in many biological assays where high concentrations of salts are required.
The proteins used in the present study are bovine serum albumin (BSA), biotinylated bovine serum albumin (BSA-bt), streptavidin (SA), and goat and rabbit immunoglobulins (IgG), all from Sigma Aldrich (St. Louis, MO). For deposition of proteins on the aluminum nanostructured surfaces and bare quartz substrates, we used direct deposition of proteins by noncovalent electrostatic immobilization. The biochemical procedures of protein immobilization, incubation for binding, and measurements were performed in phosphate buffer saline (PBS) at pH 7.4 and room temperature.
Fluorescence spectra of mono- and multilayers of proteins on solid substrates were recorded using a Varian Cary Eclipse fluorescence spectrophotometer. Both the steady-state and time-domain lifetime measurements were carried out using front face illumination. Special holders were made for bioassay measurements. Time-domain lifetime measurements were obtained on a Pico-Quant lifetime fluorescence spectrophotometer (Fluotime 100). The excitation source was a pulsed laser diode (PicoQuant PDL800-B) with a 20 MHz repetition rate at 280 nm. Intensity decays were measured through a bandpass 320–360 nm filter. A frequency-domain fluorometer (K2 from ISS, Champaign, IL) was used to measure binding kinetics of model bioassay and generating phase-modulation calibration curves. The excitation wavelength in the frequency domain experiment was also 280 nm using modulated UV LED in the frequency range from 3 to 300 MHz. As the fluorescence properties, quantum yield, and lifetime of tryptophan residues strongly depend on the environment,28 experiments were performed at identical conditions for samples on the bare quartz and on the aluminum nanostructures.
The fluorescence intensity decays were analyzed in terms of the multiexponential model:28
| (1) |
In this expression, τi are the decay times and αi are the amplitudes (Σiαi = 1.0). The fractional contribution of each component to the steady-state intensity is described by
| (2) |
The average lifetimes can be calculated on the basis of fractional intensities (τ̄) or amplitude-weighted <τ> and are represented by
| (3) |
The errors for average lifetime were calculated on the basis of the confidence probability (0.683) in decay times (8–15%), amplitudes (5–20%), and fractional intensities (10–15%) with fixed phase shift and modulation errors of 0.3° and 0.008, respectively, for each data point.
RESULTS AND DISCUSSION
MEF of Proteins with a Different Number of Tryptophan Residues
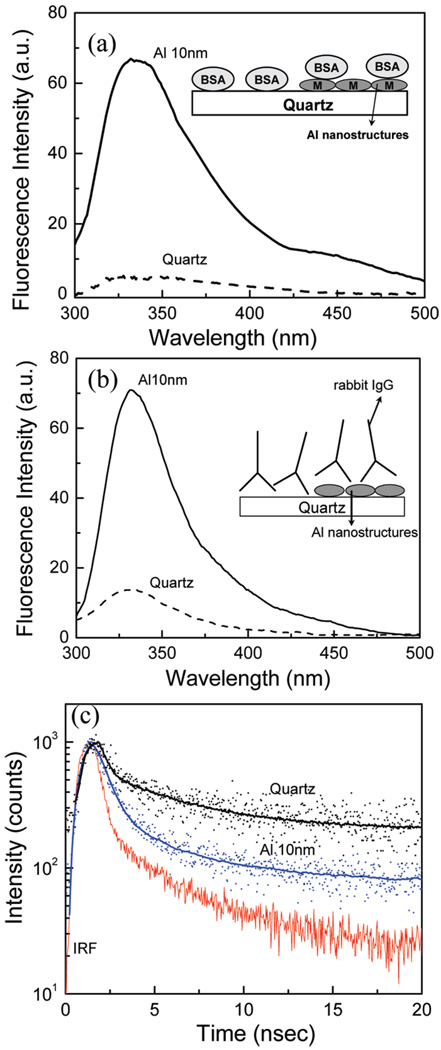
Our first goal was to determine if MEF of intrinsic fluorescence of proteins could be obtained using aluminum nanoparticles. Additionally, it is important to know if the effect is general and would occur with most proteins. Hence, we studied MEF using different proteins containing a different number of tryptophan residues. First, we used BSA that contains two tryptophan residues. The quartz control slide and the aluminum nanostructured substrate were incubated in a PBS solution of BSA with a concentration of 50 µg/mL which results in a monolayer of adsorbed protein. BSA is known to adsorb on silica very well and could form a monolayer. After incubation for 1 h at room temperature, the substrates were washed to remove the unbound proteins and emission spectra were measured. Emission spectra of a monolayer of BSA on quartz and aluminum nanostructured substrates are shown in Figure 1a. The emission spectral distribution of BSA measured on aluminum nanostructures and quartz is similar to a characteristic fluorescence from tryptophan residues. Comparison of fluorescence intensities of a monolayer of BSA on aluminum and quartz gives an increased intensity of approximately 12-fold on aluminum nanostructures.
Figure 1.
Emission spectra of (a) BSA and (b) rabbit IgG on quartz and aluminum nanostructured surfaces, (c) Intensity decays of rabbit IgG on quartz and Al.
Next, we studied immunoglobulins, which contain six tryptophan residues. Quartz and aluminum nanostructured substrates were noncovalently coated with rabbit IgG and goat IgG. Substrates were incubated in a buffer solution of IgG (10 µg/mL) for 2 h at room temperature in a humid chamber. Slides were then rinsed with buffer and washing solution (0.05% Tween 20) and placed in buffer for measurements. Figure 1b shows that rabbit IgG on aluminum nanostructured substrate gives an emission intensity enhancement of approximately 5–6 fold when compared to the quartz. Similar results were obtained with goat IgG (not shown).
The lifetime measurements for rabbit IgG deposited on the quartz and aluminum nanostructured surface are shown in Figure 1c (bottom panel). It is clear that the intensity decays of tryptophan residues in IgG are faster on the aluminum substrate compared to that on bare quartz. The amplitude weighted average lifetime of IgG on aluminum substrates is 0.54 ns compared to 3.2 ns on the quartz. The average emission lifetime of IgG was decreased by approximately 6-fold on aluminum. The shorter lifetime and increased intensity on the aluminum nanostructures indicate that there is an interaction between excited tryptophan residues and plasmons created due to the presence of aluminum nanoparticles/nanostructures.17,27 Control measurements on the quartz or particulate aluminum surfaces, without any proteins, yielded almost no signal.
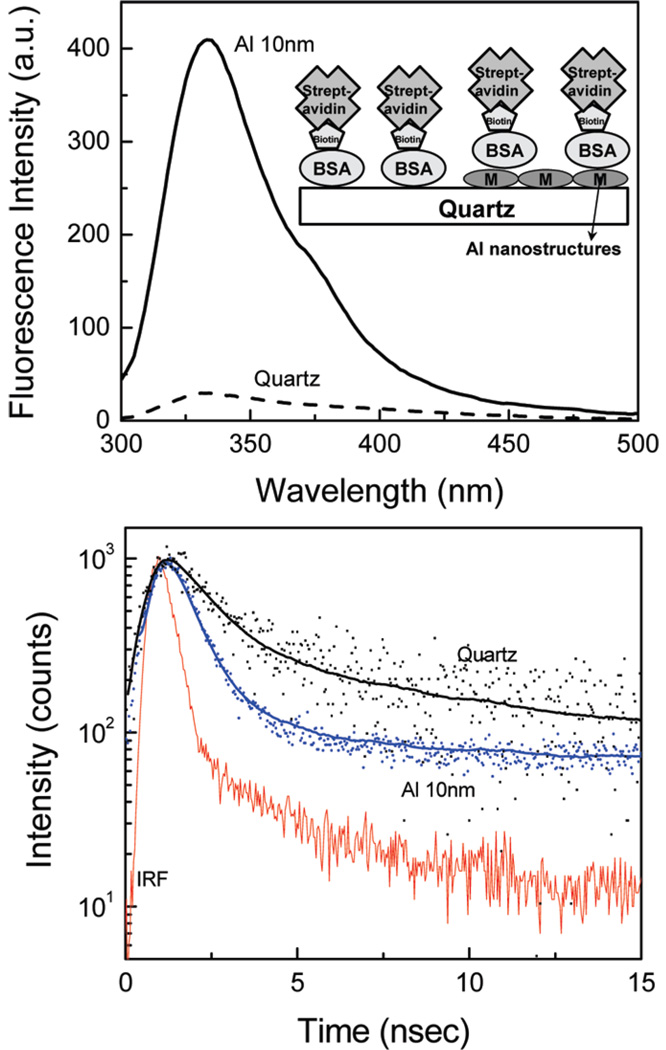
It is expected that proteins used in label-free bioassays can contain a large number of tryptophan residues. The example of these are avidin (16 tryptophans) and streptavidin (24 tryptophans), proteins frequently used in the design of surface-based bioassays. Therefore, we have prepared a bioactive monolayer of BSA-biotin (BSA-bt) on quartz and aluminum substrates. These BSA-bt coated substrates were then incubated with a streptavidin (SA) solution of 20 µg/mL for 30 min in PBS buffer at pH 7.4. We have observed approximately a 14-fold increase in fluorescence intensity and a 6-fold decrease in lifetime from a layer of BSA-bt-SA on aluminum compared to that on the quartz (Figure 2).
Figure 2.
(top) Emission spectra and (bottom) intensity decays of BSA-bt–SA on quartz and Al nanostructured surfaces. A schematic of the BSA-bt–SA assay is shown in the inset.
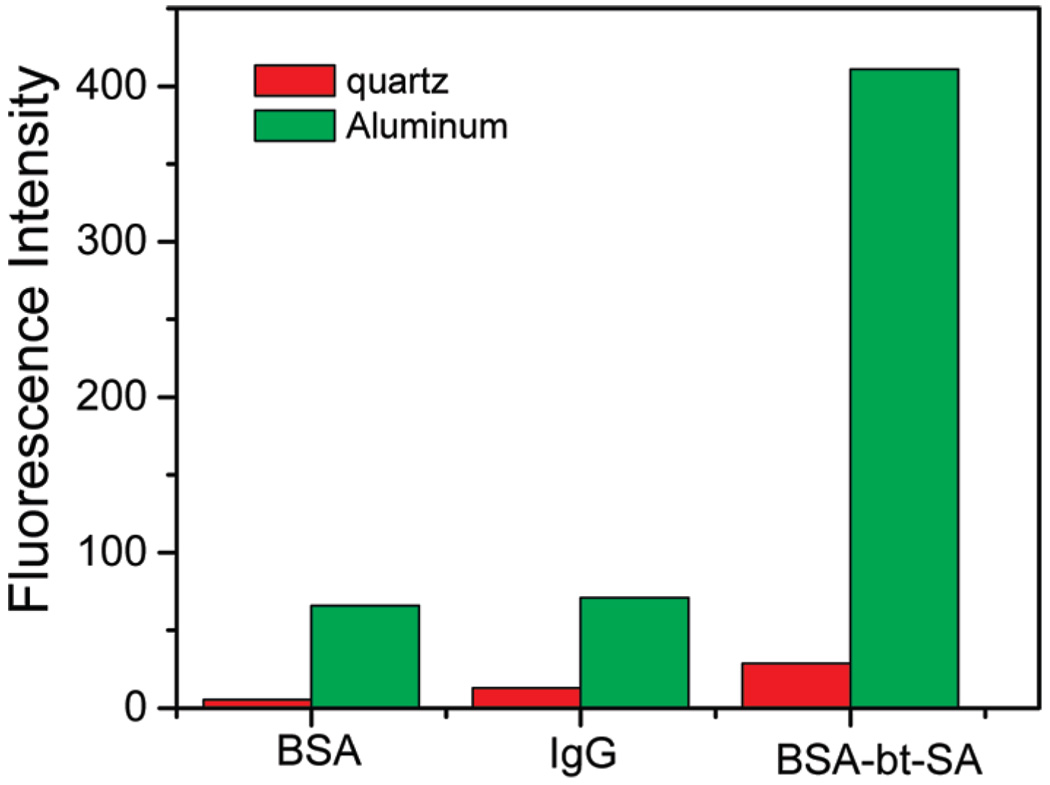
The three examples of proteins with different tryptophan residues indicate that their intrinsic fluorescence is enhanced and the lifetime reduced when bound to the surface with aluminum nanostructures. The MEF effect is typically due to an increase in both excitation and emission. The enhancement of excitation is due to an increased electrical field near the surface of nanoparticles. This effect substantially increases the apparent extinction coefficient of tryptophan. The low extinction coefficient of tryptophan of about 5 000 M−1 cm−1 is one of the reasons that intrinsic protein fluorescence has been regarded as not useful for label free detection. It should be noted that the intrinsic fluorescence of proteins are not usually directly proportional to the number of tryptophan residues because of the variation in local environments that affect the quantum efficiencies of the individual tryptophan residues. For example, we observed that the tryptophan rich streptavidin display a lower effective quantum yield than the BSA in solution. The observed different fluorescence enhancements of studied proteins 14-fold for SA, 12-fold for BSA, and 6-fold for IgG (Figure 3) reflect the variation in quantum yield of proteins and the variation in the distribution of tryptophan residues relative to the metal surface. A strong interaction between tryptophans and surface plasmons might cause those tryptophan residues, which displayed low quantum efficiency, to become much brighter due to the higher effects of enhanced radiative decay rates.16,17,22 It is well-known that the effective intensity enhancement is strongly dependent on the distance between the fluorophore and metal surface where two competitive processes occur: quenching of fluorescence due to an increase of nonradiative processes and enhancing the fluorescence due to the high electrical field.22–25 These results demonstrate that MEF of protein is a general effect which provides new opportunities for the design of fluorescent label-free assays.
Figure 3.
Emission intensities of BSA, IgG, and BSA-bt–SA on quartz and Al nanostructured surfaces.
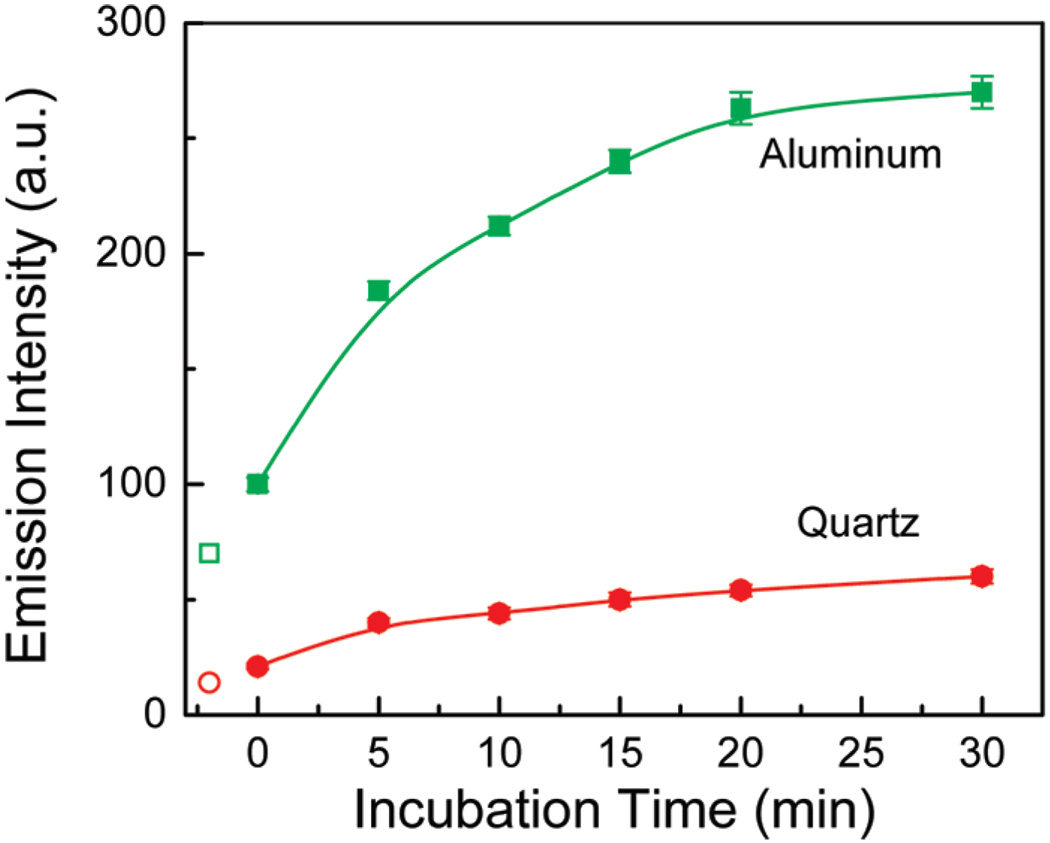
A typical bioassay will use a surface-immobilized protein to capture the target protein, and both will be fluorescent. Hence, it is important to determine if binding of the target protein can be detected in the presence of the capture protein. We answered this question using the typical antibodies as capture biomolecules for detection of respective anti-antibodies that bind directly to the capture biomolecules or form a sandwich assay via an antigen. We used rabbit IgG for the bioactive capture layer and antirabbit IgG as the analyte. Rabbit IgG was adsorbed on the quartz or aluminum surface by physical adsorption. These rabbit IgG coated slides were then treated with blocking solutions (StartingBlock (PBS) blocking buffer from Pierce Biotechnology). Before and after blocking surfaces were washed and intensity measured (Figure 4). Blocking the surfaces resulted in intensities increasing compared to the capture IgG by 55% and 50% on quartz and aluminum, respectively. The combined signal from capture IgG and blocking agent provides the baseline signal for subsequent bound anti-IgG (Figure 4). The activated substrates were exposed to the antirabbit IgG solution (10 µg/mL) for a given period of time. The intensity measurements were performed in buffer after washing away unbound antirabbit IgG. The results of the increased binding are presented in Figure 4 where increased intensity corresponds to the increased amount of bound anti-IgG due to immunoreaction. We observed that the fluorescence enhancements are always between 5- and 6-fold. We have not observed any change in intensity for the surface immobilized goat-IgG slides while incubated with antirabbit IgG as these slides were used as a negative control (nonspecific binding of antirabbit IgG to the goat IgG antigen).
Figure 4.
Fluorescence intensity of IgG-anti-IgG immunoassay on quartz and Al nanostructured surfaces. Open data points represent the intensity of immobilized IgG-rabbit before the blocking solution.
Kinetics of Binding and Detection in the Presence of Bulk Proteins
An important advantage of the label-free MEF assays would be the ability to detect the analyte in the presence of bulk concentrations of other biomolecules in the sample. The concentration of proteins in biological samples is high; e.g. human serum or blood is dominated by the human serum albumin with about a 1 mg/mL concentration. Despite the enhanced fluorescence of specifically bound proteins to MEF substrates, the signal from biological samples can be many fold larger than that produced by surface bound analytes. However, one can design a surface MEF assay where the signal from the bulk solution will be significantly reduced by controlling the sample thickness. We have performed a model label-free assay where the sample contained a large concentration of BSA and various concentrations of streptavidin that binds to the bioactive layer of biotinylated BSA on the MEF substrate.
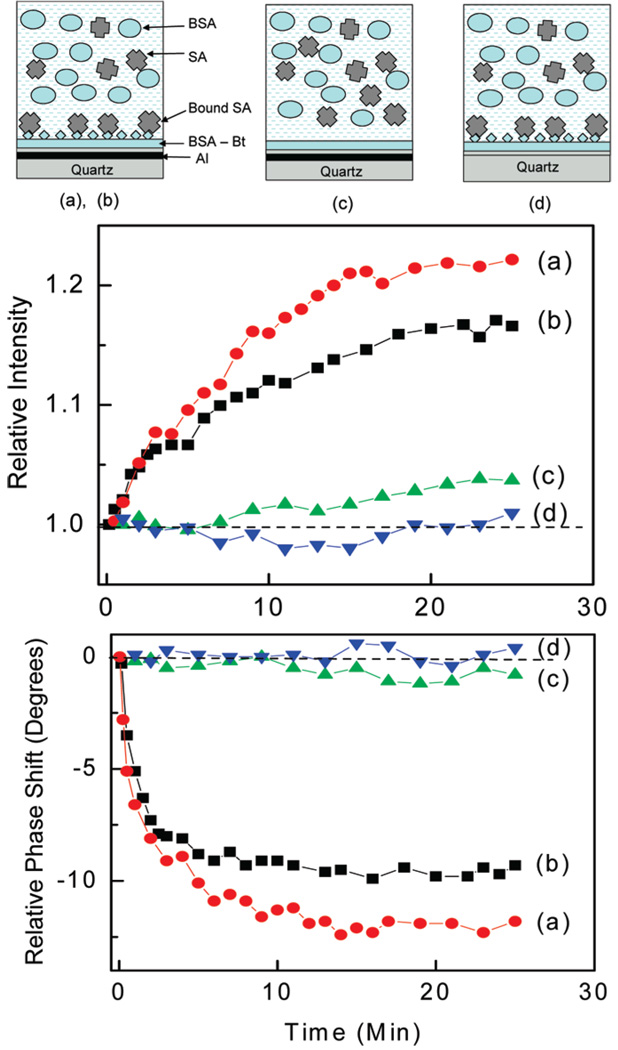
First, we demonstrated the binding kinetics of SA observed in the presence of a high BSA concentration of 100 µg/mL (1.56 µM). The thin silicone adhesive (purchased from Invitrogen) of 160 µm thickness was used to construct the sample compartments. Each sample compartment (well) was coated with biotinylated BSA (bioactive surface for streptavidin). The liquid samples contained a fixed concentration of BSA (100 µg/mL), and various concentrations of streptavidin were placed in the wells. Figure 5 shows the temporal changes in intensity increases and phase shift decreases (average lifetime decrease) upon binding of SA to the bioactive surfaces using two samples with SA concentrations of 52 nM (a) and 157 nM (b). The observed relative intensity increase and phase shift decrease for the SA concentration of 52 nM (a) are larger than for 157 nM (b) which is mainly the effect of a smaller signal contribution from the bulk solution. The samples contained 157 and 52 nM of SA, which resulted in various bulk signals that added to that of BSA. The control measurements without a bioactive surface (only BSA) display very small changes in intensities and phase shifts (curves of Figure 5(c)). These small changes are due to nonspecific binding. The measurements performed on bare quartz resulted in practically no changes in intensity and phase shift (Figure 5(d)) which mean that the signal from bound SA is low and the intensity and lifetime changes upon binding also are small compared to that of a bulk solution. The binding kinetics experiments clearly demonstrate that the MEF of the bound SA is very distinct compared to the fluorescence on bare quartz.
Figure 5.
(top) Schematic representation of the monitoring of SA binding in the presence of BSA. The solutions above the surfaces were 160 µm thick. (middle) Temporal changes in relative intensities for three surfaces: with a bioactive layer of BSA-bt on Al nanostructures, (a) 52 nM SA and (b) 157 nM SA; without a bioactive layer of BSA, (c) 157 nM SA; and with a bioactive layer on quartz, (d) 157 nM SA. (bottom) Temporal changes in phase shifts for three surfaces described above. The measurements were performed in the presence of 1560 nM of BSA in solution. The dashed lines define no changes in intensity and phase shift.
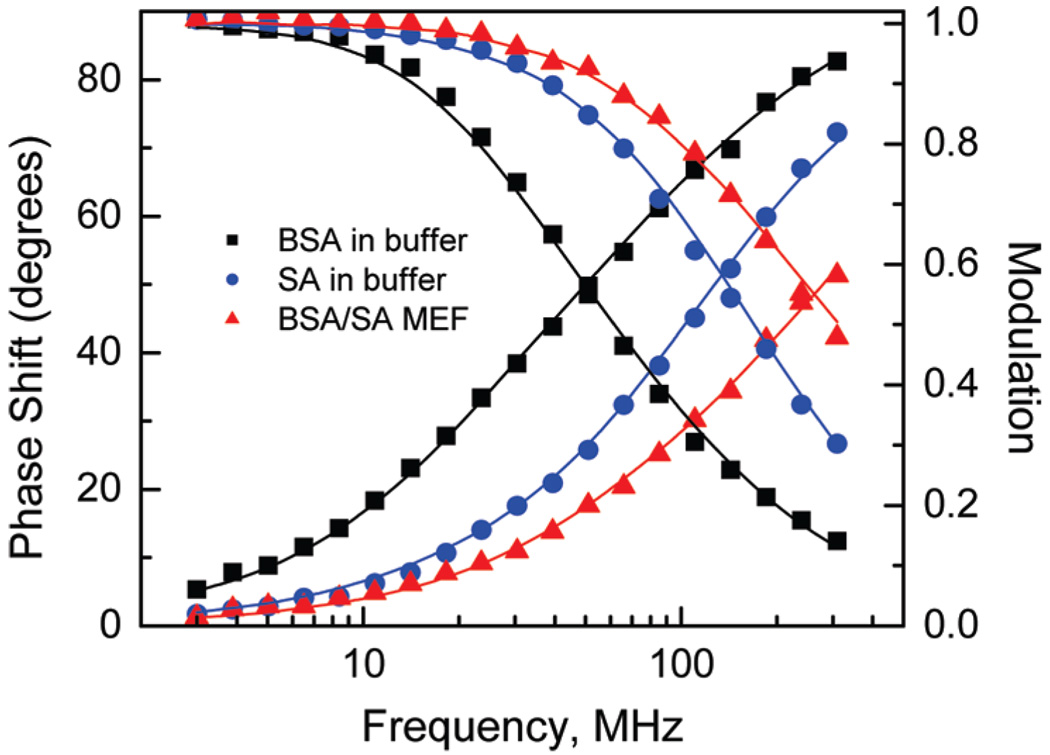
To understand the lifetime behavior due to binding, it is worthwhile to consider the average lifetime of the bulk solution and that of analyte bound to the MEF surface. Figure 6 shows the frequency-domain intensity decays of BSA (dominant fluorescing species in solution) and SA free in solution and bound to the MEF surface. One can see substantial differences between the intensity decays of tryptophan residues in various environments. In fact the intrinsic fluorescence of proteins represents a complex spectroscopic challenge because of multiple fluorophores with overlapping absorption and emission spectra. The dominant tryptophan residue fluorescence is also complex because of two overlapping electronic states and its sensitivity to a variety of quenchers including nearby peptide bonds in proteins.28 The initial conformation of proteins and subsequent changes due to protein-protein binding results in specific intensity decays of tryptophan emission. Thus, the observed intensity decays reflect the sensitivity of tryptophan residues to the initial environment (BSA and SA in buffer solutions) and to conformational changes due to binding and interaction with the surface plasmons (bound to aluminum nanostructures of the BSA/SA layer). Despite the multiple tryptophan residues and interaction with surface plasmons, the intensity decays were satisfactorily fit to two exponential models (Table 1). It is important to mention that the substantially faster intensity decay of tryptophans on the MEF (aluminum nanostructures) substrates provides an opportunity for detection of binding using lifetime measurements. So far, the conformational changes that cause the change in emission intensity and lifetime of tryptophan residues have been regarded not sufficient to develop fluorescence label-free bioassays. In contrast, the MEF observed in the UV region provides an opportunity for designing label-free bioassays where detection can be performed in the presence of a bulk protein solution.
Figure 6.
Frequency-domain intensity decays of BSA and SA in a buffer solution and a protein bilayer (BSA-bt-SA) on the aluminum nanostructures. The lines represent the two-exponentials fit to experimental data. Detailed analysis is given in the Table 1.
Table 1.
Analysis of Intensity Decays of BSA and Streptavidin in Buffer Solutions and on Al Nanostructuresa
| sample | τi (ns) | αi | fi | <τ> (ns) | τM (ns) |
|---|---|---|---|---|---|
| BSA | 6.90 | 0.304 | 0.524 | 4.00 ± 0.41 | 4.92 ± 0.38 |
| in buffer | 2.74 | 0.696 | 0.476 | ||
| SA | 6.45 | 0.020 | 0.082 | 1.56 ± 0.09 | 1.87 ± 0.18 |
| in buffer | 1.46 | 0.980 | 0.918 | ||
| BSA/SA | 1.89 | 0.157 | 0.390 | 0.76 ± 0.09 | 1.07 ± 0.10 |
| layer on Al | 0.55 | 0.843 | 0.610 |
Excitation wavelength at 280 nm (UV LED), emission observed through a band pass filter of 360/40 nm.
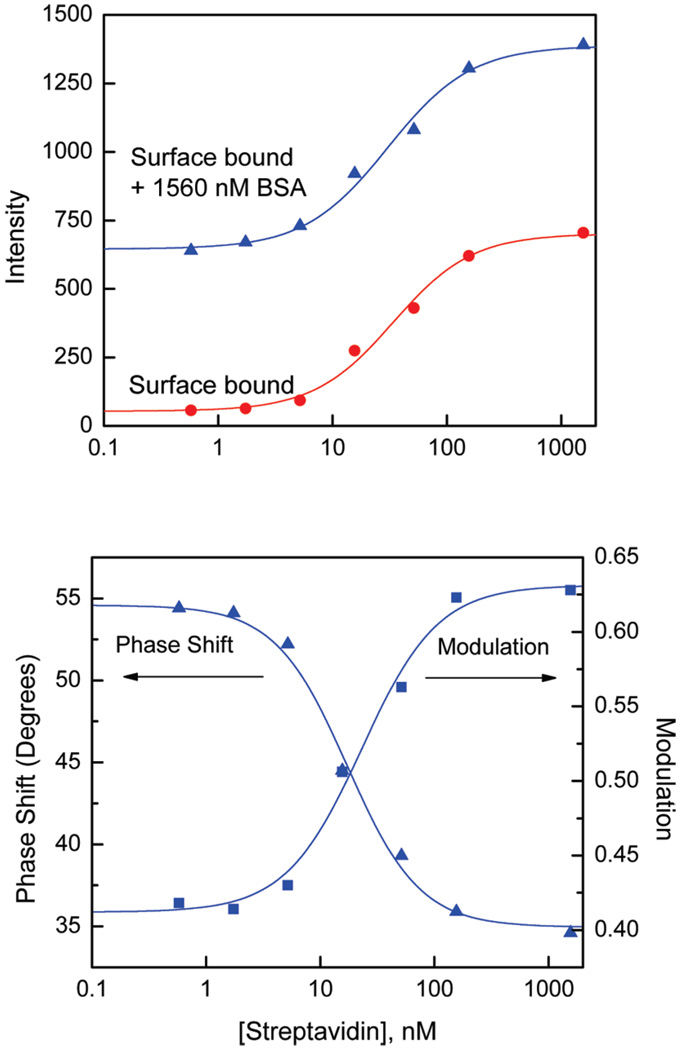
The performance of a label-free bioassay is shown in Figure 7 where intensity and phase-modulation sensing modalities were used for the generation of dose responses for the streptavidin assay. In order to generate the dose responses shown in Figure 7, the wells with a depth of 160 µm and a diameter of 9 mm were activated with the monolayer of BSA-bt. Next, the wells were incubated in a humid environment with various concentrations of SA for 30 min using sample volumes of 20 µL. After incubation, the unbound SA was washed out and intensity measurements of surface bound SA were performed (Figure 7 top, circles). In order to demonstrate the ability of the detection of SA in the presence of potential bulk sample proteins, we measured again intensities, phase shifts, and modulations in the presence of 100 µg/mL of BSA with a solution thickness of 160 µm (scheme of Figure 5). The second intensity dose response for the SA assay resulted in a new baseline generated by a solution layer of BSA (Figure 7 top, triangles). The intensity generated by a monolayer of bound SA (saturation point) is comparable to that generated by a layer of BSA in solution. This indicates that intensity measurements are possible at high concentrations of bulk protein in sample. Additional discrimination of a signal from bulk proteins can be achieved by a further reduction of the sample thickness.
Figure 7.
(top) Intensity calibration curves for the SA assay on Al nanostructures in the absence and presence of 1500 nM BSA. (bottom) Phase shift and modulation calibration curves for the SA assay on Al nanostructures measured at 85 MHz.
The change in fluorescence lifetime due to interactions of fluorophores with surface plasmons allows for the design of bioassays where detection of binding can be performed on the basis of lifetime. The most convenient time-resolved fluorometry for sensing is the phase-modulation method where simple changes in phase shift and modulation can be measured using single modulation frequency without requirement for time-resolved data analysis. One can see substantial differences in the phase shifts and modulations between bound SA to the Al nanostructures (BSA/SA) and SA free in buffer solution (Figure 6). These differences are even larger when compared between the bound BSA/SA layer and BSA free in buffer solution. We used a single modulation frequency of 85 MHz for measurements of phase shifts and modulations for samples with various bound SA in the presence of a fixed concentration of BSA (100 µg/mL). Figure 7 (bottom) shows the phase shift and modulation calibration curves based on the difference in lifetimes of bound SA to the substrate with Al nanostructures and BSA in solution. Usually, the phase-modulation approach offers higher bioassay sensitivities compared to the intensity because of different weighting factors of short (bound probe) and long (free probe in solution) lifetime components. For example, the midpoint of the intensity-based calibration curve is 31 nM; the phase shift results with 17 nM and a modulation of 23 nM. This indicates that phase shift measurements resulted in about 2-fold higher sensitivity than intensity measurements. The midpoint values were determined using a four parameter logistic function to fit the measured data (lines in Figure 7).29
CONCLUSIONS
The intrinsic fluorescence from proteins containing a different number of tryptophan residues in proximity to the aluminum nanostructured surfaces are significantly (up to 14-fold) enhanced. The optimization of aluminum nanostructures could lead to a higher enhancement factor than observed in the present experiments. The emission lifetimes of the tryptophans in proteins are shortened (up to 6-fold) on aluminum particles compared to a quartz substrate. The extension of MEF to the UV region and observation of enhanced intrinsic protein fluorescence opens new possibilities to study tryptophan-containing proteins without labeling with longer wavelength fluorophores and provides an approach to label-free detection of biomolecules. We have performed a model label-free assay where the sample contained a large concentration of BSA and various concentrations of streptavidin that binds to the bioactive layer of biotinylated BSA on aluminum nanostructured substrate. These preliminary studies of MEF of proteins demonstrate an opportunity for the design of label-free bioassays.
ACKNOWLEDGMENT
The present work was supported by the National Institute of Health (NIH), NHGRI (Grant HG002655), NIBIB (Grant EB006521), and NCI (Grant R21CA134386).
References
- 1.Gershon D. Nature Methods. 2004;1:263. [Google Scholar]
- 2.Mitchell P. Nat. Biotechnol. 2002;20:225. doi: 10.1038/nbt0302-225. [DOI] [PubMed] [Google Scholar]
- 3.Moreno-Bondi MC, Taitt CR, Shriver-Lake LC, Ligler FS. Biosens. Bioelectron. 2006;21:1880. doi: 10.1016/j.bios.2005.12.018. [DOI] [PubMed] [Google Scholar]
- 4.Hertzberg RP, Pope AJ. Curr. Opin. Chem. Biol. 2000;4:445–451. doi: 10.1016/s1367-5931(00)00110-1. [DOI] [PubMed] [Google Scholar]
- 5.White RE. Annu. Rev. Pharmacol. Toxicol. 2000;40:133–157. doi: 10.1146/annurev.pharmtox.40.1.133. [DOI] [PubMed] [Google Scholar]
- 6.Ramachandran N, Larson DN, Stark PRH, Hainsworth E, LaBaer J. FEES J. 2005;272:5412. doi: 10.1111/j.1742-4658.2005.04971.x. [DOI] [PubMed] [Google Scholar]
- 7.Yu X, Xu D, Cheng Q. Proteomics. 2006;6:5493. doi: 10.1002/pmic.200600216. [DOI] [PubMed] [Google Scholar]
- 8.Cooper MA. Drug Discovery Today. 2006;11:1068. doi: 10.1016/j.drudis.2006.10.001. [DOI] [PubMed] [Google Scholar]
- 9.Willets KA, Van Duyne RP. Annu. Rev. Phys. Chem. 2007;58:267. doi: 10.1146/annurev.physchem.58.032806.104607. [DOI] [PubMed] [Google Scholar]
- 10.Phillips KS, Cheng Q. Anal. Bioanal. Chem. 2007;387:1831. doi: 10.1007/s00216-006-1052-7. [DOI] [PubMed] [Google Scholar]
- 11.Stuart DA, Yonzon CR, Zhang X, Lyandres O, Shah NC, Glucksberg MR, Walsh JT, Van Duyne RP. Anal. Chem. 2005;77:4013. doi: 10.1021/ac0501238. [DOI] [PubMed] [Google Scholar]
- 12.Sun L, Yu C, Irudayaraj J. Anal. Chem. 2007;79:3981. doi: 10.1021/ac070078z. [DOI] [PMC free article] [PubMed] [Google Scholar]
- 13.Engström HA, Andersson PA, Ohlson S. Anal. Biochem. 2006;357:159. doi: 10.1016/j.ab.2006.03.058. [DOI] [PubMed] [Google Scholar]
- 14.Schulze P, Ludwig M, Kohler F, Beider D. Anal. Chem. 2005;77:1325. doi: 10.1021/ac048596m. [DOI] [PubMed] [Google Scholar]
- 15.Sluszny C, Yeung ES. Anal. Chem. 2004;76:1359. doi: 10.1021/ac035336g. [DOI] [PubMed] [Google Scholar]
- 16.Lakowicz JR. Anal. Biochem. 2002;301:261–277. doi: 10.1006/abio.2001.5503. [DOI] [PMC free article] [PubMed] [Google Scholar]
- 17.Lakowicz JR, Ray K, Chowdhury M, Szmacinski H, Fu Y, Zhang J, Nowaczyk K. Analyst. 2008;133:1308–346. doi: 10.1039/b802918k. [DOI] [PMC free article] [PubMed] [Google Scholar]
- 18.Ray K, Badugu R, Lakowicz JR. J. Am. Chem. Soc. 2006;128:8998–8999. doi: 10.1021/ja061762i. [DOI] [PMC free article] [PubMed] [Google Scholar]
- 19.Sokolov K, Chumanov G, Cotton TM. Anal. Chem. 1998;70:3898–3905. doi: 10.1021/ac9712310. [DOI] [PubMed] [Google Scholar]
- 20.Tarcha PJ, DeSaja-Gonzalez J, Rodriguez-Llorente S, Aroca R. Appl. Spectrosc. 1999;53:43–48. [Google Scholar]
- 21.Pompa PP, Martiradonna L, Delia Torre A, Della Sala F, Manna L, De Vittorio L, Calabi F, Cingolani R, Rinaldi R. Nat. Nanotechnol. 2006;1:126–130. doi: 10.1038/nnano.2006.93. [DOI] [PubMed] [Google Scholar]
- 22.Mertens H, Koenderink AF, Polman A. Phys. Rev. B. 2007;76:115123. [Google Scholar]
- 23.Malicka J, Gryczynski I, Gryczynski Z, Lakowicz JR. Anal. Biochem. 2003;315:57–66. doi: 10.1016/S0003-2697(02)00702-9. [DOI] [PMC free article] [PubMed] [Google Scholar]
- 24.Ray K, Badugu R, Lakowicz JR. J. Phys. Chem. C. 2007;111:7091–7097. doi: 10.1021/jp067635q. [DOI] [PMC free article] [PubMed] [Google Scholar]
- 25.Ray K, Badugu R, Lakowicz JR. Chem. Mater. 2007;19:5902–5909. doi: 10.1021/cm071510w. [DOI] [PMC free article] [PubMed] [Google Scholar]
- 26.Ray K, Chowdhury MH, Lakowicz JR. Anal. Chem. 2007;79:6480–6487. doi: 10.1021/ac071363l. [DOI] [PMC free article] [PubMed] [Google Scholar]
- 27.Chowdhury MH, Ray K, Gray SK, Pond J, Lakowicz JR. Anal. Chem. 2009;81:1397–1403. doi: 10.1021/ac802118s. [DOI] [PMC free article] [PubMed] [Google Scholar]
- 28.Lakowicz JR. Principles of Fluorescence Spectroscopy. 3rd ed. New York: Springer; 2006. [Google Scholar]
- 29.Findlay JWA, Smith WC, Lee JW, Nordblom GD, Das I, DeSilva BS, Khan MN, Bowsher RR. J. Pharm. Biomed. Anal. 2000;21:1249–1273. doi: 10.1016/s0731-7085(99)00244-7. [DOI] [PubMed] [Google Scholar]


