Abstract
Droplets or plugs within multiphase microfluidic systems have rapidly gained interest as a way to manipulate samples and chemical reactions on the femtoliter to microliter scale. Chemical analysis of the plugs remains a challenge. We have discovered that nanoliter plugs of sample separated by air or oil can be analyzed by electrospray ionization mass spectrometry when pumped directly into a fused silica nanospray emitter tip. Using leu-enkephalin in methanol and 1% acetic acid in water (50:50 v:v) as a model sample, we found carry-over between plugs was < 0.1% and relative standard deviation of signal for a series of plugs was 3%. Detection limits were 1 nM. Sample analysis rates of 0.8 Hz were achieved by pumping 13 nL samples separated by 3 mm long air gaps in a 75 μm inner diameter tube. Analysis rates were limited by the scan time of the ion trap mass spectrometer. The system provides a robust, rapid, and information-rich method for chemical analysis of sample in segmented flow systems.
Sir
Multiphase flow in capillary or microfluidic systems has generated considerable interest as a way to partition and process many discrete samples or synthetic reactions in confined spaces.1-4 A common arrangement is a series of aqueous plugs or droplets separated by gas or immiscible liquid such that each plug can act as a small, individual vial or reaction vessel.4, 5 Methods for formation and manipulation of plugs on the femtoliter to nanoliter scale have recently been developed.2-4, 6-11 The sophistication of these methods has rapidly increased so that it is now possible to perform many common laboratory functions such as sampling,12 splitting,13-15 reagent addition,16, 17 concentration,18, 19 and dilution20 on plugs in microfluidic systems. A frequent emphasis is that such manipulations can be performed automatically at high-throughput. These miniaturized multiphase flow systems have roots in the popular technique of continuous flow analysis (also known as segmented flow analysis) which uses air-segmentation of samples for high-throughput assays in clinical, industrial and environmental applications.21, 22
A limiting factor in using and studying multiphase flows is the paucity of methods to chemically analyze the contents of plugs. Optical methods such as colorimetry 22 and fluorescence are most commonly used.20 Systems for electrophoretic analysis of segmented flows have recently been developed.23, 24 Drawbacks of these methods are that they require that the analytes be labeled to render them detectable and they provide little information on chemical identity of plug contents. NMR has been used for analysis of plugs, but low sensitivity of this method limits its potential applications.25 Sensitive, label-free, and information rich detection would greatly aid development of this technology platform.
Mass spectrometry (MS) is an attractive analytical technique for analysis of segmented flows because it has the sensitivity and speed to be practically useful for low volume samples analyzed at high-throughput. Mass spectrometry has been coupled to segmented flow by collecting samples onto a plate for MALDI-MS26 or a moving belt interface for electron impact ionization-MS.27 ICP-MS of air-segmented samples has been demonstrated on a relatively large sample format (0.2 mL samples).28 MS analysis of acoustically levitated droplets using charge and matrix-assisted laser desorption/ionization has also been demonstrated.29 Recently, a method to perform electrospray ionization (ESI)-MS of a stream of segmented flow has been reported.30 In this method, a stream of aqueous droplets segmented by an immiscible oil was periodically sampled by using electrical pulses to transfer the droplet into an aqueous stream that was directed to an electrospray source. This proof-of-concept report showed the feasibility of on-line droplet analysis; however, the limit of detection (LOD) for peptide was ∼500 μM. The high LOD was due at least in part to dilution of droplets once transferred to the aqueous stream and the high flow rate (∼3 μL/min) for the electrosprayed solution. The dispersion of droplets after transfer to the aqueous stream also limits the throughput of this approach.
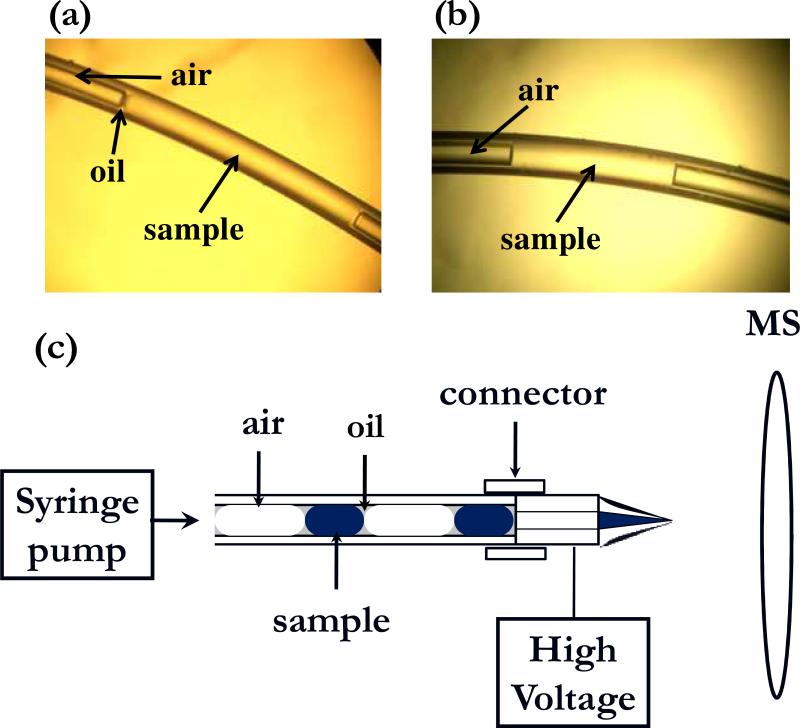
We have found that a cartridge of 10 to 50 nL samples segmented by gas within a Teflon tube can be pumped directly into a electrospray source to yield a simple, robust and sensitive method for analyzing droplet content. This method can also be considered a novel approach to sample introduction for MS. Cartridges of samples were prepared by dipping the tip of a 75 or 150 μm i.d. by 80 cm long Teflon tube filled with oil (Fluorinert FC-40) into sample solution stored in a 96 well plate, withdrawing a desired volume, removing the tube from the well, withdrawing a desired volume of air, and repeating until all samples had been loaded. Movement of the tubing was controlled with a custom-built, automated micropositioner and sample flow was controlled with a syringe pump connected to the opposite end of the tubing. Resulting plugs had a small amount of oil covering their ends and a convex meniscus indicating little wetting of the walls (Figure 1A). Interestingly, loading the tube without a pre-fill of oil resulted in a flatter meniscus (Figure 1B). To interface to the mass spectrometer (LTQ XL, Thermo Fisher Scientific, Waltham, MA), the outlet of the cartridge was coupled to a Pt-coated fused-silica electrospray emitter (FS 360−50−8-CE, New Objective, Woburn, MA) which was 50 μm i.d. and pulled to 8 μm i.d. at the tip. The emitter was mounted in a nanospray source (PV-550, New Objective) (Figure 1C). The plugs could then be pumped directly into the emitter tip for analysis.
Figure 1.
(a) Photograph of a 3 mm long (50 nL) plug stored in a 150 μm i.d. Teflon tube. Plug was created by withdrawing sample and air alternately into the tube prefilled with Fluorinert FC-40. (b) Same as (a) except the tube was prefilled with air instead of oil. (c) Overview of scheme for analyzing a train of plugs stored in the Teflon tube. 2 kV is applied at the spray tip. Connector is a Teflon tube that fits snugly over the cartridge tube and emitter tip.
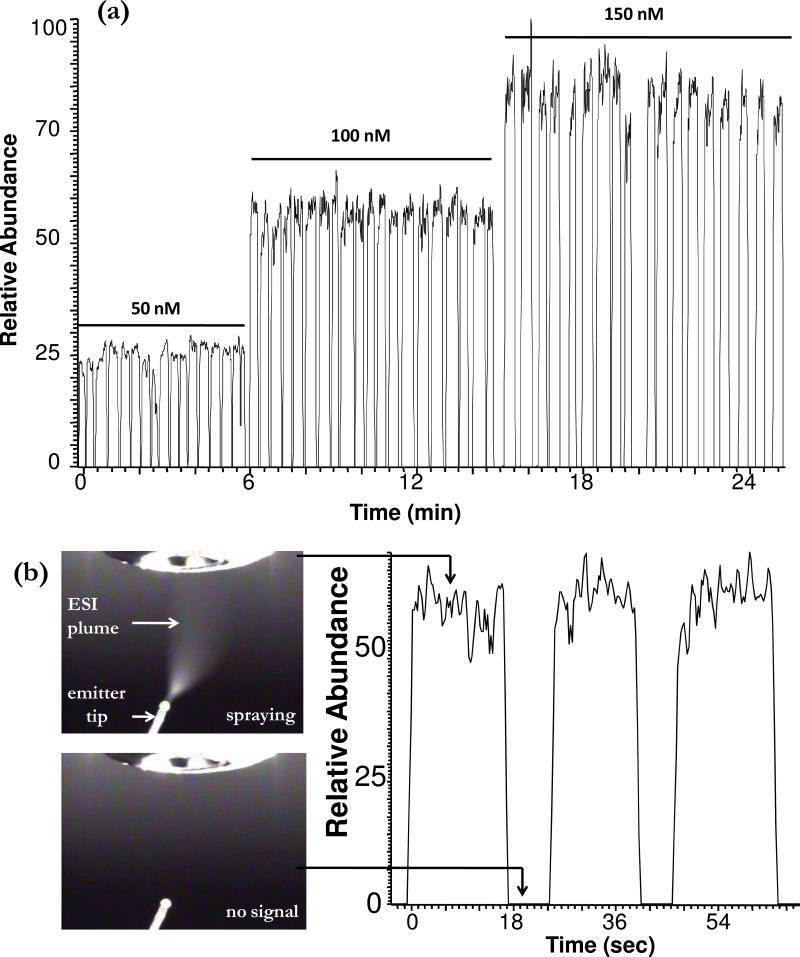
When cartridges were pumped into the emitter, sample plugs transferred from the Teflon tubing to the emitter tip (Supplemental figure 1) and emerged from the outlet with no coalescence of back-to-back plugs resulting in pulses of electrospray plumes, electrospray current, and ion signal (Figure 2). Electrospray current fluctuated between 0.0 ± 0.2 μAmp and 1.2 ± 0.2 μAmp as air and sample plugs alternately filled the tips. Electrospray signal rapidly stabilized as each new plug entered the emitter so that a series of plugs could be analyzed by continually pumping the cartridge into the emitter (Figure 2b). Figure 2a illustrates the extracted ion current for a series of plugs containing leu-enkephalin, at progressively higher concentration, that were pumped into the emitter tip at 200 nL/min resulting in samples detected at 25 s intervals. For a series of plugs containing 100 nM leu-enkephalin, signal RSDs were ∼3.1% (n = 20). The LOD for leu-enkephalin detected by MS3 was ∼1 nM. This detection limit is a substantial improvement over previous ESI-MS analysis of droplet streams.30 The improved LOD is due in part to the system allowing direct injection of the plugs without dilution and compatibility with lower flow rates that improve ionization efficiency.
Figure 2.
(a) Extracted ion current for a series of 50 nL plugs with increasing concentrations of leu-enkephalin dissolved in 50% methanol, 1% acetic acid in water. Plugs were segmented with a 3 mm gap of air and pumped at 200 nL/min from a 150 μm i.d. Teflon tube. Ion signal is for MS3 at 556→397→278, 323, 380 m/z. (b) Expanded view of extracted ion trace for 3 plugs of 100 nM leu-enkephalin from (a). Pictures to the left show the electrospray tip when sample is emerging (top) and when air is emerging (bottom) and corresponding signals.
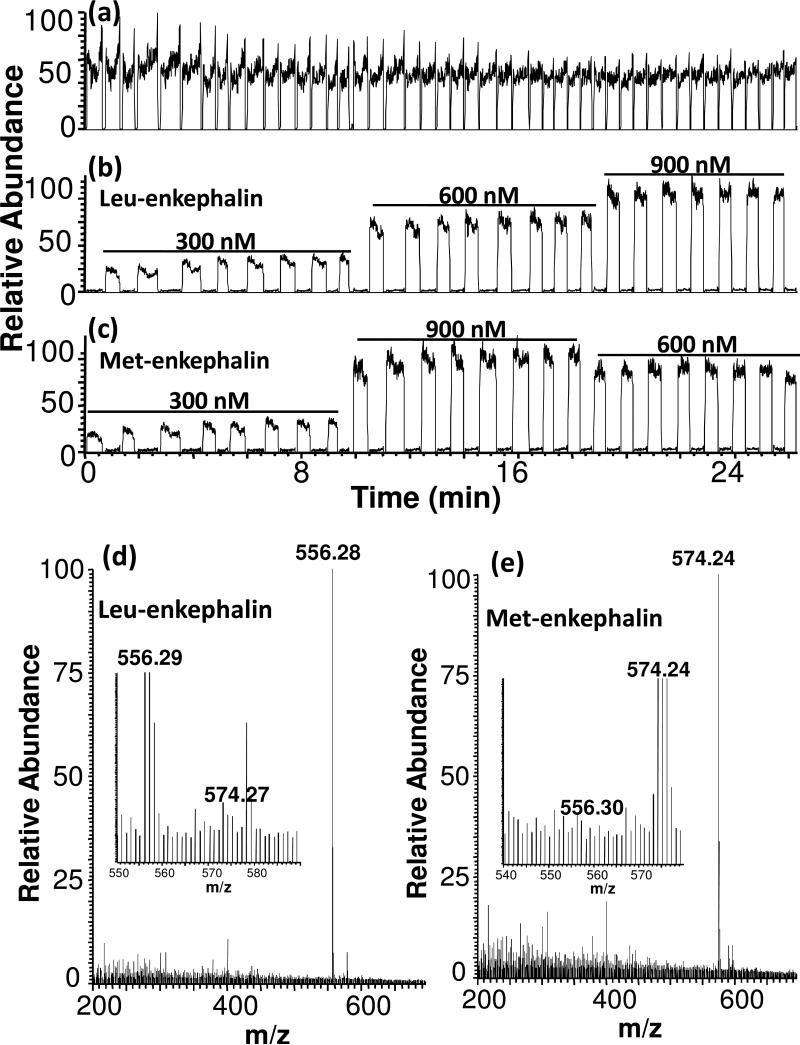
Carry-over between plugs was evaluated by preparing cartridges with different concentrations of leu-enkephalin and separating them by plugs containing only solvent. Based on this experiment, we observed carry-over <1% for a 500 nM solution followed by blank and <0.1% for a 100 nM solution. (If the cartridge was not pre-filled with oil, the carry-over was ∼4% at 500 nM. ) The low carry-over allows different samples to be entered back-to-back for analysis as illustrated by Figure 3 which shows extracted ion chromatograms and mass spectra from a series of plugs that alternately contained leu-enkephalin and met-enkephalin at different concentrations. Low cross-contamination is demonstrated by the lack of signal for met-enkepahlin in leu-enkephalin plugs and vice versa (Figure 3b, c, and d). Further reduction of carry-over may be possible by chemically modifying the interior of the emitter tip with fluorinated alkanes.
Figure 3.
Analysis of a series of plugs that alternately contain leu-enkephalin and met-enkephalin by single stage MS. Plugs were 100 nL with 5 mm gaps of air between them and pumped into the emitter at 200 nL/min. (a) Total ion current for entire sequence of plugs. (b) Extracted ion recording for leu-enkephalin at 556 m/z at concentrations indicated. (c) Extracted ion recording for met-enkephalin at 574 m/z at concentrations indicated. (d) Mass spectrum acquired during elution of a leu-enkphalin sample. Inset shows expanded view shows that signal for met-enekphalin (574 m/z) in this plug is slightly above the noise. (e) Mass spectrum acquired during elution of a met-enkphalin sample. Inset shows expanded view shows that signal for leu-enekphalin (556 m/z) in this plug is not above the noise.
For most experiments, some variation in the time between sample peaks was observed. This variation is mainly due to differences in the length of gaps formed during creation of the cartridge. More sophisticated methods of creating plugs may eliminate this problem.
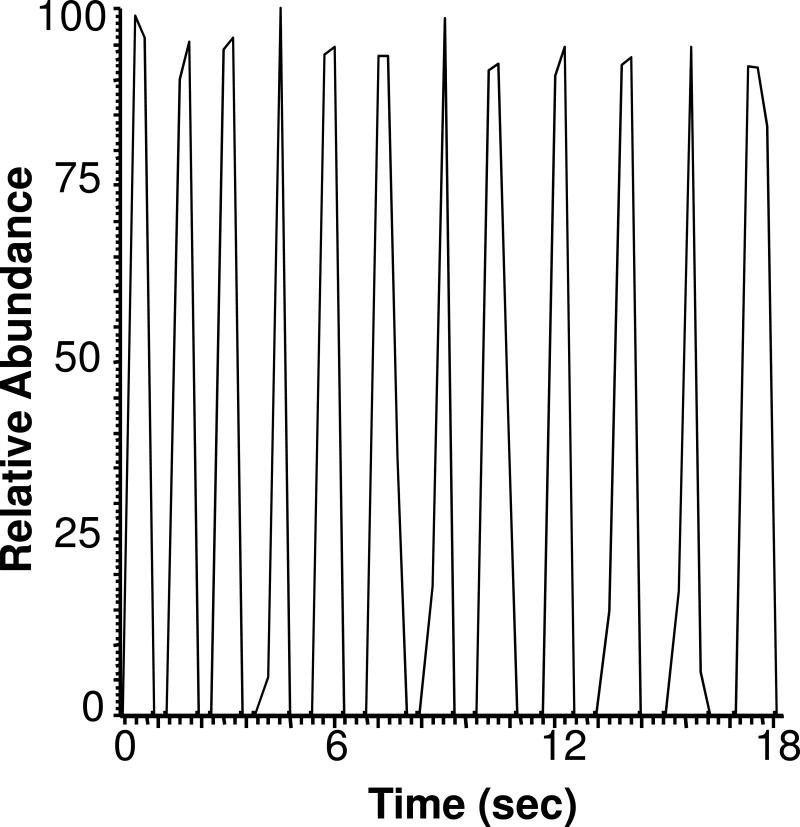
Throughput for sample analysis can be varied by altering the droplet size, air-gap between plugs, and flow rate. By decreasing the capillary diameter to 75 μm, it was possible to create 13 nL plugs (3 mm long) separated by 3 mm long air gaps. Pumping this cartridge into the emitter at 600 nL/min resulted in analysis of a sequence of plugs at 0.8 Hz with an RSD of 2.8% (see Figure 4 for example). 50 samples contained in a 30 cm long tube were analyzed in 1.25 min using this approach. It may be possible to further increase the flow rate or reduce the capillary diameter and plug volume to generate higher density of samples and higher-throughput. Further increases in throughput would require a mass spectrometer that could record spectra fast enough to keep pace with sample introduction. In this experiment, the mass spectrometer was operated in MS3 mode and 0.33 s was required to collect a spectrum. Therefore, only 3−4 spectra were collected across the signal peaks that were 1.2 s wide. Conversely, the flow rate could be varied to stop- or ultra low-flow (< 10nL/min) conditions as each sample plug elutes from the emitter, to allow MSn experiments on multiple masses and to take further advantage of the nanoelectrospray benefits of ionization efficiency31 and equimolar response.32
Figure 4.
High-throughput plug analysis. Extracted ion current for a series of 12 plugs of 200 nM leu-enkephalin in 50% methanol and 1% acetic acid samples. Each plug was 13 nL volume, separated by a 3 mm air gap, and pumped into the emitter at 600 nL/min. Ion signal is for MS3 at 556→397→278, 323, 380 m/z.
In preliminary studies we found that similar results could be obtained by directly infusing samples segregated by oil or sample trains that had air-oil-air-sample sequences. In these cases, the oil also sprayed from the tip. Using oil-gapped samples may prove advantageous in some applications..
These results show that direct ESI-MS analysis of samples in a segmented flow stream can be performed with little carry-over, good sensitivity, no dilution, and high-speed. Sample consumption is efficient as all the sample that is removed from the well is used in the mass spectrometer. We used plugs as small as 13 nL in these experiments, but further study is required to determine the lower limits of sample consumption. An important advantage of this approach to sample introduction is that the duty cycle for the mass spectrometer is high because the time spent rinsing between samples is minimal and every sample plug is automatically injected. We envision that this novel approach to sample introduction for MS could have many applications including high-throughput screening of label-free reactions, off-line coupling of separations methods to ESI-MS, monitoring reactions that are performed in plugs, and clinical diagnostics. These different applications will be made possible by taking advantage of microfluidic processing of multiphase flows.
Supplementary Material
Supporting Information
Supplemental Figure 1. Transfer of plugs into electrospray emitter. Sequence of photographs showing a plug approaching emitter tip (left), entering (middle), and washing out (right) taken at 12 s intervals. Teflon tubing is 150 μm i.d., emitter capillary 50 μm i.d., and plugs 50 nL. Flow rate was 200 nL/min.
Acknowledgements
This work was supported by NIH R37-EB003320, NSF CHE-0809013, and New Objective.
Literature Cited
- 1.Chen DLL, Ismagilov RF. Curr. Opin. Chem. Biol. 2006;10:226–231. doi: 10.1016/j.cbpa.2006.04.004. [DOI] [PMC free article] [PubMed] [Google Scholar]
- 2.Song H, Chen DL, Ismagilov RF. Angew. Chem.-Int. Edit. 2006;45:7336–7356. doi: 10.1002/anie.200601554. [DOI] [PMC free article] [PubMed] [Google Scholar]
- 3.Linder V, Sia SK, Whitesides GM. Anal. Chem. 2005;77:64–71. doi: 10.1021/ac049071x. [DOI] [PubMed] [Google Scholar]
- 4.Chabert M, Dorfman KD, de Cremoux P, Roeraade J, Viovy JL. Anal. Chem. 2006;78:7722–7728. doi: 10.1021/ac061205e. [DOI] [PubMed] [Google Scholar]
- 5.Khan SA, Gunther A, Schmidt MA, Jensen KF. Langmuir. 2004;20:8604–8611. doi: 10.1021/la0499012. [DOI] [PubMed] [Google Scholar]
- 6.Garstecki P, Fuerstman MJ, Stone HA, Whitesides GM. Lab Chip. 2006;6:693–693. doi: 10.1039/b510841a. [DOI] [PubMed] [Google Scholar]
- 7.Hashimoto M, Shevkoplyas SS, Zasonska B, Szymborski T, Garstecki P, Whitesides GM. Small. 2008;4:1795–1805. doi: 10.1002/smll.200800591. [DOI] [PubMed] [Google Scholar]
- 8.Fidalgo LM, Abell C, Huck WTS. Lab Chip. 2007;7:984–986. doi: 10.1039/b708091c. [DOI] [PubMed] [Google Scholar]
- 9.Sgro AE, Allen PB, Chiu DT. Anal. Chem. 2007;79:4845–4851. doi: 10.1021/ac062458a. [DOI] [PMC free article] [PubMed] [Google Scholar]
- 10.Kuo JS, Spicar-Mihalic P, Rodriguez I, Chiu DT. Langmuir. 2003;19:250–255. [Google Scholar]
- 11.He M, Kuo JS, Chiu DT. Langmuir. 2006;22:6408–6413. doi: 10.1021/la060259g. [DOI] [PMC free article] [PubMed] [Google Scholar]
- 12.Chen D, Du WB, Liu Y, Liu WS, Kuznetsov A, Mendez FE, Philipson LH, Ismagilov RF. Proc. Natl. Acad. Sci. U. S. A. 2008;105:16843–16848. doi: 10.1073/pnas.0807916105. [DOI] [PMC free article] [PubMed] [Google Scholar]
- 13.Song H, Tice JD, Ismagilov RF. Angew. Chem.-Int. Edit. 2003;42:768–772. doi: 10.1002/anie.200390203. [DOI] [PubMed] [Google Scholar]
- 14.Adamson DN, Mustafi D, Zhang JXJ, Zheng B, Ismagilov RF. Lab Chip. 2006;6:1178–1186. doi: 10.1039/b604993a. [DOI] [PMC free article] [PubMed] [Google Scholar]
- 15.Link DR, Anna SL, Weitz DA, Stone HA. Phys. Rev. Lett. 2004;92:4. doi: 10.1103/PhysRevLett.92.054503. [DOI] [PubMed] [Google Scholar]
- 16.Shestopalov I, Tice JD, Ismagilov RF. Lab Chip. 2004;4:316–321. doi: 10.1039/b403378g. [DOI] [PubMed] [Google Scholar]
- 17.Song H, Li HW, Munson MS, Van Ha TG, Ismagilov RF. Anal. Chem. 2006;78:4839–4849. doi: 10.1021/ac0601718. [DOI] [PMC free article] [PubMed] [Google Scholar]
- 18.He MY, Sun CH, Chiu DT. Anal. Chem. 2004;76:1222–1227. doi: 10.1021/ac035196a. [DOI] [PubMed] [Google Scholar]
- 19.Huang KD, Yang RJ. Electrophoresis. 2008;29:4862–4870. doi: 10.1002/elps.200800392. [DOI] [PubMed] [Google Scholar]
- 20.Song H, Ismagilov RF. J. Am. Chem. Soc. 2003;125:14613–14619. doi: 10.1021/ja0354566. [DOI] [PMC free article] [PubMed] [Google Scholar]
- 21.Snyder LR. Anal. Chim. Acta. 1980;114:3–18. [Google Scholar]
- 22.Furman WB. Continuous-Flow Analysis. Theory and Practice. New York: 1976. [Google Scholar]
- 23.Edgar JS, Pabbati CP, Lorenz RM, He MY, Fiorini GS, Chiu DT. Anal. Chem. 2006;78:6948–6954. doi: 10.1021/ac0613131. [DOI] [PMC free article] [PubMed] [Google Scholar]
- 24.Roman GT, Wang M, Shultz KN, Jennings C, Kennedy RT. Anal. Chem. 2008;80:8231–8238. doi: 10.1021/ac801317t. [DOI] [PMC free article] [PubMed] [Google Scholar]
- 25.Kautz RA, Goetzinger WK, Karger BL. J. Comb. Chem. 2005;7:14–20. doi: 10.1021/cc0498940. [DOI] [PubMed] [Google Scholar]
- 26.Hatakeyama T, Chen DLL, Ismagilov RF. J. Am. Chem. Soc. 2006;128:2518–2519. doi: 10.1021/ja057720w. [DOI] [PMC free article] [PubMed] [Google Scholar]
- 27.Karger BL, Kirby DP, Vouros P, Foltz RL, Hidy B. Anal. Chem. 1979;51:2324–2328. [Google Scholar]
- 28.Noguchi O, Oshima M, Motomizu S. Anal. Sci. 2008;24:631–635. doi: 10.2116/analsci.24.631. [DOI] [PubMed] [Google Scholar]
- 29.Westphall MS, Jorabchi K, Smith LM. Anal. Chem. 2008;80:5847–5853. doi: 10.1021/ac800317f. [DOI] [PMC free article] [PubMed] [Google Scholar]
- 30.Fidalgo LM, Whyte G, Ruotolo BT, Benesch JLP, Stengel F, Abell C, Robinson CV, Huck WTS. Angew. Chem.-Int. Edit. 2009;48:4. doi: 10.1002/anie.200806103. [DOI] [PubMed] [Google Scholar]
- 31.Schneider BB, Javaheri H, Covey TR. Rapid Commun. Mass Spectrom. 2006;20:1538–1544. doi: 10.1002/rcm.2511. [DOI] [PubMed] [Google Scholar]
- 32.Valaskovic GA, Utley L, Lee MS, Wu JT. Rapid Commun. Mass Spectrom. 2006;20:1087–1096. doi: 10.1002/rcm.2414. [DOI] [PubMed] [Google Scholar]
Associated Data
This section collects any data citations, data availability statements, or supplementary materials included in this article.
Supplementary Materials
Supporting Information
Supplemental Figure 1. Transfer of plugs into electrospray emitter. Sequence of photographs showing a plug approaching emitter tip (left), entering (middle), and washing out (right) taken at 12 s intervals. Teflon tubing is 150 μm i.d., emitter capillary 50 μm i.d., and plugs 50 nL. Flow rate was 200 nL/min.


