Abstract
Microfabricated structures utilizing pyrolyzed photoresist have been shown to be a useful for monitoring electrochemical processes. These previous studies, however, were limited to constant potential measurements and slow scan voltammetry. Work described in this report utilizes microfabrication processes to produce devices that enable multiple fast-scan cyclic voltammetry (FSCV) waveforms to be applied to different electrodes on a single substrate. This enabled the simultaneous, decoupled, detection of dopamine and oxygen. This paper describes the fabrication process of these arrays and shows that pyrolyzed photoresist electrodes possess comparable surface chemistry and electrochemical properties to PAN type, T-650, carbon fiber microelectrodes using background-subtracted FSCV. The functionality of the array is discussed in terms of the degree of crosstalk in response to flow injections of physiologically relevant concentrations of dopamine and oxygen. Finally, other applications of pyrolyzed photoresist microelectrode arrays are shown, including: spatially resolved detection of analytes and combining FSCV with amperometry for the detection of dopamine.
Keywords: Pyrolyzed Photoresist, Microelectrode Arrays, Fast Scan Cyclic Voltammetry, Dopamine, Oxygen
INTRODUCTION
Scientists have used various electrochemical detection schemes to analyze concentrations of biological species in vivo and in vitro. 1 Background-subtracted fast-scan cyclic voltammetry (FSCV) has been shown to be very useful in biological studies, especially studies in the brain, as it is able to identify easily oxidized compounds, such as catecholamines.2–4 The FSCV technique has advantages over many electrochemical techniques as it provides an analyte-selective response with subsecond temporal resolution.3 Using FSCV, the electrochemical characterization of catecholamine oxidation and reduction on carbon fiber microelectrodes has been well described and recently optimized.5 This has allowed the detection and identification of naturally occurring transient release of catecholamines as short as 200 ms in duration in vivo. 5, 6 Nevertheless, despite its advantages, this technique has not yet been linked with microfabricated microelectrode arrays (MEAs).
Most studies using FSCV have been confined to measurements at a single electrode. Arrays enable observation of how different neurotransmitters and neuroanatomical areas function together, and provide quantitative insights into the integrative nature of the brain. Microelectrode arrays (MEAs), normally constructed using microfabrication techniques, precisely placed microwires, or electrodes encased in pulled glass; allow detection within the same or different anatomical regions as well as the detection of multiple biological analytes, simultaneously.7, 8 For example, Ewing and co-workers have developed a multi-electrode array using multi-bore capillary tubing for the amperometric detection of neurotransmitter release in vitro. 9 Unlike traditional methods of electrode fabrication, however, microfabrication techniques allow the electrodes to be made efficiently, through batch processing, and with very reproducible electrode surface area, via photolithography.
MEAs have been constructed using a variety of materials as the working electrode. Many MEAs have been successfully constructed and implemented using metallic substrates.10, 11 Using FSCV however, metallic electrodes are limited, in the electrochemical sense, by the small potential window in which they can operate in ionic solutions.12 The propensity of metal electrodes to biofoul also becomes an obstacle when detecting physiologically relevant concentrations in vivo. Additionally, microfabricated electrodes using noble metals have the disadvantage of involving expensive sputtering or evaporation equipment, in addition to being expensive materials themselves. For these reasons electrochemists have preferred carbonaceous materials for in vivo electrochemical detection of biological species.13 Carbon materials have previously been sputtered on a substrate to create arrays, however the carbon generated using this process has less than desirable electrochemical properties when compared to carbon-fiber microelectrodes.14 Therefore, we investigated the use of pyrolyzed photoresist films for the working electrodes in MEAs using the FSCV technique.
Work done by McCreery and Madou has shown that pyrolyzed photoresist films (PPF) are structurally and electrochemically similar to glassy carbon.14–17 Hermans et al. has also shown that PPF films can be used to monitor electrochemical processes on PPF coated tungsten electrodes.18 PPF films, however, have the added advantage of being photodefinable making them easily compatible with photolithographic techniques.14,19 This compatibility eliminates the need for complicated and costly fabrication processes and has allowed for some very useful devices to be made. For example, interdigitated microelectrodes have been made from pyrolyzed photoresist films.19 While these structures have been useful, interdigitated arrays are not suitable for use with in vivo FSCV. In addition to poor spatial resolution, large electrochemical areas would cause large charging currents, saturating amplifiers at the high gains necessary to see small concentrations of neurotransmitters. Screen printing might be suitable for this type of electrode fabrication, however the advantage of using photoresist as a electrode material enables far greater resolution and thinner films to be obtained.20
In this study, microelectrode arrays (MEAs) made from pyrolyzed photoresist films were microfabricated and compared to PAN type (T-650) carbon fibers using FSCV to characterize simultaneous measurements of important biological analytes. Pyrolyzed carbon MEAs were then used in various applications. First, simultaneous detection of dopamine at four spatially different locations, 100 μm apart, is shown. Second, the concurrent use of amperometric and FSCV detection methods, which combines advantages of the both techniques, is demonstrated. Finally, simultaneous detection of different analytes, oxygen and dopamine, with decoupling of electrochemical signals is accomplished.
EXPERIMENTAL
Chemicals
All chemicals were obtained from Sigma-Aldrich (St. Louis, MO) and used as received. Aqueous solutions were prepared using doubly deionized water. To characterize the electrodes response to dopamine and oxygen, flow injection analysis experiments were carried out in a TRIS buffer solution (pH 7.4) consisting of 15 mM TRIS, 140 mM NaCl, 3.25 mM KCl, 1.2 mM CaCl2, 1.25 mM NaH2PO4, 1.2 MgCl2, and 2.0 mM Na2SO4, as previously described.5 Stock solutions of dopamine were prepared in 0.1 N HClO4, and were diluted immediately prior to each experiment. Determination of the concentration of oxygen in solution were done as previously described.21
Fabrication of PPF Microarrays
PPF microelectrode arrays were fabricated in the Biomedical Microsensor Laboratory (BMMSL) at N.C. State University. Fabrication of PPF was done as previously reported14,15,22 with some modifications that allow the arrays to be coupled with FSCV. After an application of an adhesion promoter (hexamethyldisilazane (HMDS)) a positive tone photoresist (AZ1518, AZ Electric Materials, Branchburg, NJ) was spun on a 200 μm thick fused silica substrate (University Wafer, Inc., Boston, MA) at 3000 r.p.m. for 45 s. This resulted in a 2 μm thick layer of photoresist. After exposure and development of the desired pattern for the electrode arrays, the photoresist was pyrolyzed by subjecting it to 1000°C under a forming gas atmosphere (5% H2, 95% N2) in a quartz tube furnace (Sentro Tech, Inc., Berea, OH). The temperature was ramped at 5°C/min and held at 1000°C for 60 min. After pyrolysis, the film was then allowed to cool to room temperature before exposing it to air.
A negative photoresist, SU-8 3010, was then used (MicroChem Corp., Newton, MA) to insulate the microelectrodes. After a second application of HMDS, SU-8 3010 was spun onto the substrate at 1500 r.p.m. resulting in a 12 μm thick polymer layer which was patterned using photolithographic techniques. The subsequent exposure, development, and curing of this layer defined the final microelectrode sizes and provided sufficient insulation for use in physiological buffer (pH 7.4). The film and substrate were cut into their final form using a dicing saw. External connections to the microelectrodes were made using stainless steel wires and silver epoxy (Epoxy Technology, Billerica, MA).
Raman Spectroscopy
Raman measurements were made using a custom built modular system that employs a 12 mW 632.8 nm HeNe laser (Thorlabs, Newton, NJ) coupled to an inverted microscope (Nikon Inc., Melville, NY) with a 60x dry objective (Olympus Inc., Center Valley, PA). The reflected Raman signal was analyzed through an imaging spectrograph (PI Acton, Trenton, NJ) and detected with a liquid nitrogen cooled CCD camera (PI Acton, Trenton, NJ). The laser power at the sample measured 3 mW and the laser spot was 2 μm in diameter. Collection times were 20 s.
Flow Injection Apparatus
As previously described5,12,23,24, a flow injection system was constructed using a 6 port injection valve (Upchurch Scientific, Oak Harbor, WA) positioned atop a two position pneumatic actuator (Rheodyne, Rohnert Park, CA). The pneumatic actuator was used in conjunction with a 12 volt solenoid valve kit (Rheodyne, Rohnert Park, CA) at 50 psi. A variable resistance infusion pump (Harvard Apparatus, Holliston, MA) was used to introduce the buffer and analytes to the electrodes, which was situated in an electrochemical cell, at a constant rate of 2 mL/min. For studies involving oxygen, glass syringes were used and the flow injection system was fitted with PEEK tubing to limit unwanted entry or loss of oxygen.
Data Acquisition
A customized version of TH-1 software (ESA, Chelmsford, MA) written in LABVIEW (National Instruments, Austin, TX) was used for waveform output and data acquisition. The software was modified to allow output of two decoupled, time independent, waveforms with 2 DAC/ADC cards (NI 6251M and NI 6052E). The third card (NI 6711) was used for triggering of the DACs and ADCs as well as for synchronization of electrochemical experiment with flow injection of the analytes.
Electrochemical experiments were done in a 2 electrode setup using an EI-400 biopotentiostat (ESA, Chelmsford, MA). Experiments with multiple working electrodes were also done in a 2 electrode setup using a “Quad UEI” head stage amplifier (UNC Department of Chemistry Electronics Shop). In both cases, a 400 V/s scan rate waveform, ranging from −0.4 V to 1.3 V, was applied to the working electrode from the DAC in reference to Ag/AgCl (Bioanalytical Systems, West Lafayette, IN). The applied waveforms were low pass filtered at 2 kHz. To minimize external electrical noise, flow injection analysis was performed inside a grounded Faraday cage.
For FSCV experiments involving the detection of dopamine and oxygen, two separate waveforms were generated. As with the single electrode experiments, the waveform for detecting dopamine was from −0.4 V to 1.3 V at 400 V/s. For the detection of oxygen, a waveform was simultaneously generated that scans from −0.4 to −1.4 at 200 V/s. The slower scan rate facilitates consistent observation of the faradic peak current of oxygen.
For constant potential amperometry experiments, the working electrode was held at a constant potential of + 0.8 V. To plot the final amperometric traces, 1000 data points were acquired over a 100 ms time frame and averaged. The amperometric data points were simultaneously acquired with the FSCV data.
Filtering, smoothing, averaging and background subtraction of acquired data were done either in TH-1 software or in MS Excel. Electrochemical data is shown in either traditional current-potential or current-time traces, plotted in GraphPad Prism 4 or as color plots obtained within the TH-1 software.
RESLUTS AND DISCUSSION
Fabrication Considerations
A good electrochemical sensor should be sensitive and selective to the target analyte. A functional array, however, should not only detect the analyte, or analytes, of interest simultaneously but should do so independently as well. Care was taken with the PPF arrays to eliminate crosstalk since any residual photoresist can be pyrolyzed to a conductive film. To address this problem, the arrays were cleaned with an air plasma for 1 min after pyrolysis and again after insulation. Subjecting the wafers to this cleaning step improves the success of fabrication and improves the performance of the sensors. Plasma treatment of carbon surfaces has also been shown to increase the amount of oxygen functional groups on carbon surfaces.25 Interestingly, these functional groups have been shown to increase the sensitivity to dopamine.5
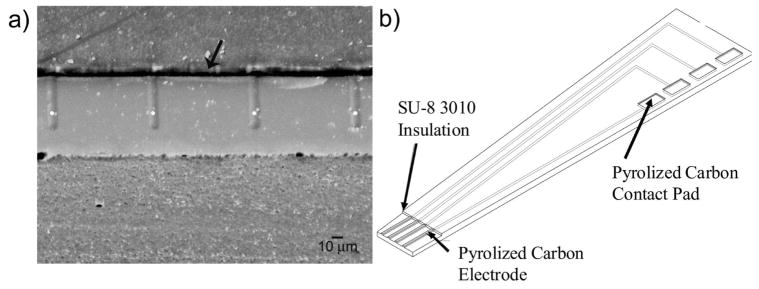
An SEM image of a PPF microarray is shown in Figure 1a. This image confirms that only nominal reflow occurs during pyrolysis of the photoresist. A qualitative measure of the film thickness was obtained by dicing and subsequent polishing of the PPF and substrate. This revealed a thickness of around 400 nm, an 80% reduction, consistent with a previously reported value of 81.60% at 1000°C.14 The small thickness of the electrodes compared to their length (50 μm) and width (10 μm) makes the electrodes essentially planar with a band geometry.26,27
Figure 1.
PPF Microelectrode Array. (a) SEM image taken of the PPF microelectrode array after dicing. Each of the four electrodes is 10 μm wide and 50 μm long. The white dots indicate the four electrodes while the arrow indicates the insulation layer (b) Drawing of device (not to scale). 81×33mm (600 × 600 DPI)
The bands are spaced 100 μm apart, avoiding diffusive crosstalk between the bands. When dopamine is sampled by fast-scan cyclic voltammetry, it adsorbs to the carbon surface in the time between scans (typically ~92 ms), a process that is controlled by diffusion.28 During this time, the magnitude of the diffusion layer formed while dopamine adsorbs can be estimated from the square root of 2Dt where D is the diffusion coefficient for dopamine, (6.0 × 10⁻⁶ cm2/s 29). This is about 11 μm. Interestingly, the diffusion distance of dopamine from the synapse in vivo has been shown to be about 10 μm.30 Therefore, any oxidation that is observed on one channel can be assumed to be strictly from the area immediately surrounding the respective electrode.
To compare PPF microelectrodes with carbon-fiber microelectrodes using FSCV, a large potential window with positive voltages reaching 1.3 V was used. Fast scan rates (400 V/s) with PPF microelectrodes on a semiconducting substrate that has a dielectric layer, such as silicon with silicon dioxide or silicon nitride, results in capacitive coupling between the pyrolyzed carbon electrode and the substrate. To avoid this problem the array was patterned on a thin fused silica wafer, a non-conductive substrate. This modification allows the full potential range used on carbon fiber microelectrodes to be implemented with the PPF microarray without crosstalk (discussed below).
Raman Spectroscopy
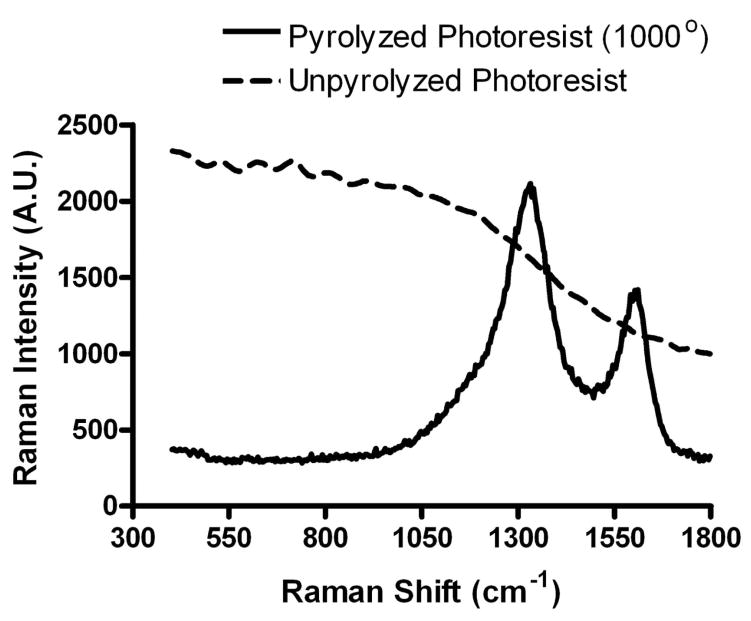
Raman spectroscopy enables rapid, non-destructive, evaluation of the electrochemical quality of the PPF used in the microelectrode arrays. The relative bands around 1360 (disordered (D) band) and 1600 cm−1 (graphitic (G) band) are typical of sp2 bonding within a graphitic carbon matrix.31 The peak area ratio of these bands is a measure of the relative entropy of the system and thus, the size of the crystal matrix.31 For example, a smaller D/G ratio would imply less entropy and larger crystalline structure of the PPF film. Experiments done by Ranganathan and coworkers show that a larger peak ratio correlates to faster electron transfer kinetics at the carbon surface.14 To evaluate the chemical composition and expected electrochemical quality, Raman spectroscopy was done on the PPF arrays. A portion of a representative Raman spectrum collected from a PPF film used in the microarrays is provided in Figure 2. While unpyrolyzed photoresist exhibited strong fluorescence, the relative peak ratio (D/G) of the pyrolyzed photoresist is similar to glassy carbon.14
Figure 2.
PPF film characterization. Raman Spectrum of AZ1518 photoresist pyrolyzed at 1000 °C for 1 hr (5 °C/min). 76×59mm (600 × 600 DPI)
Electrochemical Behavior of PPF Microelectrodes
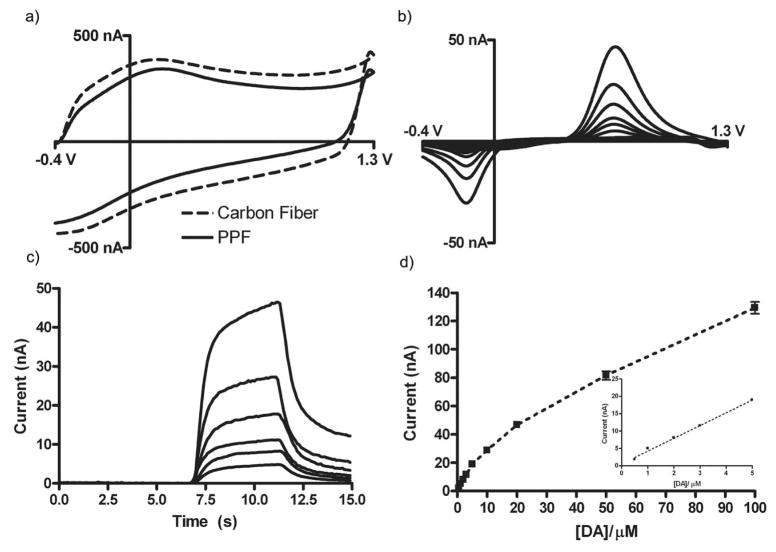
Dopamine was used to assess the electrochemical properties of the PPF microarrays using FSCV. Cyclic voltammograms were recorded at 400 V/s with an initial potential of - 0.4V and a positive limit of 1.3V. Voltammograms were repeated at 10 Hz. This waveform increases the sensitivity of carbon-fiber microelectrodes to catecholamines due to an increase in their adsorption prior to oxidation.5,23 This adsorption is promoted by the electrochemical formation of oxygen-containing functional groups on the surface as well as by using a negative rest potential between scans.5 As with carbon-fiber electrodes (Figure 3a), the background of the PPF electrode exhibited peaks around 0.2 V during the anodic scan and at −0.2 V during the cathodic scan versus an Ag/AgCl reference electrode. These peaks are consistent with previous work describing the electrooxidation of a carbon fiber.5,32
Figure 3.
Electrochemical characterization of PPF film. (a) Comparison of electrochemical background current at a PPF electrode with that at a carbon-fiber microelectrode of similar area. (b,c) Cyclic voltammograms and peak current vs. time traces showing an increasing current response for increasing concentrations of dopamine (1 μM – 20 μM), respectively. (d) Voltammetric peak current as a function of dopamine concentration. The error bars are the standard deviation (n = 24, three measurements from 8 electrodes). Inset: Linear range of dopamine on PPF electrode (n = 24, three measurements from 8 electrodes). All measurements were done at 400 V/s, 10 Hz. in TRIS buffer, pH 7.4. 148×105mm (600 × 600 DPI)
Figure 3b and 3c show background subtracted cyclic voltammograms and current vs. time traces of increasing concentrations of dopamine, respectively. The shape of the cyclic voltammogram, as well as the time response of the electrodes in response to the oxidation of increasing concentrations of dopamine, is similar to that of a T-650 carbon fiber. Figure 3d shows a calibration curve obtained with the PPF microelectrode. Large concentrations of dopamine (>3 μM) have been shown to alter the background current of a carbon-fiber microelectrode, as well as the response to dopamine, due to the electropolymerization of dopamine on the surface.33–35 Like the response at a carbon-fiber microelectrode, the response of the PPF electrode is linear up to about 5 μM (Figure 3d inset); the limit of detection is also consistent with the literature values for a carbon-fiber electrode (50 nM).5,24 The degree of variability observed between PPF electrodes is smaller than typically observed for carbon-fibers microelectrodes.5 This reflects the greater reproducibility associated with photolithographic microfabrication.
Spatially Resolved Simultaneous Detection of Dopamine
As stated above, electrodes in a useful array must be able to function simultaneously as well as independently. To test the functionality of the PPF array, a ‘quad’ headstage amplifier was implemented in conjunction with an improved version of the TH-1 software. This potentiostat/software combination is able to apply a single (or multiple) waveform(s) to the microelectrode array.
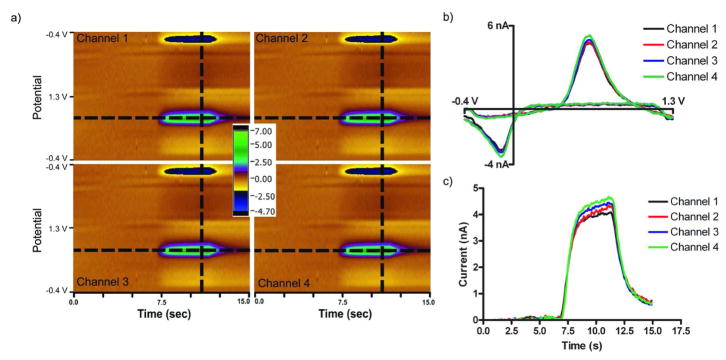
Figure 4 shows the results from an injection of a dopamine solution onto the PPF microarray. For this experiment a potential ramp was applied concurrently to the four adjacent electrodes within the array using the “Quad UEI” headstage. Upon injection of the dopamine solution, nearly identical electrochemical responses were recorded at each electrode in the array (Figure 4). The electrochemical color plots were generated by assembling cyclic voltammograms sequentially with respect to time: the ordinate is the applied potential, the abscissa is the acquisition time, and the current is shown in false color.36 The strong similarity of the color plots from each electrodes shows that they have almost identical electrochemical properties. Identical responses are also seen in individual cyclic voltammograms (Figure 4b) and in the response of the peak current in successive voltammograms (Figure 4c). The combination of the PPF array with the ‘quad’ headstage allows for the observation of chemical changes, in real time, at four different locations, all within 0.5 mm.
Figure 4.
Simultaneous dopamine detection. (a) Color plots collected concurrently on adjacent electrodes. (b) Simultaneous cyclic voltammograms of 1 μM dopamine (from vertical dashed line) (c) Simultaneous peak voltammetric current versus time traces for a 5 sec injection of 1 μM dopamine (from horizontal line). Measurements were done at 400 V/s, 10 Hz, in TRIS buffer, pH 7.4. 170×81mm (300 × 300 DPI)
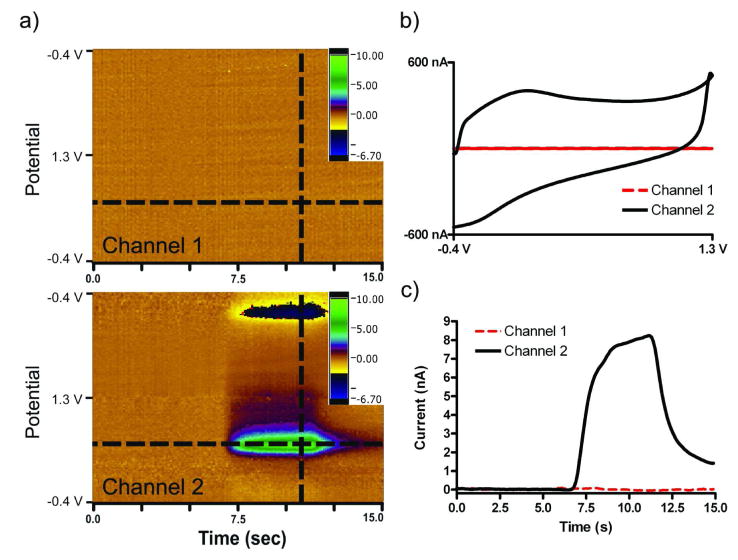
To examine capacitive coupling between electrodes, the crosstalk between the electrodes was investigated. A “standard” potential waveform was applied to one electrode, referred to as “Channel 2”, while current was monitored at an adjacent electrode, “Channel 1”, which was held at a constant potential of 0.0 V. In this configuration, crosstalk is defined as any current observed on Channel 1 due to oxidations or reductions of an electroactive species. Figure 5 shows the results from monitoring Channels 1 and 2 simultaneously during a 5 second injection of a 1 μM dopamine solution. Figure 5a shows the background subtracted color plots for the respective channels, while Figure 5b shows non-background subtracted cyclic voltammograms for the electrodes extracted at the dotted line in the color plot. Figure 5c depicts the peak current for dopamine oxidation as a function of time at adjacent electrodes extracted from the color plot as highlighted. Channel 2 showed the characteristic response to the injection of dopamine as defined earlier in this paper. In addition to no background current, Channel 1 showed no current from the oxidation or reduction of dopamine, as shown in the color plot in Figure 5a, indicating negligible chemical or capacitive coupling between the electrodes. In other words, negligible crosstalk from capacitive coupling exists between adjacent electrodes in this configuration.
Figure 5.
Crosstalk between adjacent electrodes. Current at the electrode connected to Channel 1 was recorded with an applied potential at 0.0 V Simultaneously, cyclic voltammograms were recorded on an adjacent electrode connected to Channel 2. (a) Color plots generated in response to a 5 sec, 2 μM dopamine injection. (c) Background currents of adjacent electrodes. (d) Peak current vs. time traces in response to a 5 sec, 2 μM dopamine injection. Scan rate of 400 V/s repeated at 10 Hz in TRIS buffer, pH 7.4. 165×119mm (300 × 300 DPI)
Simultaneous Detection of Dopamine with FSCV and Amperometry
FSCV and constant potential amperometry are two electrochemical methods for measuring the concentration of catecholamines on a fast time scale. The strength of amperometry is its simplicity. The constant potential condition of amperometry eliminates the contribution from nonfaradaic currents, otherwise known as a charging or “background” current, which is large in FSCV. Additionally, amperometry is less susceptible to noise than FSCV due to the larger currents that are generated and measured using the latter technique. Another advantage of this technique is the fast response of the electrode to change in catecholamine concentration.37 Since adsorption does not occur in amperometry and electron transfer rate is fast, the observed oxidative current is diffusion controlled. This feature of amperometry permits application of the method on the microsecond time scale, and is therefore able to monitor small, rapid, variations in the faradaic current caused by fluctuations in electroactive neurotransmitter concentration. For these reasons, amperometry has been used to study fast transient events such as exocytosis.37 However, the weakness of amperometry is its lack of selectivity. Since the electrode is held at a constant potential, all species that are electrochemically active at that potential will yield faradaic current.
Conversely, in FSCV the application of a negative holding potential between scans facilitates catecholamine adsorption to the electrode surface.5,23 This preconcentration leads to substantial increase in sensitivity. In addition, cyclic voltammograms of catecholamines have a characteristic shape that allows analytes of interest to be identified over other chemical species giving FSCV an advantage in selectivity over amperometry.
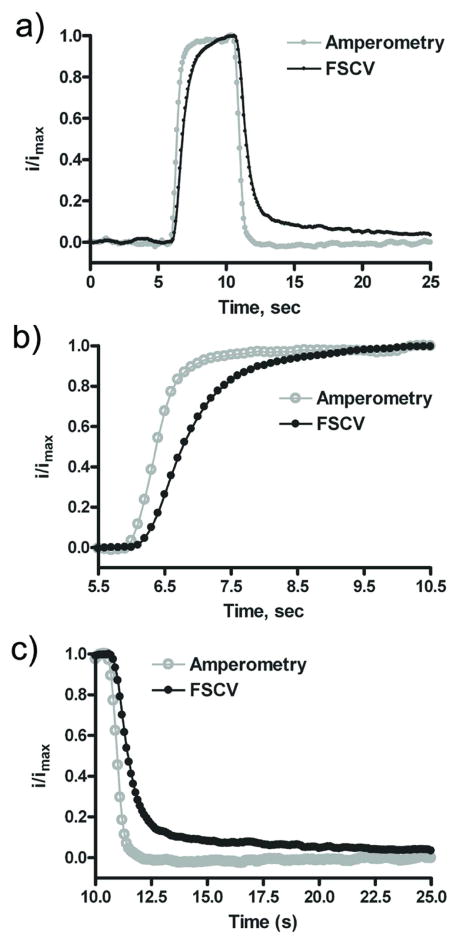
The results of the FSCV-amperometry coupled microelectrode array are shown in Figure 6a. This example shows a 1 μM injection of dopamine onto the microelectrode array. By collecting the amperometric data (Eapp = 0.8 V) as well as the cyclic voltammograms simultaneously, we are able to see both diffusion and adsorption controlled processes in real time. The rise and fall time response, τ90, (Figure 6b and 6c) was measured to be 0.8 and 0.7 s for amperometry and 1.9 and 2.1 s for FSCV. The sensitivity values were 12 pA/μM for amperometry and 5 nA/μM for FSCV. Based on the advantages and disadvantages of these two electrochemical techniques, amperometry and FSCV (as a combined technique) could be considered as complementary methods and their combination could be a fast (microsecond), sensitive (tens of nanomolar) and selective tool to identify catecholamines as well as to monitor very rapid fluctuations in concentration. This could be useful in many biological applications including monitoring uptake rates in vitro 38, and could potentially be used for a sensor that employs more sophisticated techniques such as the coupling of FSCV with amperometric detection of the electrochemically active products of enzymatic reactions.
Figure 6.
Simultaneous dopamine detection using FSCV and Amperometry. FSCV was performed at 400 V/s, at 10 Hz. The FSCV response shown is the peak current at the potential for dopamine oxidation recorded in successive voltammograms. The amperometric trace was collected at 15 kHz with Eapp = + 0.8 V (average of 5 traces). Both normalized signals are in response to a 5 second, 1 μM injection of dopamine in TRIS buffer, pH 7.4. 55×107mm (600 × 600 DPI)
Simultaneous Detection of Dopamine and Oxygen
Decoupled potential control is not only useful for applying a constant potential, however. To increase both sensitivity and selectivity for an analyte using FSCV, waveforms can be tailor-made to an analyte of interest. Various waveforms have been described that are optimum for detection of a specific analyte including serotonin7, epinephrine39, adenosine40, tyramine and octopamine41, and oxygen21. The ability to independently control the potential at separate electrodes on the same array allows for better sensitivity and selectivity for each analyte, while enabling simultaneous observation of neurobiological events.
Transient shifts in cerebral blood flow, and therefore brain oxygen levels, have been correlated with neuronal activity providing the basis for brain imaging techniques utilizing blood oxygen level-dependant (BOLD) signals; namely functional magnetic resonance imaging (fMRI).42 Increases in oxygen levels has been also shown electrochemically to be an indicator for an increase in blood flow and neural activity43; thus making simultaneous monitoring of oxygen and neurotransmitters an intriguing prospect. The mechanism for the faradaic current produced by the irreversible reduction of oxygen has been well characterized.21,44,45 Briefly, oxygen is reduced in a two-electron process mostly forming hydrogen peroxide, which is not readily oxidized at carbon electrodes.21 Previous work regarding the electrochemical detection of oxygen and dopamine using FSCV has been done at a single electrode using a single waveform.21,46 This method, however, produces low sensitivity for both analytes. Using a potential that ramps from 0 V to 0.8 V to −1.4 V and back to 0 at 400 V/s, Zimmerman and coworkers reported a sensitivity of 0.2 nA/μM for dopamine and 0.04 nA/μM for oxygen on a beveled disk electrode (major radius 35 μm, minor radius 5 μm). These values corresopond to 3.6 × 10⁻⁴ nA/μM·μm2 and 7.2 × 10⁻⁵ nA/μM·μm2 for dopamine and oxygen, respectively.21
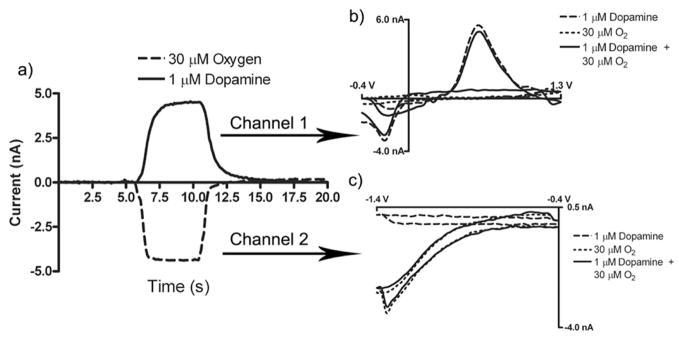
By decoupling the electrochemical signals, the applied potential can be tailored to receive optimal sensitivity on two separate electrodes. Figure 7a depicts an average of five simultaneous peak current vs. time traces taken from sequential fast scan cyclic voltammograms (7b, 7c) in response to a 5 second injection of physiologically relevant concentrations of both dopamine and oxygen. The potential applied to channel one has been tailored to maximize sensitivity for dopamine by overoxidizing the electrode surface5, while the potential on channel two is cycled between −0.4 V and −1.4 V. Apparently, overoxiding a single electrode and reducing oxygen at the same electrode can be problematic; therefore limiting the sensitivity of a single electrode scheme. Here, we report a 30 fold increase in the sensitivity to dopamine (9.0 × 10⁻³ nA/μM·μm2) as well as a threefold increase in the sensitivity for oxygen (2.1 × 10⁻⁴ nA/μM·μm2) compared to the work by Zimmerman et al.21 We attribute the increase in sensitivity for dopamine to the increase in adsorption achieved by overoxidation of the carbon surface, as well as, holding the electrode at a negative potential.5 Adjusting for the difference in scan rate, the four fold increase in sensitivity for oxygen can be accounted for by the lack of electropolymerized dopamine that can accumulate on the surface of an electrode.35 The ability to simultaneously and independent apply waveforms and collect electrochemical information from the electrodes of the MEA enables sensitive, selective detection of multiple analytes.
Figure 7.
Simultaneous detection of Dopamine and Oxygen. (a) Average of five peak current vs. time traces depicting the simultaneous detection of physiologically relevant concentrations of dopamine and oxygen. 5 sec injection of both 1 μM dopamine and 30 μM oxygen (b,c) Simultaneous cyclic voltammograms recorded using dopamine and oxygen waveforms. (Dashed line) 1 μM dopamine. (Dotted line) 30 μM oxygen. (Solid line) 1 μM dopamine and 30 μM oxygen. Data collected at 400 V/s for dopamine and 200 V/s for oxygen at 10 Hz. Experiment performed in TRIS buffer (pH 7.4). 82×44mm (600 × 600 DPI)
CONCLUSION
This study has characterized the electrochemistry of a PPF microelectrode array used with background subtracted fast scan cyclic voltammetry. The response of these arrays was shown to be very similar to PAN type, T-650, carbon-fiber microelectrodes that have been used for many years to quantitatively determine concentrations of neurotransmitters in vivo with FSCV. In addition, this study has shown the ability of the array to function in synchrony without crosstalk, as well as providing several other novel applications of the PPF microelectrode arrays. Specifically, we demonstrate the simultaneous electrochemical detection of oxygen and dopamine with waveforms optimized for each. The results show that these sensor arrays have several desirable properties that can be used for quantification of electroactive neurotransmitters. To minimize tissue damage, future work will implement further microfabrication techniques to make these probes suitable for in vivo or in vitro analyses.
Acknowledgments
The authors acknowledge financial support from NIH (NS 15841) to R.M.W., and from NIH (DA023586) to M.K.Z. We would also like to acknowledge Dr. Michael Ramsey for help regarding the dicing of quartz substrates, as well as Brian Kile, Richard Keithley and Stefan Ufer for helpful discussions regarding amperometry and electrode fabrication.
References
- 1.Wightman RM. Science. 2006;311:1570–1574. doi: 10.1126/science.1120027. [DOI] [PubMed] [Google Scholar]
- 2.Heien MLAV, Khan AS, Ariansen JL, Cheer JF, Phillips PEM, Wassum KM, Wightman RM. Proceedings of the National Academy of Sciences of the United States of America. 2005;102:10023–10028. doi: 10.1073/pnas.0504657102. [DOI] [PMC free article] [PubMed] [Google Scholar]
- 3.Robinson DL, Venton BJ, Heien MLAV, Wightman RM. Clinical Chemistry. 2003;49:1763–1773. doi: 10.1373/49.10.1763. [DOI] [PubMed] [Google Scholar]
- 4.Stamford JA, Kruk ZL, Millar J, Wightman RM. Neuroscience Letters. 1984;51:133–138. doi: 10.1016/0304-3940(84)90274-x. [DOI] [PubMed] [Google Scholar]
- 5.Heien MLAV, Phillips PEM, Stuber GD, Seipel AT, Wightman RM. Analyst. 2003;128:1413–1419. doi: 10.1039/b307024g. [DOI] [PubMed] [Google Scholar]
- 6.Robinson DL, Phillips PEM, Budygin EA, Trafton BJ, Garris PA, Wightman RM. Neuroreport. 2001;12:2549–2552. doi: 10.1097/00001756-200108080-00051. [DOI] [PubMed] [Google Scholar]
- 7.Michael AC, Borland LM. Electrochemical methods for neuroscience. CRC Press/Taylor & Francis; Boca Raton: 2007. [PubMed] [Google Scholar]
- 8.Nicolelis MAL. Methods for neural ensemble recordings. 2. CRC Press; Boca Raton: 2008. [PubMed] [Google Scholar]
- 9.Zhang B, Adams KL, Luber SJ, Eves DJ, Heien ML, Ewing AG. Analytical Chemistry. 2008;80:1394–1400. doi: 10.1021/ac702409s. [DOI] [PMC free article] [PubMed] [Google Scholar]
- 10.Burmeister JJ, Pomerleau F, Huettl P, Gash CR, Wemer CE, Bruno JP, Gerhardt GA. Biosensors & Bioelectronics. 2008;23:1382–1389. doi: 10.1016/j.bios.2007.12.013. [DOI] [PubMed] [Google Scholar]
- 11.Cheung KC, Renaud P, Tanila H, Djupsund K. Biosensors & Bioelectronics. 2007;22:1783–1790. doi: 10.1016/j.bios.2006.08.035. [DOI] [PubMed] [Google Scholar]
- 12.Zachek MK, Hermans A, Wightman RM, McCarty GS. Journal of Electroanalytical Chemistry. 2008;614:113–120. doi: 10.1016/j.jelechem.2007.11.007. [DOI] [PMC free article] [PubMed] [Google Scholar]
- 13.Sreenivas G, Ang SS, Fritsch I, Brown WD, Gerhardt GA, Woodward DJ. Analytical Chemistry. 1996;68:1858–1864. doi: 10.1021/ac9508816. [DOI] [PubMed] [Google Scholar]
- 14.Ranganathan S, McCreery R, Majji SM, Madou M. Journal of the Electrochemical Society. 2000;147:277–282. [Google Scholar]
- 15.Hebert NE, Snyder B, McCreery RL, Kuhr WG, Brazill SA. Analytical Chemistry. 2003;75:4265–4271. doi: 10.1021/ac026425g. [DOI] [PubMed] [Google Scholar]
- 16.Kim J, Song X, Kinoshita K, Madou M, White B. Journal of the Electrochemical Society. 1998;145:2314–2319. [Google Scholar]
- 17.Wang CL, Madou M. Biosensors & Bioelectronics. 2005;20:2181–2187. doi: 10.1016/j.bios.2004.09.034. [DOI] [PubMed] [Google Scholar]
- 18.Hermans A, Wightman RM. Langmuir. 2006;22:10348–10353. doi: 10.1021/la061209e. [DOI] [PMC free article] [PubMed] [Google Scholar]
- 19.Kostecki R, Song X, Kinoshita K. Electrochemical and Solid State Letters. 1999;2:465–467. [Google Scholar]
- 20.Madou MJ. Fundamentals of microfabrication: the science of miniaturization. 2. CRC Press; Boca Raton: 2002. [Google Scholar]
- 21.Zimmerman JB, Wightman RM. Analytical Chemistry. 1991;63:24–28. doi: 10.1021/ac00001a005. [DOI] [PubMed] [Google Scholar]
- 22.Kostecki R, Song X, Kinoshita K. ECS. Vol. 2. 1999. pp. 465–467. [Google Scholar]
- 23.Bath BD, Michael DJ, Trafton BJ, Joseph JD, Runnels PL, Wightman RM. Analytical Chemistry. 2000;72:5994–6002. doi: 10.1021/ac000849y. [DOI] [PubMed] [Google Scholar]
- 24.Hermans A, Seipel AT, Miller CE, Wightman RM. Langmuir. 2006;22:1964–1969. doi: 10.1021/la053032e. [DOI] [PMC free article] [PubMed] [Google Scholar]
- 25.Park S, Oh JS, Lee JR, Rhee KY. Solid State Phenomena. 2007;119:159–162. [Google Scholar]
- 26.Wehmeyer KR, Deakin MR, Wightman RM. Analytical Chemistry. 1985;57:1913–1916. [Google Scholar]
- 27.Bard AJ, Faulkner LR. Electrochemical methods: fundamentals and applications. 2. Wiley; New York: 2001. [Google Scholar]
- 28.Venton BJ, Troyer KP, Wightman RM. Anal Chem. 2002;74:539–546. doi: 10.1021/ac010819a. [DOI] [PubMed] [Google Scholar]
- 29.Venton BJ, Troyer KP, Wightman RM. Analytical Chemistry. 2002;74:539–546. doi: 10.1021/ac010819a. [DOI] [PubMed] [Google Scholar]
- 30.Phillips PEM, Hancock PJ, Stamford JA. Synapse. 2002;44:15–22. doi: 10.1002/syn.10049. [DOI] [PubMed] [Google Scholar]
- 31.Wang Y, Alsmeyer DC, Mccreery RL. Chemistry of Materials. 1990;2:557–563. [Google Scholar]
- 32.Chen PH, McCreery RL. Analytical Chemistry. 1996;68:3958–3965. [Google Scholar]
- 33.Lane RF, Hubbard AT. Analytical Chemistry. 1976;48:1287–1293. doi: 10.1021/ac50003a009. [DOI] [PubMed] [Google Scholar]
- 34.Huang J, Liu Y, Hou H, You T. Biosensors and Bioelectronics. 2008;24:632–637. doi: 10.1016/j.bios.2008.06.011. [DOI] [PubMed] [Google Scholar]
- 35.Hermans A. UNC-Chapel Hill. Chapel Hill; 2008. [Google Scholar]
- 36.Michael D, Travis ER, Wightman RM. Anal Chem. 1998;70:586A–592A. doi: 10.1021/ac9819640. [DOI] [PubMed] [Google Scholar]
- 37.Wightman RM, Jankowski JA, Kennedy RT, Kawagoe KT, Schroeder TJ, Leszczyszyn DJ, Near JA, Diliberto EJ, Viveros OH. Proceedings of the National Academy of Sciences of the United States of America. 1991;88:10754–10758. doi: 10.1073/pnas.88.23.10754. [DOI] [PMC free article] [PubMed] [Google Scholar]
- 38.Salahpour A, Ramsey AJ, Medvedev IO, Kile B, Sotnikova TD, Holmstrand E, Ghisi V, Nicholls PJ, Wong L, Murphy K, Sesack SR, Wightman RM, Gainetdinov RR, Caron MG. Proc Natl Acad Sci U S A. 2008;105:4405–4410. doi: 10.1073/pnas.0707646105. [DOI] [PMC free article] [PubMed] [Google Scholar]
- 39.Pihel K, Schroeder TJ, Wightman RM. Analytical Chemistry. 1994;66:4532–4537. [Google Scholar]
- 40.Swamy BEK, Venton BJ. Analytical Chemistry. 2007;79:744–750. doi: 10.1021/ac061820i. [DOI] [PubMed] [Google Scholar]
- 41.Cooper S, Venton B. Analytical and Bioanalytical Chemistry. 2009. in press. [DOI] [PubMed] [Google Scholar]
- 42.Raichle ME. Proceedings of the National Academy of Sciences of the United States of America. 1998;95:765–772. doi: 10.1073/pnas.95.3.765. [DOI] [PMC free article] [PubMed] [Google Scholar]
- 43.Lowry JP, Boutelle MG, Fillenz M. Journal of Neuroscience Methods. 1997;71:177–182. doi: 10.1016/s0165-0270(96)00140-9. [DOI] [PubMed] [Google Scholar]
- 44.Taylor RJ, Humffray AA. Journal of Electroanalytical Chemistry. 1975;64:85–94. [Google Scholar]
- 45.Taylor RJ, Humffray AA. Journal of Electroanalytical Chemistry. 1975;64:95–105. [Google Scholar]
- 46.Venton BJ, Michael DJ, Wightman RM. Journal of Neurochemistry. 2003;84:373–381. doi: 10.1046/j.1471-4159.2003.01527.x. [DOI] [PubMed] [Google Scholar]


