Abstract
Density functional theory/B3LYP has been employed to optimize the conformations of selected 4-arylflavan-3-ols and their phenolic methyl ether 3-O-acetates. The electronic circular dichroism spectra of the major conformers have been calculated using time-dependent density functional theory to validate the empirical aromatic quadrant rule applied to the assignment of the absolute configuration of this class of compounds. The modest 6–31G* basis set was sufficient to produce reasonable spectra. The calculated Cotton effects between 220–240 nm, crucial for the assignment of the C-4 absolute configuration, results from electronic transitions of the molecular orbitals involving the π-electrons of the spatially close aromatic A-ring and 4-aryl moieties. The sign of this Cotton effect is determined by the orientation of the 4-aryl substituent: the negative and positive Cotton effects are associated with 4α-and 4β-aryl substituents, respectively.
The proanthocyanidin class of naturally occurring polyphenols has attracted considerable attention over the last several years. Their biological and industrial applications depend on an understanding of their composition, configuration, and conformational behavior including rotation about the interflavanyl bonds and preferred conformations of the heterocyclic dihydropyran rings. Owing to the structural complexities of such polymers, essential features of their dynamic behavior are reliant on projections from monomers and oligomers with limited structural variety. A range of 4-arylflavan-3-ols has thus been synthesized1 as models for configurational and conformational studies of the naturally occurring proanthocyanidins. The conformations of the heterocyclic dihydropyran rings in these compounds were proposed based on the 1H NMR coupling constants, while the assignment of the C-4 absolute configuration by experimental electronic circular dichroism (ECD) was consistent with the aromatic quadrant rule2 and exciton coupling3 between the electronically allowed transitions of the A-and D-ring aromatic chromophores.
Recent development of density functional theory (DFT) calculations has opened a new avenue for the structural analysis of chiral molecules.4 The calculated ECD spectrum of the compound of interest provides critical conformational and configurational information: the closer the calculated and experimental ECD spectra are, the better the calculated conformation and configuration reflects the compound behavior in solution. The purpose of this study was to employ such advanced computational methods to assess the conformations and configurations of selected 4-arylflavan-3-ols in order to understand the theoretical basis of the empirical aromatic quadrant rule applied to the assignment of the absolute configuration of this class of compounds.
Results and Discussion
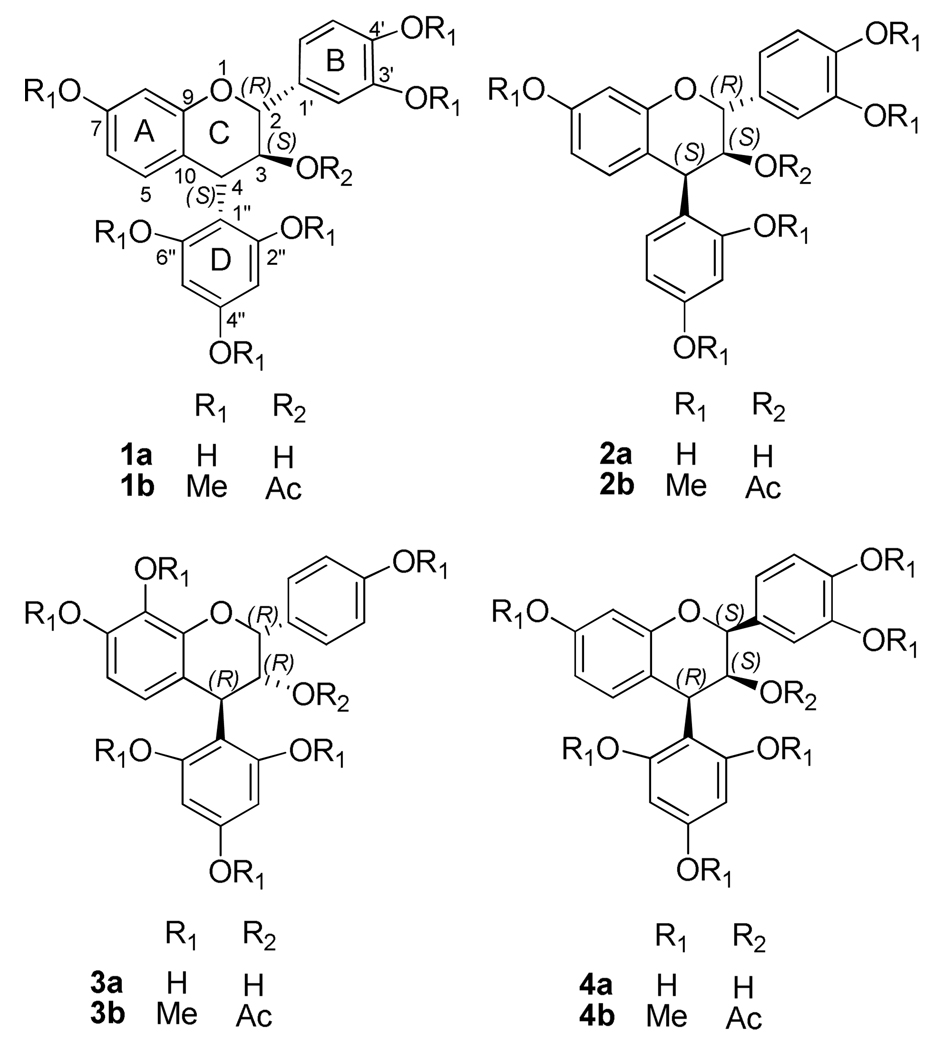
Four 4-arylflavan-3-ols, (2R,3S,4S)-3',4',7-trihydroxy-4-(2,4,6-trihydroxyphenyl)flavan-3-ol (1a), (2R,3S,4S)-3',4',7-trihydroxy-4-(2,4-dihydroxyphenyl)flavan-3-ol (2a), (2R,3R,4R)-3',7,8-trihydroxy-4-(2,4,6-trihydroxyphenyl)flavan-3-ol (3a), and (2S,3S,4R)-3',4',7-trihydroxy-4-(2,4,6-tri-hydroxyphenyl)-flavan-3-ol (4a) and their corresponding phenolic methyl ether 3-O-acetates (1b–4b), were selected as models. These molecules and their enantiomers represent all possible C-ring configurational diastereoisomers of naturally occurring proanthocyanidins. This selection was also based on the availability of experimental ECD spectra of 1b–3b and numerical experimental ECD data of 1a, 2a, and 4b.1 Compounds 1a and 1b with a 4α-aryl group and, thus, 4S absolute configuration, exhibited a high-amplitude, diagnostic negative Cotton effect (CE) in the 220–240 nm region, while compounds 2a and 2b–4b with 4β-aryl groups (4S absolute configuration for 2a and 2b; 4R for 3b and 4b) gave positive CEs in the same region. The 4-arylflavan-3-ols (1a and 2a) and their respective methyl ether 3-O-acetates (1b and 2b), devoid of intra- and inter-molecular hydrogen bonding interactions, essentially gave experimental ECD data similar to the derivatized analogs.1
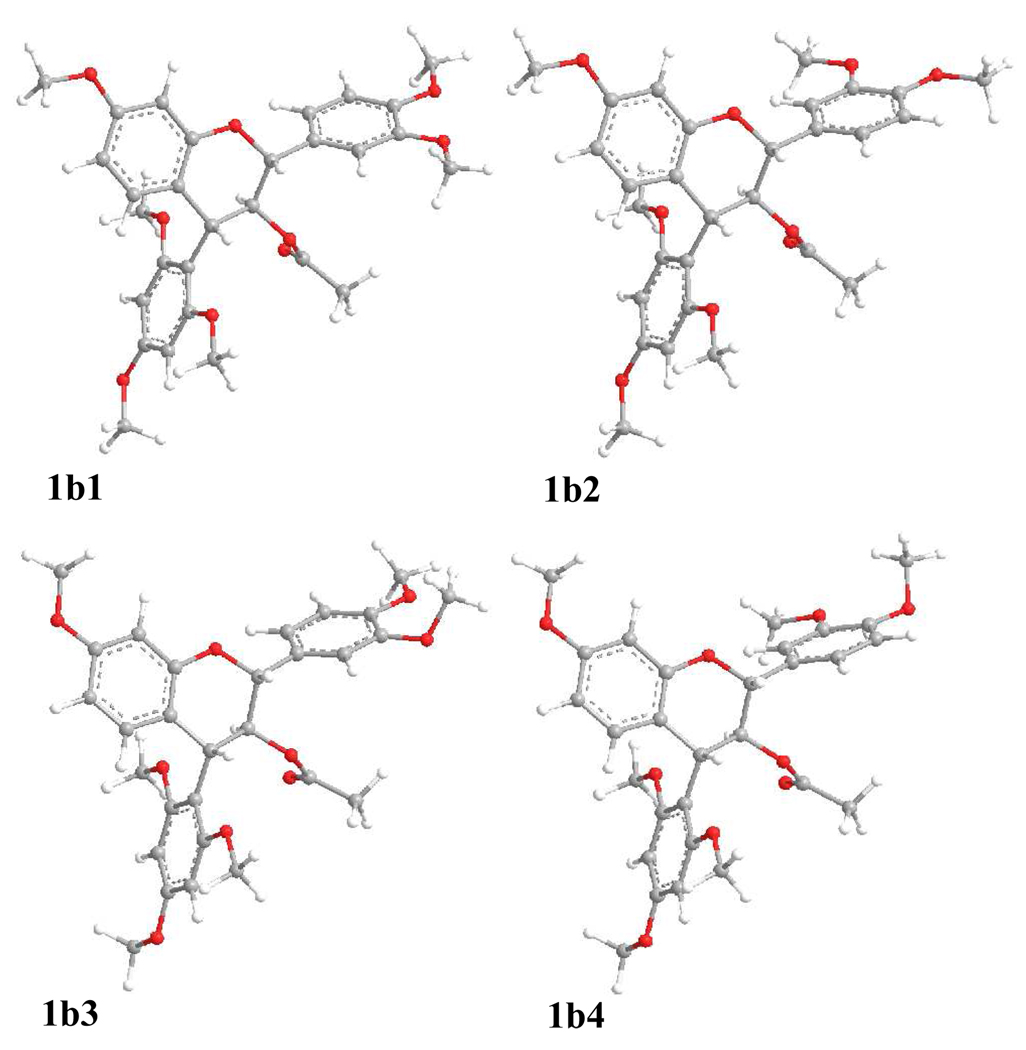
A systematic conformational search was carried out for compound 1b via Monte Carlo random search in the SYBYL 8.1 program using MMFF94 molecular mechanics force-field calculation. An energy cutoff of 10 kcal/mol was used to generate a wide window of conformers in the Boltzmann population, affording 153 conformers. For the first 50 conformers, the B-ring, acetoxy group, and D-ring are equatorially positioned while C-4 is coplanar with the A-ring. Next, the 25 conformers with lowest energies were geometrically optimized using DFT at the B3LYP/6–31G* level. Four predominant conformers, 1b1–1b4, were relocated with a Boltzmann distribution of 17.3, 44.6, 19.1, and 19.0% by Gibbs free energy (Table 1). The major differences between the four conformers are the orientation of the B-ring and O-methyl groups (Figure 1). Their key dihedral angles are shown in Table 2. The C2-O1-C9-C10 and C3-C4-C10-C9 dihedral angles are −20° and −14° to −16°, respectively, in 1b1–1b4, indicating that C-2 and C-3 of the hetereocyclic dihydropyran ring are located above and below the A/C plane, respectively, permitting the B-ring and the 3-O-acetyl group to extend equatorially. The D-ring is located below the A/C plane of the flavan-3-ol moiety, and hence in the lower left quadrant, as evidenced by the C1″-C4-C10-C9 dihedral angle of approximately −142° in the four conformers. The H-C2-C3-H dihedral angle in 1b1–1b4 ranges from 173° to 178°, supporting a large coupling constant of 10.0 Hz between H-2 and H-3 in the experimental 1H NMR spectrum, while the H-C3-C4-H dihedral angle of 166 ° to 168° is consistent with a 3J3,4 value of 9.0 – 9.8 Hz.1a–1c,1e
Table 1.
Conformational Analysis of 1b in the Gas Phase.
| species | ΔEa | PE%b | ΔE′c | PE′%d | ΔGe | PG%f |
|---|---|---|---|---|---|---|
| 1b1 | 0.48 | 20.4 | 0.49 | 18.2 | 0.56 | 17.3 |
| 1b2 | 0.00 | 45.8 | 0.00 | 41.8 | 0.00 | 44.6 |
| 1b3 | 0.67 | 14.8 | 0.54 | 16.9 | 0.50 | 19.1 |
| 1b4 | 0.52 | 19.0 | 0.35 | 23.1 | 0.50 | 19.0 |
Relative energy, relative energy with ZPE, and relative Gibbs free energy at the B3LYP/6–31G* level, respectively (kcal/mol).
Conformational distribution calculated by using the respective parameters above at the B3LYP/6–31G* level.
Figure 1.
Optimized geometries of predominant conformers of 1b at the B3LYP/6–31G* level in the gas phase.
Table 2.
Important Dihedral Angles (°) of Optimized Predominant Conformers at the B3LYP/6–31G* Level in the Gas Phase.
| 1a1 | 1a2 | 1b1 | 1b2 | 1b3 | 1b4 | 2a5 | 2a6 | 3a1 | 4a1 | 4a2 | 4a5 | 4a6 | |
|---|---|---|---|---|---|---|---|---|---|---|---|---|---|
| H-C2-C3-H | 179 | 179 | 173 | 177 | 178 | 177 | 173 | 173 | −62 | 61 | 61 | 71 | 72 |
| H-C3-C4-H | 161 | 161 | 166 | 167 | 167 | 168 | 52 | 51 | −82 | −54 | −54 | −57 | −58 |
| C2′-C1′-C2-O1 | 154 | −34 | 142 | −46 | 146 | −45 | 152 | −34 | 146 | −153 | 31 | −169 | 14 |
| C1′-C2-O1-C9 | 180 | 178 | 174 | 175 | 174 | 174 | 163 | 163 | 167 | −164 | −164 | −175 | −176 |
| C2-O1-C9-C10 | −26 | −26 | −20 | −20 | −20 | −20 | −9 | −9 | −12 | 13 | 13 | 20 | 21 |
| C3-C4-C10-C9 | −7 | −6 | −15 | −14 | −15 | −16 | −24 | −24 | −14 | 22 | 22 | 21 | 21 |
| C1″-C4-C10-C9 | −136 | −136 | −142 | −142 | −143 | −143 | 104 | 104 | 114 | 153 | 153 | 152 | 153 |
| C2″-C1″-C4-C10 | −142 | −142 | −118 | −118 | −118 | −117 | 157 | 157 | −34 | −53 | −53 | −57 | −58 |
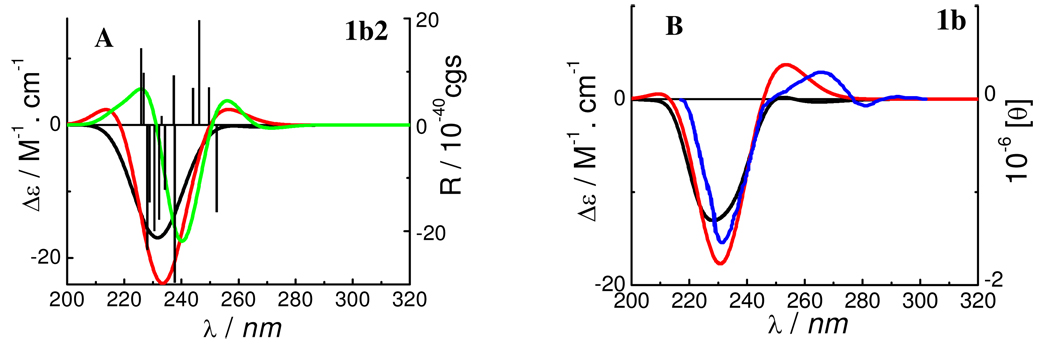
TDDFT calculations of the predominant conformer 1b2 at the B3LYP/6–31G* (gas phase), B3LYP/6–311++G**//B3LYP/6–31G* (gas phase), and B3LYP-SCRF/6–31G*//B3LYP/6–31G* [COnductor-like continuum Solvent MOdel (COSMO)5] levels afforded ECD spectra shown in Figure 2 (A). The weighted ECD spectra from the four conformers (1b1–1b4) are shown in Figure 2 (B). The excellent match of the calculated and experimental ECD spectra for compound 1b indicates that such computational methods are reliable for the conformational and configurational analysis of this class of compounds.
Figure 2.
Calculated ECD spectra of conformer 1b2 (A) and weighted and experimental ECD spectra of compound 1b (B). (— and  : at the B3LYP/6–31G* and B3LYP/6–311++G**//B3LYP/6–31G* levels in the gas phase, respectively;
  : at the B3LYP-SCRF/6–31G*//B3LYP/6–31G* level with the COSMO model in MeOH;
  : the experimental ECD spectrum in MeOH).
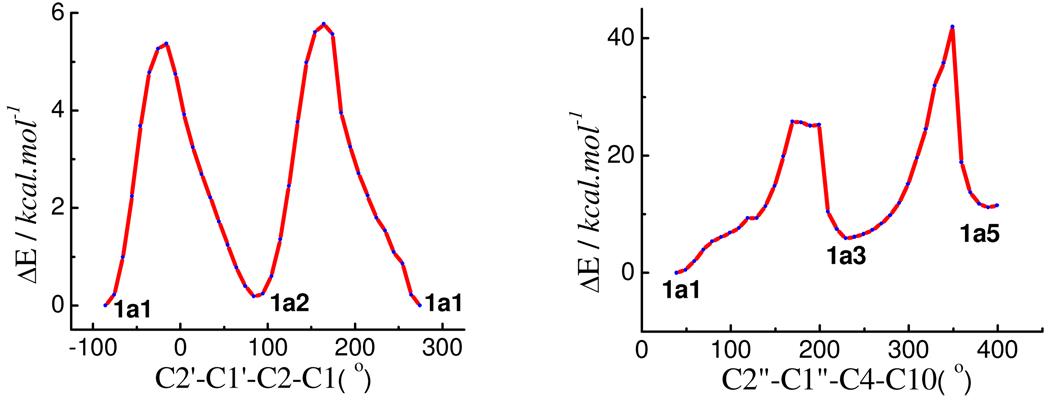
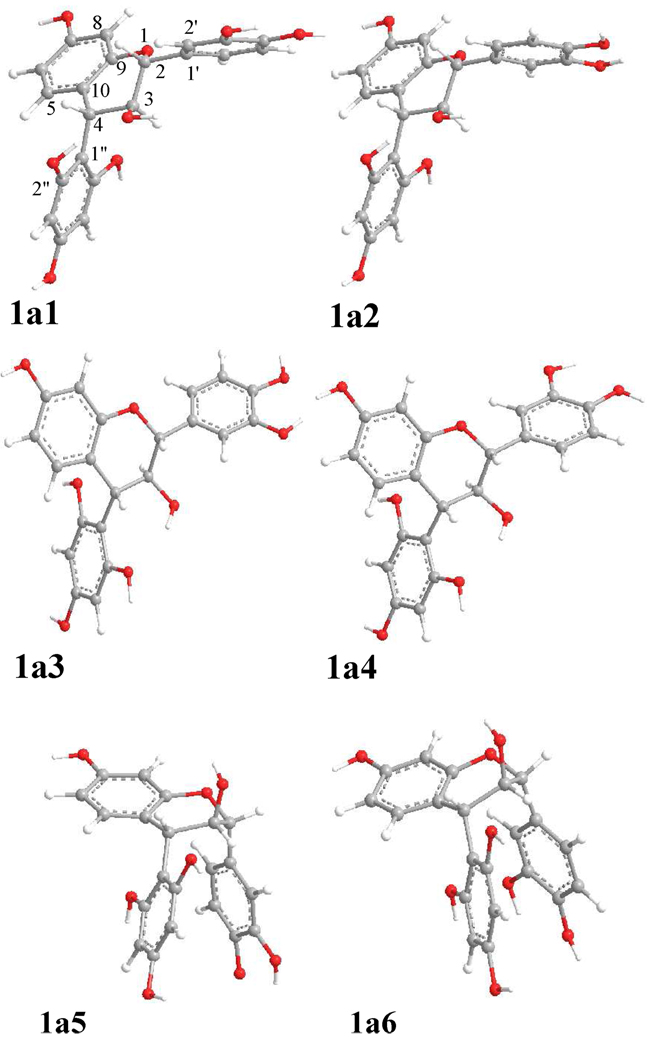
Based on the optimized conformations of 1b and consideration of the C2″OH…OC3 hydrogen bonding, a starting geometry of compound 1a was set up to scan its potential energy surfaces (PESs) by rotating the B and D-rings about the C-2-C-1′ and C-4-C-1″ bonds at the B3LYP/6–31G* level (gas phase) (Figure 3). Six minima (1a1–1a6, Figure 4) were found and relocated by further optimization at the same level and confirmed by computation of harmonic vibrational frequencies. Hydrogen bonding is present between C2″OH…OC3 in 1a1 and 1a2 and between C3OH…OC2″ in 1a3 and 1a4. It is interesting that this PES scan and optimization also afforded conformers 1a5 and 1a6 with π-stacking interactions1e between the B- and D-rings, in which the C1′-C2-O1-C9 dihedral angles are 102° and 101°, respectively, while the C1″-C4-C10-C9 dihedral angles are −111° in both conformers. However, conformational analysis indicated that 1a1 and 1a2 were the predominant conformers with populations of 52 and 48%, respectively, by Gibbs free energy (see Table 3). The key dihedral angles in 1a1 and 1a2 are similar to those in 1b1 and 1b2, respectively, except for the minor difference of the C2″-C1″-C4-C10 dihedral angle (−142° vs. −118° in 1a and 1b, respectively) (Table 2). The H-C2-C3-H and H-C3-C4-H dihedral angles are 179° and 161°, respectively, in both 1a1 and 1a2, also supporting the respective 3J2,3 and 3J3,4 1H NMR coupling constants of 10.0 and 9.8 Hz for compound 1a. 1a, 1c
Figure 3.
Potential energy surface of compound 1a at the B3LYP/6–31G* level in the gas phase by rotating the B-ring about the C-2-C-1′ and the D-ring about C-4-C-1″.
Figure 4.
Optimized geometries of conformers 1a1–1a6 at the B3LYP/6–31G* level in the gas phase.
Table 3.
Conformational Analysis of Compound 1a (au)
|
Species |
in gas phase | in MeOH | ||||||||
|---|---|---|---|---|---|---|---|---|---|---|
| ΔEa | PE%b | ΔE′c | PE′%d | ΔGe | PG%f | ΔE″g | PE″%h | ΔEsi | PEs%j | |
| 1a1 | 0.00 | 57.0 | 0.00 | 55.2 | 0.00 | 51.9 | 0.00 | 50.7 | 0.18 | 40.5 |
| 1a2 | 0.17 | 43.0 | 0.12 | 44.8 | 0.05 | 48.0 | 0.02 | 49.3 | 0.00 | 55.2 |
| 1a3 | 5.74 | 0.0 | 5.05 | 0.0 | 4.17 | 0.0 | 4.91 | 0.0 | 1.94 | 2.1 |
| 1a4 | 5.78 | 0.0 | 5.00 | 0.0 | 3.67 | 0.1 | 4.80 | 0.0 | 1.90 | 2.2 |
| 1a5 | 10.81 | 0.0 | 10.23 | 0.0 | 9.59 | 0.0 | 0.0 | 8.68 | ||
| 1a6 | 10.55 | 0.0 | 10.09 | 0.0 | 9.93 | 0.0 | 0.0 | 8.75 | ||
Relative energy, relative energy with ZPE, and relative Gibbs free energy at the B3LYP/6–31G* level, and relative energy at the B3LYP/6–311++G**//B3LYP/6–31G* level, respectively (kcal/mol).
Conformational distribution calculated by using the respective.
Relative energy and conformational distribution calculated at the B3LYP-SCRF/6–31G*//B3LYP/6–31g* level with the COSMO model, respectively.
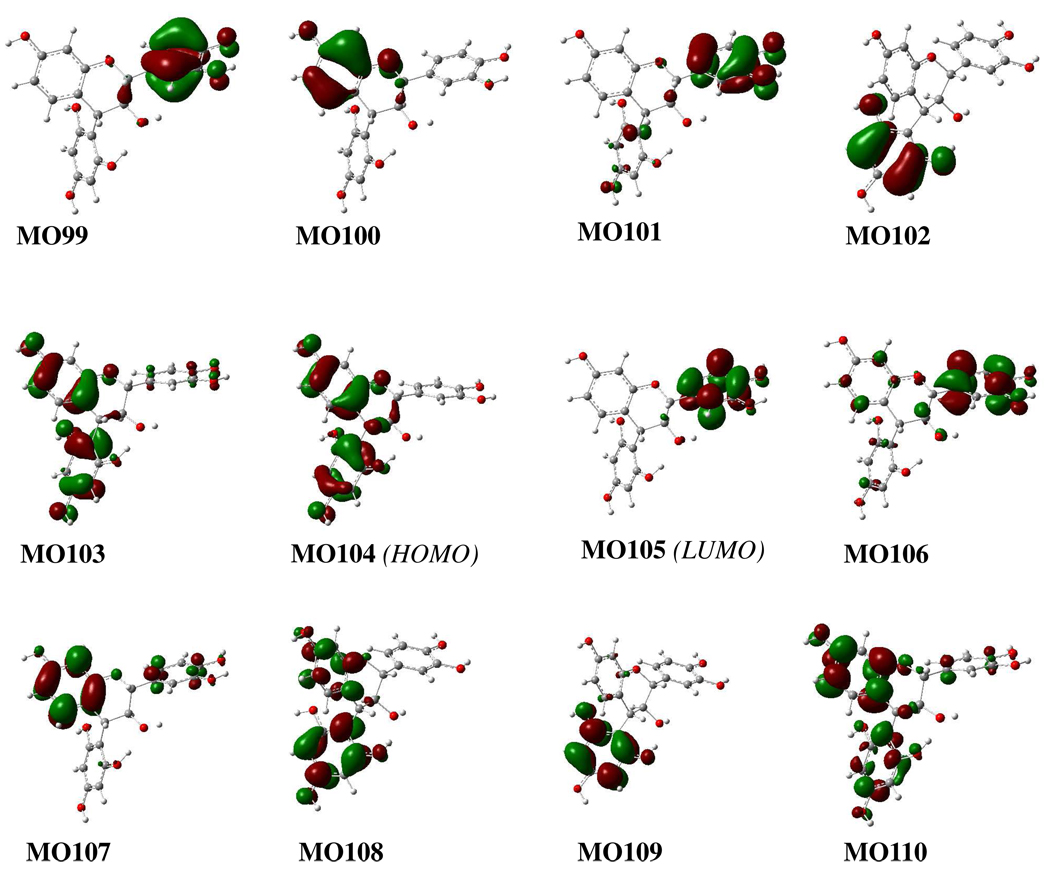
Similarly, TDDFT calculations of the ECD spectra of conformers 1a1 and 1a2 were conducted at the B3LYP/6–31G* level. The calculated CE around 230 nm corresponds well with the experimentally observed high-amplitude negative CE at 237 nm for compound 1a (Figure 5).1e It seems that this CE results from the negative rotatary strengths at 237 (MO103→MO106), 227.3 (MO104→MO108), 226.9 (MO102→MO107), 221 (MO104→MO110), and 220 (MO100→ MO106) nm in 1a1 and those at 237 (MO103→MO106), 228 (MO104→MO108), 223 (MO100→MO106), and 220.4 (MO104 →MO110) nm in 1a2 (Table 4). However, the biggest contributions are from the electronic transition from MO104→MO108 in both 1a1 and 1a2. The calculated molecular orbitals (MOs) of 1a1 show that MO104 and MO108 involve the π-electrons of the A-ring and 4-aryl moieties (Figure 6). This strongly indicates that the diagnostic CE of this class of compounds in the 220–240 nm region of their CD spectra derives from the chiral perturbation of the two spatially close aromatic chromophores, and provides theoretical evidence to interpret the empirical aromatic quadrant rule: the 4α-aryl substituent located in the lower left quadrant makes a negative contribution to the CE at 220–240 nm in the CD spectrum.1e
Figure 5.
Calculated ECD of predominant conformers of compound 1 (A, B) and its weighted ECD (C). (— and —: at the B3LYP/6–31G* and B3LYP/6–311++G**//B3LYP/6–31G* levels in the gas phase, respectively; —: at the B3LYP-SCRF/6–31G*//B3LYP/6–31G* level with the COSMO model in MeOH).
Table 4.
Important Transition States, Related Rotatory Strengths, and Oscillator Strengths of 1a1 and 1a2 at the B3LYP/6−31G* Level in the Gas Phase.
| species | transition | ΔEa (eV) | λb (nm) | fc | Rveld | Rlene |
|---|---|---|---|---|---|---|
| 104→105 | 4.75 | 261 | 0.010 | −1.6 | −1.5 | |
| 104→106 | 4.90 | 253 | 0.064 | 5.3 | 4.7 | |
| 103→105 | 4.97 | 250 | 0.034 | −5.7 | −3.8 | |
| 104→106 | 5.06 | 245 | 0.051 | 6.5 | 7.6 | |
| 103→105 | 5.10 | 243 | 0.003 | 5.5 | 5.3 | |
| 102→105 | 5.14 | 241 | 0.001 | 3.3 | 3.2 | |
| 1a1 | 103→106 | 5.22 | 237 | 0.011 | −7.4 | −7.2 |
| 104→108 | 5.45 | 227.3 | 0.098 | −26.4 | −25.9 | |
| 102→107 | 5.46 | 226.9 | 0.040 | −13.5 | −13.0 | |
| 100→106 | 5.59 | 222 | 0.039 | 19.1 | 18.5 | |
| 104→110 | 5.62 | 221 | 0.008 | −9.4 | −9.8 | |
| 100→106 | 5.64 | 220 | 0.010 | −15.6 | −16.1 | |
| 103→109 | 5.66 | 219 | 0.004 | 16.8 | 16.2 | |
| 101→107 | 5.74 | 216 | 0.015 | −20.1 | −20.8 | |
| 104→105 | 4.74 | 261 | 0.013 | 10.9 | 10.6 | |
| 104→106 | 4.90 | 253 | 0.042 | −20.8 | −18.9 | |
| 103→105 | 4.98 | 249 | 0.029 | 21.1 | 20.0 | |
| 102→105 | 5.02 | 247 | 0.006 | −5.1 | −4.9 | |
| 104→106 | 5.04 | 246 | 0.051 | 12.9 | 13.8 | |
| 103→105 | 5.08 | 244 | 0.006 | −4.0 | −3.8 | |
| 1a2 | 102→105 | 5.16 | 240 | 0.003 | 4.7 | 4.4 |
| 103→106 | 5.23 | 237 | 0.018 | −9.3 | −9.2 | |
| 104→108 | 5.44 | 228 | 0.128 | −57.2 | −56.4 | |
| 100→106 | 5.56 | 223 | 0.018 | −20.1 | −20.4 | |
| 104→110 | 5.63 | 220.4 | 0.018 | −14.2 | −14.7 | |
| 100→106 | 5.65 | 219.6 | 0.035 | 20.1 | 21.2 | |
| 103→109 | 5.65 | 219.3 | 0.013 | 7.3 | 6.6 | |
| 101→107 | 5.75 | 216 | 0.014 | 10.9 | 10.8 | |
Excited energy.
Wavelength.
Oscillator strength.
Rotatory strength in velocity form (10−40 cgs).
Rotatory strength in length form (10−40cgs).
Figure 6.
Some molecular orbitals involved in important transitions regarding ECD spectra of conformer 1a1 in the gas phase at the B3LYP/6–31G* level.
The effects of solvent and basis set have also been evaluated by computations at the B3LYP-SCRF/6–31G*//B3LYP/6–31G* level with the COSMO model in MeOH and at the B3LYP/6–311++G**//B3LYP/6–31G* level in the gas phase. The ECD curves for both conformers 1a1 and 1a2 and the weighted curve of compound 1a at both the B3LYP-SCRF/6–31G*//B3LYP/6–31G* and B3LYP/6–311++G**//B3LYP/6–31G* levels were similar to those at the B3LYP/6–31G* level, though a red shift occurred for the wavelengths of identified excitations, e.g., for conformer 1a1, the excitations at 227.3 and 226.9 nm at the B3LYP/6–31G* level in the gas phase shifted to 230 and 229 nm at the B3LYP-SCRF/6–31G*//B3LYP/6–31G* level and to 228.1 and 227.5 nm at the B3LYP/6–311++G**//B3LYP/6–31G* level, respectively.
The above results demonstrated that the calculated ECD spectra of the free phenolic 4-arylflavan-3-ol (1a) and its corresponding methyl ether 3-O-acetate (1b) were consistent with their experimental data. In addition, the modest B3LYP/6–31G* basis set was sufficient to produce reasonable spectra. To save computational time, we only performed ECD calculations of compounds 2a–4a at the B3LYP/6–31G* (gas phase) and B3LYP-SCRF/6–31G*//B3LYP/6–31G* (solution) levels, which we believe would also reflect the anticipated results from the corresponding methyl ether 3-O-acetate (2b–4b).
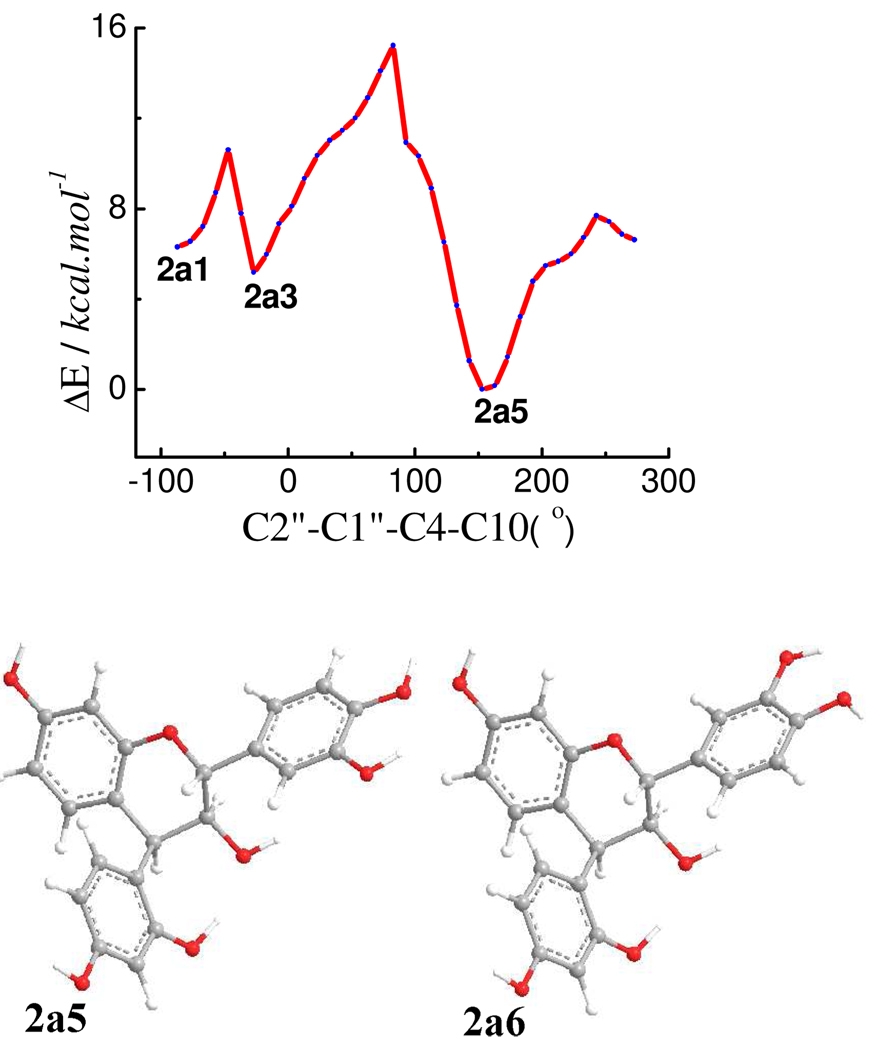
Based on the optimized geometries of 1a, the substituents at C-2, C-3, and C-4 were all set as equatorial, as a starting geometry to scan the PES of 2a at the B3LYP/6–31G* level by rotating the D-ring about the C-4-C-1″ bond (Figure 7). Six conformers (2a1–2a6) were found and relocated by optimizations at the same level. The orientation of the B-ring and the hydrogen bonding between C2″OH…OC3 and between C3OH…OC2″ in 2a1–2a4 (Figure S1, Supporting Information) are similar to those in 1a1–1a4. For 2a5 and 2a6, C2″OH…OC3 hydrogen bonding was permitted in a conformation with a C2″-C1″-C4-C10 dihedral angle of 157° (Figure 7). The C2″-C1″-C4-C3 dihedral angles in 2a1–2a6 are 38, 43, 90, 90, −80 and −80°, respectively (Table 2). Conformational analysis indicated that conformers 2a5 and 2a6 are 40 and 60% populated, respectively, by Gibbs free energy (see Table S4, Supporting Information). The H-C2-C3-H dihedral angles in all conformers of 2a are from 172° to 176° and those of H-C3-C4-H from 26° to 48°, supporting the experimental 1H NMR data (J2,3 8.0, J3,4 5.0 Hz 1a). The C1″-C4-C10-C9 and C1″-C4-C10-C5 dihedral angles are 104° and −77°, respectively, in both 2a5 and 2a6, indicating that the 4β-aryl substituent is located in the upper left quadrant, which would make a positive contribution to the CE in the 220–240 nm region of the ECD spectrum according to the empirical aromatic quadrant rule.1c,2
Figure 7.
Potential energy surface and optimized geometries of predominant conformers of compound 2a at the B3LYP/6–31G* level in the gas phase.
The calculated ECD spectra of conformers 2a5 and 2a6, weighted ECD spectra of 2a, and the experimental ECD spectrum of 2b are shown in Figure 8. It shows clearly that the calculated positive CE in the 220–240 nm region (consistent with the experimentally observed positive CE at 238 nm for 2a1e) supports the prediction by the aromatic quadrant rule.1c,2
Figure 8.
Calculated and weighted ECD spectra of 2a and experimental ECD spectrum of 2b. (—: at the B3LYP/6–31G* level in the gas phase;  : at the B3LYP-SCRF/6–31G*//B3LYP/6–31G* level with the COSMO model in MeOH;
  : the experimental ECD spectrum in MeOH).
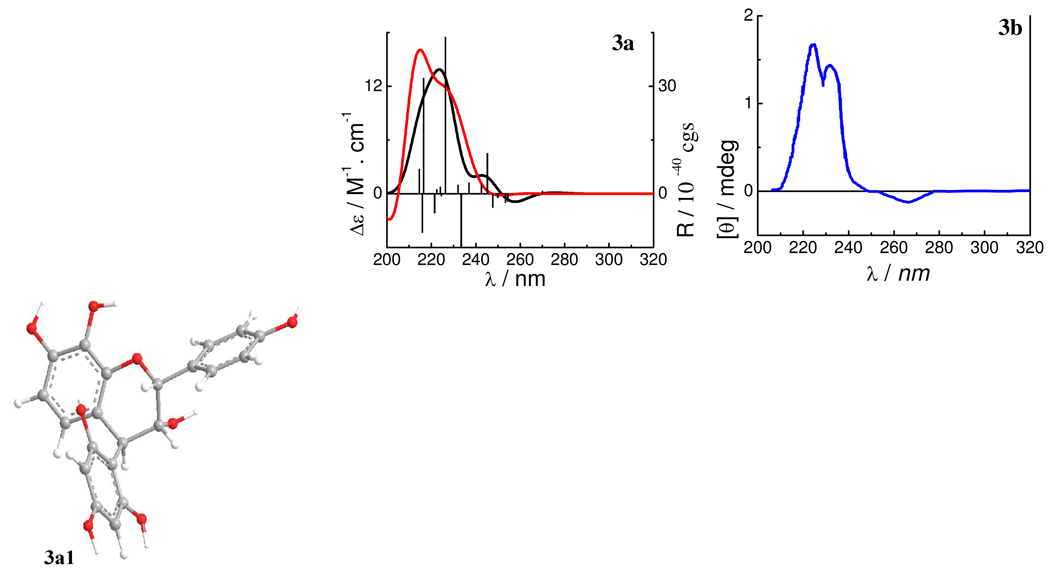
The starting geometry of 3a was based on the optimized geometry of 2a. The B- and D-rings were set equatorially and the 3-hydroxy group axially. Another factor was the consideration of the intramolecular hydrogen bonding between C8OH…O1. Conformational optimizations at the B3LYP/6–31G* level indicated that a conformer (3a1) (Figure 9) with an intramolecular hydrogen bonding between C8OH…O1 was 99.9% populated compared to the conformer without the hydrogen bonding. Conformer 3a1 did not possess hydrogen bonding between C2″OH…OC3 as in 1a1 and 1a2 due to the α-axial position of the 3-hydroxy group and the trans-orientation of the 3-hydroxy and 4-aryl substituent (D-ring). Despite the differences of the C-ring configurations, 3a1 has a C-ring conformation similar to those of 1a, 1b, and 2a, as indicated by the C2-O1-C9-C10 and C3-C4-C10-C9 dihedral angles (Table 2). As in 2a5 and 2a6, the 4-aryl substituent is located in the upper left quadrant, which would lead to a positive CE in the 220–240 nm region of the ECD spectrum according to the empirical aromatic quadrant rule.1c,2
Figure 9.
Optimized geometry of the predominant conformer 3a1 and calculated ECD spectra of compound 3a and the experimental ECD spectrum of 3b. (—: at the B3LYP/6–31G* in the gas phase;  : at the B3LYP-SCRF/6–31G*//B3LYP/6–31G* level with the COSMO model in MeOH;
  : the experimental ECD spectrum in MeOH).
The calculated ECD spectrum of 3a1 and the experimental ECD spectrum of 3b are shown in Figure 9 (assuming 3a and 3b having similar ECD spectra). The two experimentally observed positive CEs in the 220–240 nm region of the ECD spectrum are corroborated by the two strong positive rotatory strengths at 226 and 216 nm in the calculated ECD spectrum at the B3LYP/6–31G* level (gas phase), again supporting the applicability of the aromatic quadrant rule.1c,2
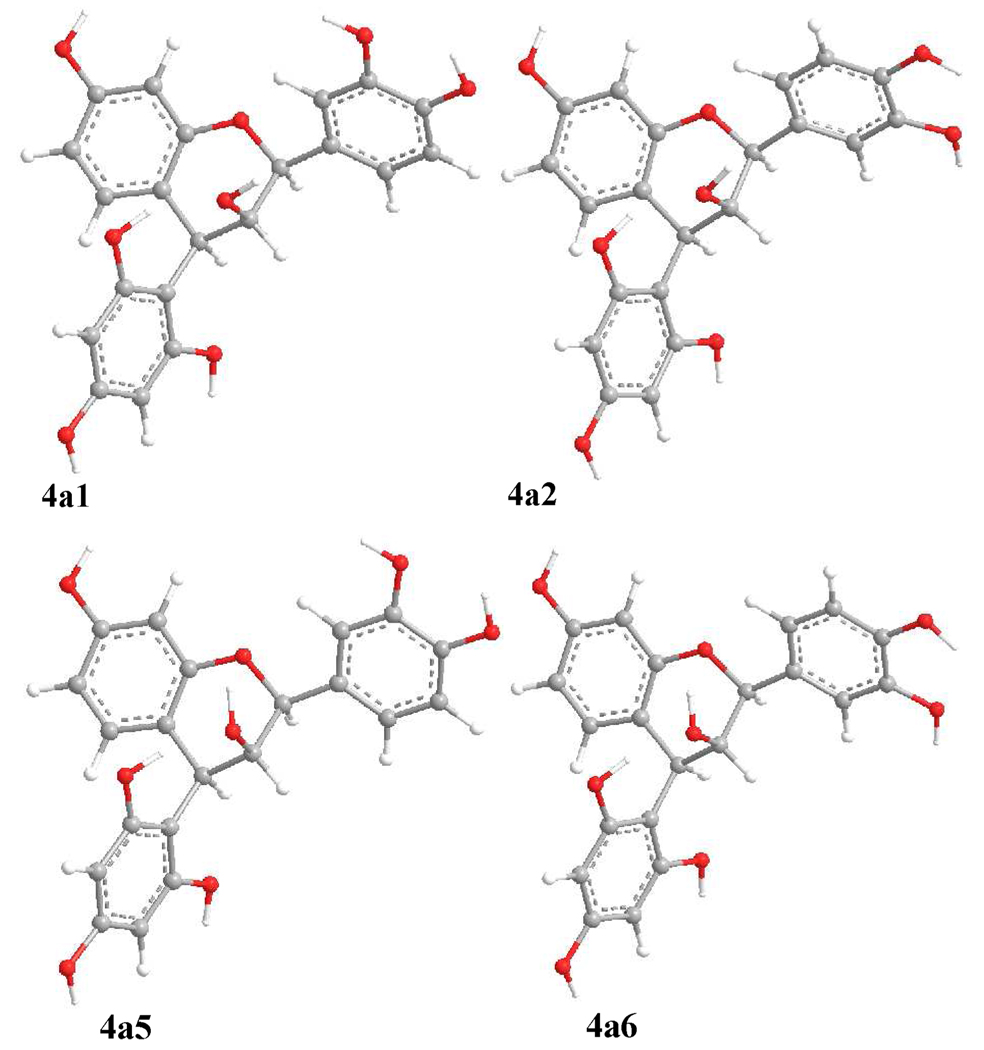
For the last compound (4a) in our study set, the B- and D-rings were similarly equatorially oriented and the C2″OH…OC3 intramolecular hydrogen bonding was considered when setting up the starting conformation to scan the PES by rotating the C-2-C-1′ and C-4-C-1″ bonds at the B3YP/6–31G* level (Figure 10). Six conformers (4a1–4a6) were found and confirmed at the same level. The C2″OH… OC3 hydrogen bonding was found in 4a1, 4a2, 4a5, and 4a6 (Figure 10) and C2″O…HOC3 hydrogen bonding in 4a3 and 4a4 (Figure S3, Supporting Information). However, conformational analysis indicated a distribution of 28, 50, 8, and 14% for the predominant conformers 4a1, 4a2, 4a5, and 4a6, respectively, by Gibbs free energy. These differ as far as the orientation of the 3-hydroxy group is concerned (Figure 11). A distinguishing feature for this seemingly sterically hindered molecule is the change of the C-ring conformation, primarily due to the inversion of the C-2 configuration when compared to the aforementioned compounds. The C2-O1-C9-C10 and C3-C4-C10-C9 dihedral angles range between 13–21° and 21–22°, respectively, in the four conformers (Table 2), indicating that C2 and C3 are located below and above the A/C-plane, respectively. Although the C1″-C4-C10-C9 dihedral angles in 4a1, 4a2, 4a5, and 4a6 increased to about 153° when compared to those of 2a5 (104°), 2a6 (104°), and 3a1 (114°), the 4-aryl substituent (D-ring) is still located in the upper left quadrant. Thus, compound 4a would show a positive CE in the 220–240 nm region of the ECD spectrum. The experimentally observed positive CE at 236 nm in 4b (assuming 4b and 4a showing similar ECD spectra) was indeed consistent with the prediction, implying that the conformational inversion of the C-ring will not change the sign of the positive CE in the 220–240 nm region. Again, the calculated ECD spectra of 4a showing a strong positive CE in the 220–240 nm CD region (Figure 9) provided theoretical support to validate the applicability of the aromatic quadrant rule to define the absolute configuration at C-4 of 4-arylflavan-3-ols.
Figure 10.
Potential energy surface of 4a (A, B) at the B3LYP/6–31G* level and its weighted ECD spectra (C, —: at the B3LYP/6–31G* level in the gas phase;  : at the B3LYP-SCRF/6–31G* //B3LYP/6–31G* level).
Figure 11.
Optimized geometries of predominant conformers of compound 4a at the B3LYP/6–31G* level in the gas phase.
In summary, DFT/B3LYP has been employed to locate the conformational minima of representative 4-arylflavan-3-ols and their corresponding phenolic permethyl ether 3-O-acetates. TDDFT has been performed to calculate their ECD spectra to validate the empirical aromatic quadrant rule. The diagnostic CE in the 220–240 nm region of the ECD spectra of this class of compounds originates from the chiral perturbation of the spatially close aromatic A-ring and C-4 aryl moieties. The sign of this CE is determined by the orientation of the 4-aryl substituent: negative and positive CEs are associated with 4α- and 4β-oriented aryl substituents, respectively. These theoretically calculated conformational and ECD characteristics of 4-arylflavan-3-ols may be extended to also address the issue of the absolute configuration of the naturally occurring proanthocyanidins.
Experimental Section
Methods of Computational Calculations
The calculations were performed by the SYBYL 8.1 program (Tripos International, St. Louis, MO) and the Gaussian03 program package.6 MMFF94 molecular mechanics force-field and potential energy surface (PES) were employed to search the possible conformations. All ground-state geometries were optimized at the B3LYP/6–31G* level at 298 K, and harmonic frequency analysis was computed to confirm the minima. TDDFT5 at the same level was employed to calculate excitation energy (in nm) and rotatory strength R (velocity form Rvel and length form Rlen in 10−40 erg-esu-cm/Gauss) between different states. The ECD spectra were then simulated by overlapping Gaussian functions for each transition according to
where σ is the width of the band at 1/e height and ΔEi and Ri are the excitation energies and rotatory strengths for transition i, respectively. Both the Rvel and Rlen forms can be used for the simulation of the ECD spectrum, while the latter may provide better results.4a In this work, σ = 0.10 eV and Rvel were used.
Supplementary Material
Acknowledgment
We thank the Mississippi Center for Supercomputing Research (MCSR) for computational facilities. This work was supported in part by the USDA Agricultural Research Service Specific Cooperative Agreement No. 58-6408-2-0009 and NIH AI027094.
Footnotes
Dedicated to the late Dr. John W. Daly of MDDK, NIH and to the late Dr. Richard E. Moore of the University of Hawaii at Manoa for their pioneering work on bioactive natural products.
Supporting Information Available: Detailed computational calculating data of compounds 1a–4a and 1b. This information is available free from the Internet at http://pubs.acs.org.
References and Notes
- 1.(a) Botha JJ, Ferreira D, Roux DG. J. Chem. Soc., Chem. Commun. 1978:698–700. [Google Scholar]; (b) Botha JJ, Young DA, Ferreira D, Roux DG. J. Chem. Soc., Perkin Trans. I. 1981:1213–1219. [Google Scholar]; (c) Van der Westhuizen JH, Ferreira D, Roux DG. J. Chem. Soc., Perkin Trans. I. 1981:1220–1226. [Google Scholar]; (d) Steynberg JP, Burger JFW, Young DA, Brandt EV, Ferreira D. Heterocycles. 1989;28:923–935. [Google Scholar]; (e) Van Zyl PW, Steynberg JP, Brandt EV, Ferreira D. Magn. Reson. Chem. 1993;31:1057–1063. [Google Scholar]
- 2.DeAngelis GG, Wildman WC. Tetrahedron. 1969;25:5099–5112. [Google Scholar]
- 3.(a) Harada N, Nakanishi K. Circular Dichroic Spectroscopy - Exciton Coupling in Organic Stereochemistry. Oxford University Press; Oxford, UK: 1983. [Google Scholar]; (b) Gaffield W, Foo LY, Porter LJ. J. Chem. Res. (S) 1989:144–145. [Google Scholar]
- 4.(a) Diedrich C, Grimme S. J. Phys. Chem. A. 107. 2003:2524–2539. [Google Scholar]; (b) Crawford TD, Tam MC, Abrams ML. J. Phys. Chem. A. 2007;111:12058–12068. doi: 10.1021/jp075046u. [DOI] [PubMed] [Google Scholar]; (c) Stephens PJ, Pan J-J, Devlin FJ. J. Org. Chem. 2007;72:2508–2524. doi: 10.1021/jo062567p. [DOI] [PubMed] [Google Scholar]; (d) Stephens PJ, Devlin FJ, Gasparrini F, Ciogli A, Spinelli D, Cosimelli B. J. Org. Chem. 2007;72:4707–4715. doi: 10.1021/jo070302k. [DOI] [PubMed] [Google Scholar]; (e) Ding Y, Li X-C, Ferreira D. J. Org. Chem. 2007;72:9010–9017. doi: 10.1021/jo071134z. [DOI] [PubMed] [Google Scholar]; (f) Berova N, Bari LD, Pescitelli G. Chem. Soc. Rev. 2007;36:914–931. doi: 10.1039/b515476f. [DOI] [PubMed] [Google Scholar]; (g) Ding Y, Li X-C, Ferreira D. J. Nat. Prod. 2009;72:327–335. doi: 10.1021/np800146v. [DOI] [PMC free article] [PubMed] [Google Scholar]
- 5.(a) Klamt A, Schürmann G. J. Chem. Soc. Perkin Trans. II. 1993;2:799–805. [Google Scholar]; (b) Klamt A. J. Phys. Chem. 1995;99:2224–2235. [Google Scholar]; (c) Eckert F, Klamt A. AIChE J. 2002;48:369–385. [Google Scholar]
- 6.Frisch MJ, Trucks GW, Schlegel HB, Scuseria GE, Robb MA, Cheeseman JR, Montgomery JA, Jr, Vreven T, Kudin KN, Burant JC, Millam JM, Iyengar SS, Tomasi J, Barone V, Mennucci B, Cossi M, Scalmani G, Rega N, Petersson GA, Nakatsuji H, Hada M, Ehara M, Toyota K, Fukuda R, Hasegawa J, Ishida M, Nakajima T, Honda Y, Kitao O, Nakai H, Klene M, Li X, Knox JE, Hratchian HP, Cross JB, Adamo C, Jaramillo J, Gomperts R, Stratmann RE, Yazyev O, Austin AJ, Cammi R, Pomelli C, Ochterski JW, Ayala PY, Morokuma K, Voth GA, Salvador P, Dannenberg JJ, Zakrzewski VG, Dapprich S, Daniels AD, Strain MC, Farkas O, Malick DK, Rabuck AD, Raghavachari K, Foresman JB, Ortiz JV, Cui Q, Baboul AG, Clifford S, Cioslowski J, Stefanov BB, Liu G, Liashenko A, Piskorz P, Komaromi I, Martin RL, Fox DJ, Keith T, Al-Laham MA, Peng CY, Nanayakkara A, Challacombe M, Gill PMW, Johnson B, Chen W, Wong MW, Gonzalez C, Pople JA. Gaussian 03, Revision B. 02. Pittsburgh PA: Gaussian, Inc.; 2003. [Google Scholar]
Associated Data
This section collects any data citations, data availability statements, or supplementary materials included in this article.


