Abstract
Fluorescent carbon dots (small carbon nanoparticles with the surface passivated by oligomeric PEG molecules) were evaluated for their cytotoxicity and in vivo toxicity and also for their optical imaging performance in reference to that of the commercially supplied CdSe/ZnS quantum dots. The results suggested that the carbon dots were biocompatible, and their performance as fluorescence imaging agents was competitive. The implication to the use of carbon dots for in vitro and in vivo applications is discussed.
Introduction
Fluorescent nanoparticles, primarily semiconductor quantum dots (QDs), have attracted much recent attention for a variety of purposes and applications, especially for their potential uses as optical imaging agents.1–3 Among extensively investigated and currently well-established QDs are those based on cadmium selenide (CdSe) in various particle sizes, and their core-shell configurations (CdSe/ZnS in particular) for improved performance. These QDs are widely considered as being more advantageous over conventional organic dyes as well as genetically engineered fluorescent proteins in terms of the optical brightness and thus imaging sensitivity, photostability, resistance to metabolic degradation, etc.4 For example, CdSe/ZnS QDs have been demonstrated for superior performance in a number of in vitro and in vivo optical imaging experiments.1–7 As widely acknowledged, however, a major issue for the QDs containing cadmium or other heavy metals is toxicity. There are existing data suggesting that these QDs are toxic to vertebrate systems at relatively low concentrations,8–11 with risks for their accumulation in organs and tissues.11–15 It was also reported recently that the QDs could induce acute toxicity and prothrombotic effect in mice.10,11
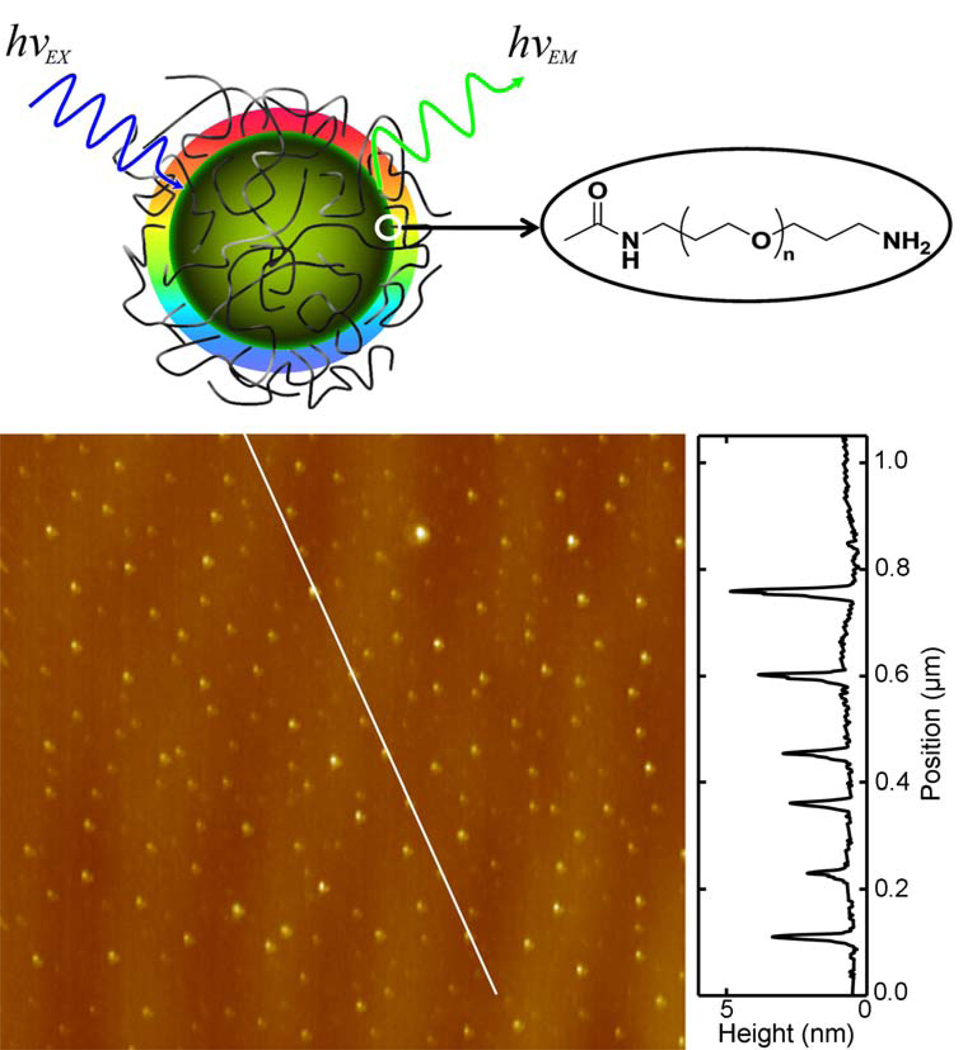
The search for benign (nontoxic) alternative QD-like fluorescent nanomaterials has continued. Of particular interest and significance was the recent finding that small carbon nanoparticles could be surface-passivated by organic or bio-molecules to become strongly fluorescent in the visible and near-infrared spectral regions.16 These surface-functionalized carbon nanoparticles (dubbed “carbon dots”, Figure 1) were found to be physicochemically and photochemically stable and non-blinking, thus different from the semiconductor QDs.16–21 Carbon dots (C-Dots) also exhibited very high two-photon absorption cross-sections, enabling fluorescence imaging with both one- and two-photon excitations on the same platform.22 There is growing evidence suggesting that C-Dots represent an emerging new class of QD-like fluorescent nanomaterials for applications in optical bioimaging23 and beyond.
Figure 1.
Top: A cartoon illustration of C-Dots. Bottom: A representative AFM topography image of C-Dots on mica (with a height profile plot along the line).
Carbon has generally not been considered as a toxic element, hardly in the same category as cadmium and other heavy metals discussed above. However, for the specific material configurations and structures found in C-Dots, there are legitimate concerns on their biocompatibility in vitro and in vivo, especially in light of the recent results and controversies on the toxicity issues of fullerenes and carbon nanotubes.24,25
Here we report results from in vitro and in vivo evaluations confirming that C-Dots are indeed nontoxic, and also results from optical imaging in terms of fluorescence microscopy suggesting that C-Dots are competitive in performance to the well-developed (commercially available) CdSe/ZnS QDs.
Results and Discussion
The C-Dots (small carbon nanoparticles surface-passivated by PEG1500N, Figure 1) were prepared in slightly modified procedures reported previously.16,22 For the same C-Dots with the carbon core significantly enriched with 13C (denoted as 13C-Dots), a carbon target from a mixture of 13C powder and graphite cement was laser-ablated to yield the 13C-enriched carbon nanoparticles,16 for which the same surface passivation chemistry with PEG1500N was used to produce the 13C-Dots. TEM and AFM (Figure 1) results suggested that the C-Dots and 13C-Dots were around 4–5 nm in average diameters, similar to those reported previously.16,22
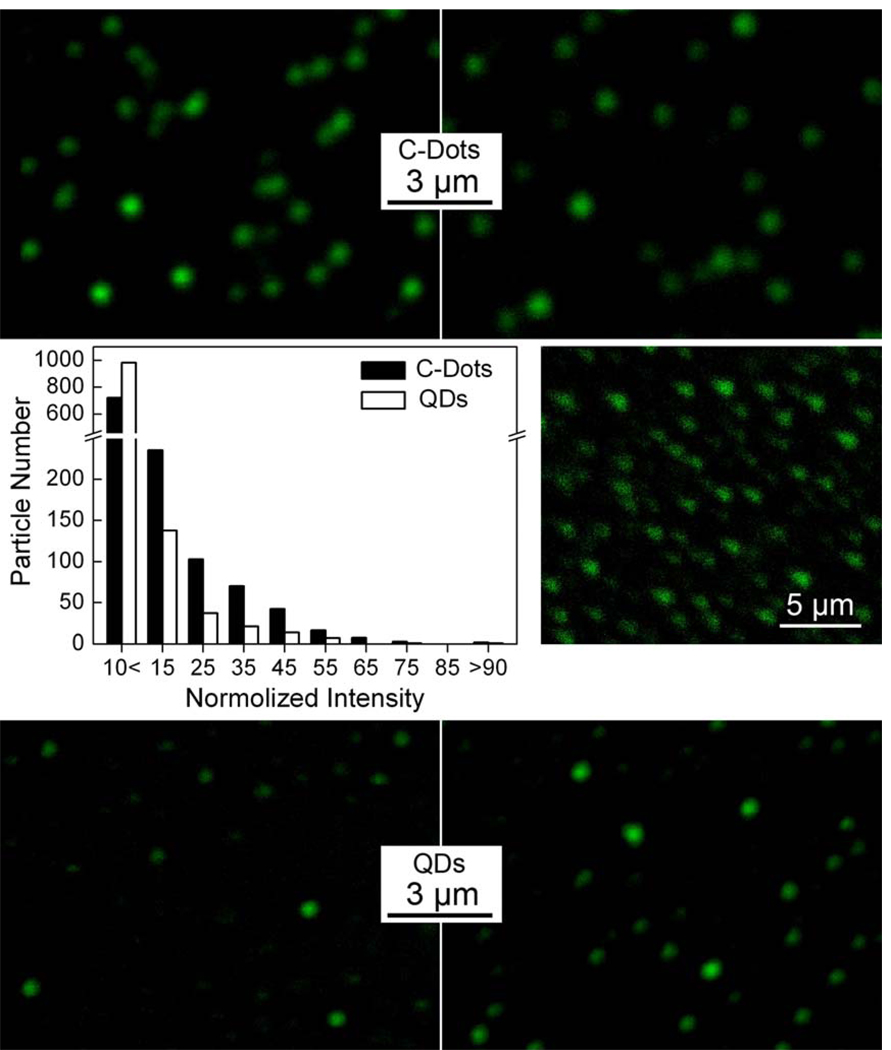
These PEGylated (with PEG1500N) C-Dots were found to be strongly fluorescent both in aqueous solution (quantum yield about 20% at 440 nm excitation) and on a substrate under single dot-like conditions (via infinite dilution in the preparation of specimens for optical imaging since C-Dots were known to be non-blinking16). As shown in Figure 2, the green fluorescence images of individual C-Dots were generally bright, comparable to those of the commercially supplied CdSe/ZnS QDs (aqueous compatible Qdot® 525 ITK™ amino (PEG) QDs from Invitrogen) under the same excitation, detection, and other instrumental conditions. In a more statistically meaningful calibration for the fluorescence brightness of C-Dots against that of the CdSe/ZnS QDs, all dots (fluorescent spots) in multiple images of each sample were sorted in terms of their relative intensities, amounted to about 1,200 dots for each sample (Figure 2). The brightness distributions of the two samples thus obtained, while not different in any substantial fashion, suggested that the C-Dots sample was less homogenous in terms of fluorescence brightness at the individual dot level. However, it should be cautioned that the observed brightness variation might also be subject to effects from some measurement issues, such as some dots being slightly out of the focal plane in a specific imaging experiment on a specimen containing many dots.
Figure 2.
Fluorescence images (argon ion laser excitation at 458 nm) of C-Dots (top) and the commercially supplied CdSe/ZnS QDs (bottom) in specimens from infinite dilution, with analyses (by ImageJ software) of large numbers of dots (in multiple images) for their relative fluorescence intensities (middle left). The corresponding two-photon (femtosecond pulsed laser excitation at 880 nm) fluorescence image of the C-Dots specimen is also shown for comparison (middle right).
The C-Dots were similarly fluorescent with two-photon excitation (femtosecond pulsed laser excitation at 800–880 nm),22 thus two-photon fluorescence images of the same specimen used in the confocal imaging above were collected (Figure 2). The one- and two-photon fluorescence imaging results of C-Dots were generally comparable, as reported previously.22 For the commercially supplied CdSe/ZnS QDs (aqueous compatible Qdot® 525 ITK™ amino (PEG) QDs from Invitrogen), however, the same two-photon excitation conditions and also some variations around those conditions failed to yield similarly bright fluorescence images. Since it was reported that CdSe/ZnS QDs could be strongly two-photon fluorescent,7 a simple explanation might be that these commercially supplied QDs were not optimized for such a purpose.
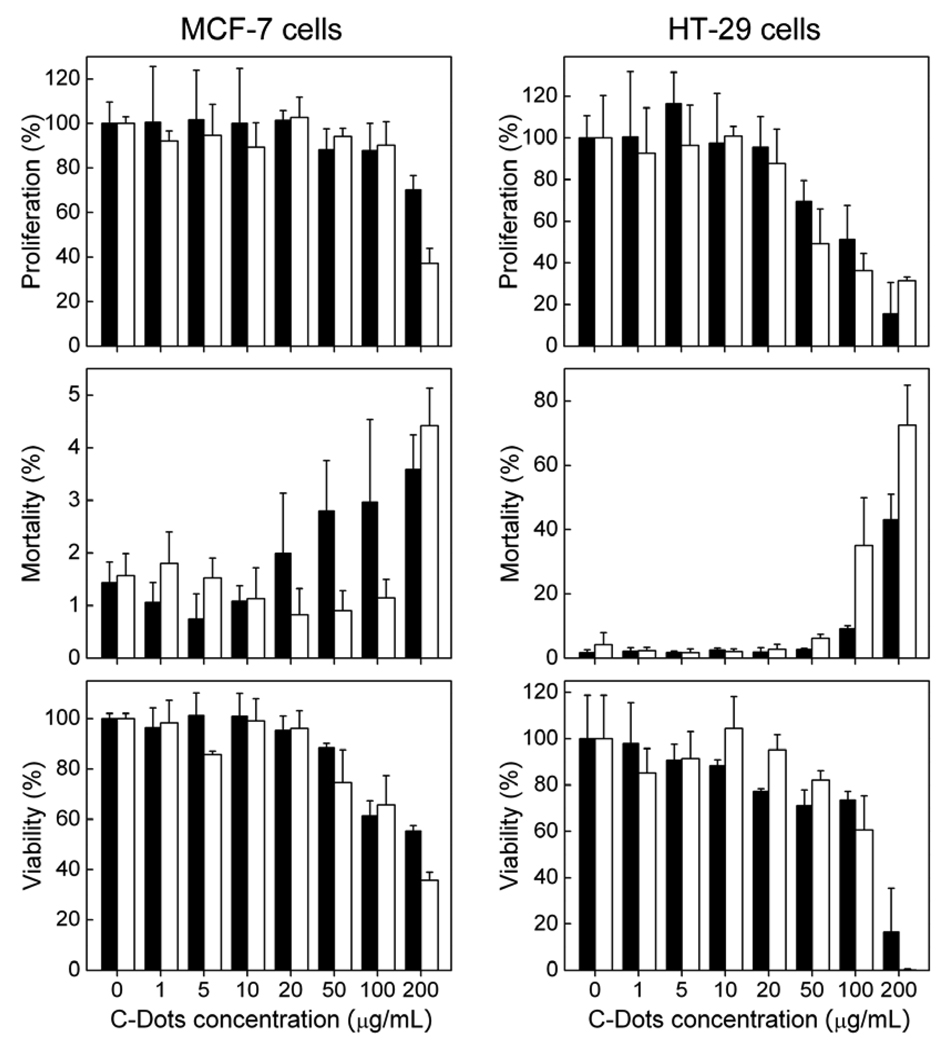
The toxicity evaluations of C-Dots in vitro were based on their effects on the proliferation, mortality, and viability of human breast cancer MCF-7 and human colorectal adenocarcinoma HT-29 cells. For both cell lines, all these parameters were little affected by C-Dots, no more than those by the surface passivation agent PEG1500N (Figure 3). The carbon core in C-Dots is similar to free carbon nanoparticles, which in various nanoscale configurations have not been found to pose any significant toxic effects.19,26,27 PEG1500N at a high concentration could be toxic to cells since PEG molecules have been used as fusogen in cell membrane diffusion. Nevertheless, the concentrations of C-Dots used in the in vitro evaluations were significantly higher than those required for potential applications such as optical imaging of living cells, so were the much longer exposure times. Thus, C-Dots should be considered as nontoxic for typical cellular experiments, especially in comparison with PEGylated CdSe/ZnS or CdSe/CdS QDs, for which cytotoxicity has been cited as a significant concern in the literature. For example, a cell viability lose of more than 25% was observed for human epidermal keratinocytes after exposure to the PEGylated CdSe/CdS QDs at 10 nM for 24 h,28 or a 50% loss for procine renal proximal cells after similar exposure to PEGylated CdSe/ZnS QDs.29.
Figure 3.
Results from cytotoxicity evaluations of C-Dots (black) and PEG1500N (white). Data presented as mean ± SD (n=4).
CD-1 mice were used for the toxicity evaluation of C-Dots in vivo. The mice in two groups were exposed to two different dosages of C-Dots, 8 mg and 40 mg carbon core-equivalent/kg body weight, and the third group exposed to 0.9% NaCl aqueous solution was taken as the nontoxic control. All of the mice exposed to C-Dots or NaCl solution survived during the four-weeks of experiment. The food intake was regular, and no mice exhibited any symptom of anorexia, or other clinical symptoms such as hair loss, scab, vomiting, or diarrhea. The activities of the exposed mice were normal, without any violent or lethargic behaviour. The body weight increases as a general indicator were also similar among the three groups.
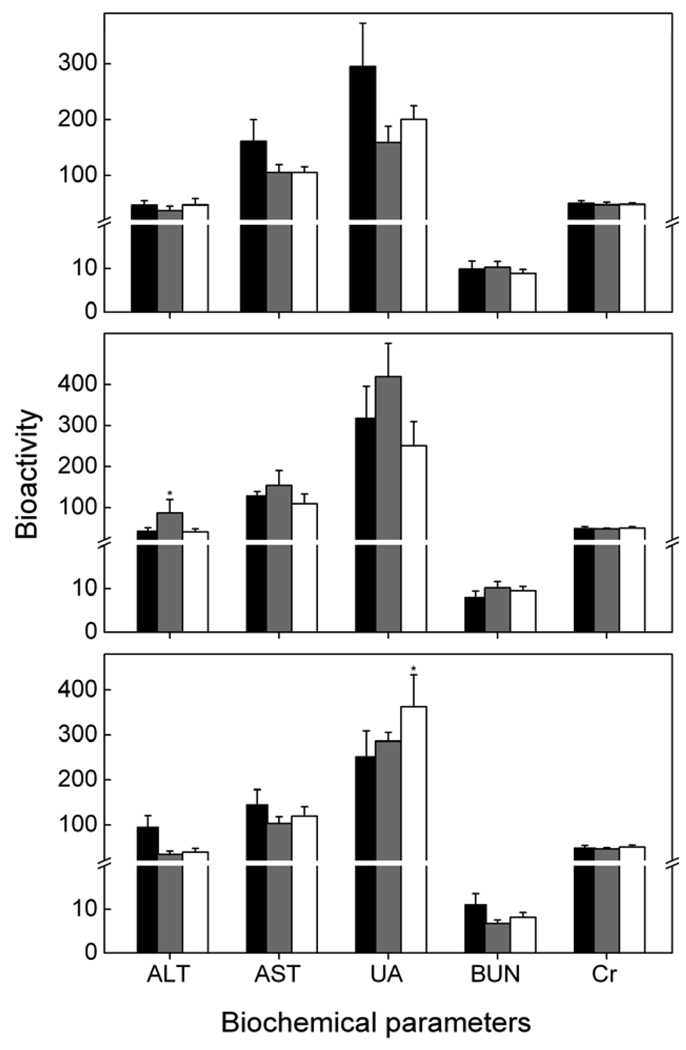
Established serum biochemistry assays were used to evaluate more quantitatively the influence of C-Dots on the exposed mice, including especially those for potential heptic injury and kidney functions. As shown in Figure 4, the two important hepatic indicators, alanine amino transferase (ALT) and aspartate amino transferase (AST), were at similar levels for the mice exposed to different dosages of C-Dots and the control. The three indicators for kidney functions, uric acid (UA), blood urea nitrogen (BUN), and creatinine (Cr), were also unchanged among the three groups of mice (Figure 4). These results suggest no toxicity of C-Dots in mice at exposure levels beyond those commonly used in optical imaging in vivo and for relatively long exposure times (up to 28 days). In any case, the in vivo toxicity of C-Dots, if any, is considerably lower than that of CdSe-based QDs, for which detectable toxic effects were reported to be at exposure down to the picomole level.10 The C-Dots are particularly amenable to in vivo uses because PEG molecules (such as PEG1500N used in the surface passivation) are biocompatible and nontoxic in vivo, in contrast to their cytotoxicity at high concentrations.
Figure 4.
Serum biochemistry results for mice intravenously exposed to C-Dots at carbon core-equivalent of 8 mg/kg (grey) and 40 mg/kg (white) and the control mice (black) at 1 day (top), 7 days (middle), and 28 days (bottom) post-exposure. Data presented as mean ± SD (n=5).
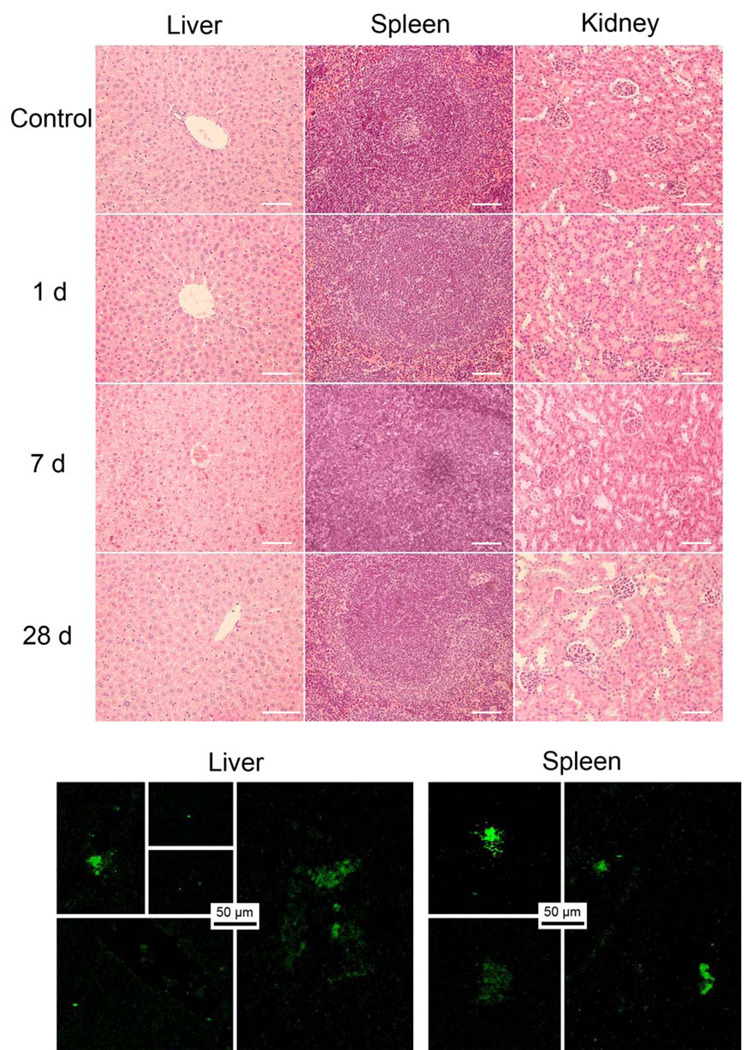
The organs of the mice post-exposure to C-Dots at the higher dosage (40 mg carbon core-equivalent/kg body weight) were harvested for histopathological analyses. As shown in Figure 5, the structures of organs from the exposed mice were normal, hardly different from those of the control group. There were no steatosis, necrosis, and/or hydropic degeneration in the exposed hepatic sections. Typical splenic unit and lymphocyte were observed clearly in the spleen sections (Figure 5). Similarly in the sections of kidneys, the glomerulus structure could be distinguished easily. No protein liquid and/or necrosis were found in all groups.
Figure 5.
Top: Results from histopathological analyses of liver, spleen, and kidneys. Bottom: Fluorescence images (two-photon excitation at 800 nm) of sliced liver and spleen harvested from mice 6 h after intravenous exposure to C-Dots.
As found for other carbon nanomaterials, the amounts of C-Dots in liver and spleen were relatively much higher than those in other organs, but still low in absolute population. For example, in specimens of dissected liver and spleen harvested 6 h post-exposure of C-Dots (about 20 mg carbon core-equivalent/kg body weight injected), a few scattered bright fluorescence spots were detected (Figure 5), attributable to trapped C-Dots. Separately according to isotope-ratio mass spectroscopy (isotope-MS) analyses30,31 of the liver and spleen samples from mice exposed to 13C-Dots, the carbon core-equivalent contents were on the order of 20 µg and 2 µg in liver and spleen, respectively. The fluorescence imgaing and isotope-MS results both suggest relatively minor accumulations of C-Dots in vivo, consistent with the absence of any meaningful damages to the organs, though more systematic investigations on in vivo bioditributions of various carbon dots are still needed and being pursued. Nevertheless, the imaging results here also serve to demonstrate the kind of sensitivity that might be expected from C-Dots in potential fluorescence bioimgaing in vivo.
It seems evident that in terms of biocompatibility the advantage of C-Dots over the CdSe-based QDs is overwhelming. In addition, the biocompatibility of C-Dots is also competitive to some currently FDA-approved dyes as optical imaging agents. For the fluorescent dye indocyanine green, as an example, the LD50 (median lethal dose) to intravenously exposed mice is 60 mg/kg body weight.32 While a rigorous determination of LD50 for C-Dots has yet to be accomplished, similar performance at least in the same order of magnitude may be expected.
The optical performance of C-Dots is generally comparable to that of the aqueous compatible CdSe/ZnS QDs, where the higher absorptivity of C-Dots compensates for the lower average fluorescence quantum yield. However, the C-Dots sample is less homogeneous in terms of performances by individual dots, presenting opportunities to potentially isolate the brighter dots for much improved optical properties. Another significant advantage of C-Dots over the QDs is the smaller size, less than 10 nm vs more than 20 nm in diameter, respectively, making C-Dots more suitable for tracing small proteins or probing fine biological structures.33,34 The smaller size also allows minimal injection volume in potential in vivo applications.
In summary, the oligomeric PEG-functionalized carbon dots were evaluated in vitro and in vivo, from which the results suggested that these fluorescent dots are nontoxic to the selected cell lines (no more than that of the oligomeric PEG molecules), nor do they impose any significant toxic effects on the mice at dosages beyond those commonly used for in vivo optical imaging. In addition to their apparent biocompatibility, the carbon dots exhibited competitive (on the order of magnitude at least) fluorescence imaging performance to that of the commercially supplied CdSe/ZnS QDs, demonstrating their potentials for both in vitro and in vivo applications.
Experimental Section
C-Dots and 13C-Dots
The preparation of precursor carbon nanoparticles and the synthesis of carbon dots were based on the previously reported procedures,16 with slight modifications and more rigorous controls of the experimental conditions for improved fluorescence properties. Briefly, the carbon soot was refluxed in aqueous nitric acid solution (2.6 M) for 12 h, dialyzed against fresh water, and then centrifuged at 1,000g to retain the supernatant. The recovered sample was refluxed in neat SOCl2 for 6 h. Upon the removal of excess SOCl2, the sample (100 mg) was mixed well with carefully dried PEG1500N (1 g) in a flask, heated to 110°C, and vigorously stirred under nitrogen protection for 3 days. The reaction mixture at room temperature was dispersed in water, centrifuged at 25,000g to retain the supernatant, followed by filtration through a Sephadex™ G-100 (GE Healthcare) column (4.8 cm × 15 cm) to keep the colored fraction. The 13C-Dots were similarly prepared by starting with the 13C-enriched carbon soot (from laser ablation of a highly 13C-enriched graphite target16,31).
Fluorescence Imaging
Leica laser scanning confocal fluorescence microscope (DM IRE2, with Leica TCS SP2 SE scanning system) equipped with an argon ion laser (JDS Uniphase) and a femtosecond pulsed Ti:sapphire laser (Spectra-Physics Tsunami with a 5 W Millennia pump) was used for all measurements. The C-Dots and commercially supplied CdSe/ZnS QDs (Invitrogen Qdot® 525 ITK™ amino (PEG) QDs) were both diluted to 5 nM in deionized water. Each solution in 5 µL aliquot was dropped onto a glass slide, followed by drying in air. The specimens (dots dispersed on slides) were imaged under the same instrumental conditions (one-photon: 458 nm excitation and 470–820 nm emission collection; and two-photon: 800–880 nm excitation and 455–790 nm emission collection). The images were processed and analyzed with the NIH ImageJ software.
For the imaging of dissected liver and spleen, the harvested organs were fixed in 4% formaldehyde solution, embedded in paraffin, and then thin-sectioned. The slices were mounted on glass microscope slides by using the standard histopathological techniques without staining.
Assays in vitro
MCF-7 and HT-29 cells were cultured in established procedures. In the 96-well plates, MCF-7 cells were plated at 2 × 10⁴ cells per well, and HT-29 cells at 1 × 10⁴ cells per well. After incubation for 24 h, C-Dots with a carbon core-equivalent concentration of 1, 5, 10, 20, 50, 100, or 200 µg/mL (diluted to the final exposure concentrations with the culture medium just prior to the cell exposure) and PEG1500N were introduced to cells. Cells cultured in the free medium were taken as the control. Another 24 h later, the cytotoxicity was examined according to well-established protocols. The cell mortality (positive cell number/total cell number in percentage) was evaluated by counting the trypan blue positive cells, so was the cell proliferation (total cell number of the exposed group/total cell number of the control group in percentage). The cell viability was evaluated by the MTT assay (measuring the ability of mitochondrial reduction of the tetrazolium salt MTT to formazan by succinic dehydrogenase).
Evaluations in vivo
Male CD-1 mice (~25 g) were acquired and used at Peking University in compliance with the institutional Animal Care and Use Program Guidelines. The mice were cared by following established protocols. After acclimation, the mice were randomly divided into groups of five each for the in vivo toxicity evaluations. Each mouse was exposed intravenously to C-Dots in a single injection of 200 µg carbon core-equivalent in 200 µL or three injections (in 4 h intervals between injections) of 333 µg in 333 µL each. Mice exposed to 0.9% NaCl aqueous solution were taken as the control group.
At 1, 7, and 28 days post exposure, mice were sacrificed, and blood and organ samples were collected for toxicological assays. Serum samples were obtained from blood by centrifugation (3,000 rpm × 10 min). Organ samples were cut off and fixed in 4% formaldehyde solution. All biochemical assays were performed on a Hitachi 7170A clinical automatic chemistry analyzer. ALT (U/L), AST (U/L), UA (µmol/L), BUN (mmol/L), and Cr (µmol/L) were measured by using commercial kits (Bühlmann Laboratories, Switzerland). For histopathological observation, the thin-sectioned tissue specimens were stained with hematoxylin and eosin (H&E) and examined under light microscopy.
Organs harvested from the mice exposed to 13C-Dots were homogenized and lyophilized for quantification in terms of the 13C isotopic abundance by using isotope-ratio mass spectroscopy (Thermo Finnigan DELTAplusXP), for which detailed protocols for measurements and data processing are already available in the literature.30,31
Acknowledgement
The work at Clemson U. was supported by NIH (Y.-P.S.) and in part by a Susan G. Komen for the Cure Postdoctoral Fellowship Award (L.C. and Y.-P.S.) and ACS Petroleum Research Fund (Y.-P.S.); and the work in China was made possible by grants from the China NSF (No. 20871010) and China Ministry of Science and Technology (973 project No. 2006CB705604). We also thank Dr. Y. Gu for histological analyses and Dr. T. Wang for serum biochemistry assays.
References
- 1.Michalet X, Pinaud FF, Bentolila LA, Tsay JM, Doose S, Li JJ, Sundaresan G, Wu AM, Gambhir SS, Weiss S. Science. 2005;307:538–544. doi: 10.1126/science.1104274. [DOI] [PMC free article] [PubMed] [Google Scholar]
- 2.Medintz IL, Uyeda HT, Goldman ER, Mattoussi H. Nat. Mater. 2005;4:435–446. doi: 10.1038/nmat1390. [DOI] [PubMed] [Google Scholar]
- 3.De M, Ghosh PS, Rotello VM. Adv. Mater. 2008;20:4225–4241. [Google Scholar]
- 4.a) Chan WCW, Nie S. Science. 1998;281:2016–2018. doi: 10.1126/science.281.5385.2016. [DOI] [PubMed] [Google Scholar]; b) Bruchez M, Moronne M, Gin P, Weiss S, Alivisatos AP. Science. 1998;281:2013–2016. doi: 10.1126/science.281.5385.2013. [DOI] [PubMed] [Google Scholar]
- 5.Gao X, Cui Y, Levenson RM, Chung LWK, Nie S. Nat. Biotechnol. 2004;22:969–976. doi: 10.1038/nbt994. [DOI] [PubMed] [Google Scholar]
- 6.Alivisatos AP, Gu W, Larabell C. Annu. Rev. Biomed. Eng. 2005;7:55–76. doi: 10.1146/annurev.bioeng.7.060804.100432. [DOI] [PubMed] [Google Scholar]
- 7.Larson DR, Zipfel WR, Williams RM, Clark SW, Bruchez MP, Wise FW, Webb WW. Science. 2003;300:1434–1436. doi: 10.1126/science.1083780. [DOI] [PubMed] [Google Scholar]
- 8.Derfus AM, Chan WCW, Bhatia SN. Nano Lett. 2004;4:11–18. doi: 10.1021/nl0347334. [DOI] [PMC free article] [PubMed] [Google Scholar]
- 9.Kirchner C, Liedl T, Kudera S, Pellegrino T, Javier AM, Gaub HE, Stolzle S, Fertig N, Parak WJ. Nano Lett. 2005;5:331–338. doi: 10.1021/nl047996m. [DOI] [PubMed] [Google Scholar]
- 10.Geys J, Nemmar A, Verbekn E, Smolders E, Rotoi M, Hoylaerts MF, Nemery B, Hoet PHM. Environ. Health. Perspect. 2008;116:1607–1613. doi: 10.1289/ehp.11566. [DOI] [PMC free article] [PubMed] [Google Scholar]
- 11.Lin P, Chen JW, Chang LW, Wu JP, Redding L, Chang H, Yeh TK, Yang CS, Tsai MH, Wang HJ, Kuo YC, Yang RSH. Environ. Sci. Technol. 2008;42:6264–6270. doi: 10.1021/es800254a. [DOI] [PubMed] [Google Scholar]
- 12.Fischer HC, Liu L, Pang KS, Chan WCW. Adv. Funct. Mater. 2006;16:1299–1305. [Google Scholar]
- 13.Choi HS, Liu W, Misra P, Tanaka E, Zimmer JP, Ipe BI, Bawendi MG, Frangioni JV. Nat. Biotechnol. 2007;25:1165–1170. doi: 10.1038/nbt1340. [DOI] [PMC free article] [PubMed] [Google Scholar]
- 14.Kennel SJ, Woodward JD, Rondinone AJ, Wall J, Huang Y, Mirzadeh S. Nucl. Med. Biol. 2008;35:501–514. doi: 10.1016/j.nucmedbio.2008.02.001. [DOI] [PubMed] [Google Scholar]
- 15.Schipper ML, Iyer G, Koh AL, Cheng Z, Ebenstein Y, Aharoni A, Keren S, Bentolila LA, Li J, Rao J, Chen X, Banin U, Wu AM, Sinclair R, Weiss S, Gambhir SS. Small. 2009;5:126–134. doi: 10.1002/smll.200800003. [DOI] [PMC free article] [PubMed] [Google Scholar]
- 16.Sun Y-P, et al. J. Am. Chem. Soc. 2006;128:7756–7757. doi: 10.1021/ja062677d. [DOI] [PubMed] [Google Scholar]
- 17.Zhou J, Booker C, Li R, Zhou X, Sham T-K, Sun X, Ding Z. J. Am. Chem. Soc. 2007;129:744–745. doi: 10.1021/ja0669070. [DOI] [PubMed] [Google Scholar]
- 18.Bourlinos AB, Stassinopoulos A, Anglos D, Zboril R, Karakassides M, Giannelis EP. Small. 2008;4:455–458. doi: 10.1002/smll.200700578. [DOI] [PubMed] [Google Scholar]
- 19.Zhao QL, Zhang ZL, Huang BH, Peng J, Zhang M, Pang DW. Chem. Commun. 2008:5116–5118. doi: 10.1039/b812420e. [DOI] [PubMed] [Google Scholar]
- 20.Mochalin VN, Gogotsi Y. J. Am. Chem. Soc. 2009;131:4594–4595. doi: 10.1021/ja9004514. [DOI] [PubMed] [Google Scholar]
- 21.Liu R, Wu D, Liu S, Koynov K, Knoll W, Li Q. Angew. Chem. Int. Ed. 2009;48:4598–4601. doi: 10.1002/anie.200900652. [DOI] [PubMed] [Google Scholar]
- 22.Cao L, Wang X, Meziani MJ, Lu F, Wang H, Luo PG, Lin Y, Harruff BA, Veca LM, Murray D, Xie S-Y, Sun Y-P. J. Am. Chem. Soc. 2007;129:11318–11319. doi: 10.1021/ja073527l. [DOI] [PMC free article] [PubMed] [Google Scholar]
- 23.Yang S-T, Cao L, Luo PG, Lu F, Wang X, Wang HF, Meziani MJ, Liu Y, Qi G, Sun Y-P. J. Am. Chem. Soc. 2009;131:11308–11309. doi: 10.1021/ja904843x. [DOI] [PMC free article] [PubMed] [Google Scholar]
- 24.(a) Oberdörster G, Stone V, Donaldson K. Nanotoxicology. 2007;1:2–25. [Google Scholar]; (b) Lewinski N, Colvin V, Drezek R. Small. 2008;4:26–49. doi: 10.1002/smll.200700595. [DOI] [PubMed] [Google Scholar]
- 25.Lu F, Gu L, Meziani MJ, Wang X, Luo PG, Veca LM, Cao L, Sun Y-P. Adv. Mater. 2009;21:139–152. [Google Scholar]
- 26.Schrand AM, Huang H, Carlson C, Schlager JJ, Osawa E, Hussain SM, Dai L. J. Phys. Chem. B. 2007;111:2–7. doi: 10.1021/jp066387v. [DOI] [PubMed] [Google Scholar]
- 27.Chao JI, Perevedentseva E, Chung PH, Liu KK, Cheng CY, Chang CC, Cheng CL. Biophys. J. 2007;93:2199–2208. doi: 10.1529/biophysj.107.108134. [DOI] [PMC free article] [PubMed] [Google Scholar]
- 28.Zhang LW, Yu WW, Colvin VL, Monteiro-Riviere NA. Toxicol. Appl. Pharmacol. 2008;228:200–211. doi: 10.1016/j.taap.2007.12.022. [DOI] [PubMed] [Google Scholar]
- 29.Stern ST, Zolnik BS, McLeland CB, Clogston J, Zheng J, McNeil SE. Toxicol. Sci. 2008;106:140–152. doi: 10.1093/toxsci/kfn137. [DOI] [PMC free article] [PubMed] [Google Scholar]
- 30.Oberdörster G, Sharp Z, Atudorei V, Elder A, Gelein R, Kreyling W, Cox C. Inhal. Toxicol. 2004;16:437–445. doi: 10.1080/08958370490439597. [DOI] [PubMed] [Google Scholar]
- 31.a) Yang S-T, Guo W, Lin Y, Deng X, Wang H, Sun H, Liu Y, Wang X, Wang W, Chen M, Huang Y, Sun Y-P. J. Phys. Chem. C. 2007;111:17761–17764. [Google Scholar]; b) Yang S-T, Fernando KAS, Liu J, Wang J, Sun H, Liu Y, Chen M, Huang Y, Wang W, Wang H, Sun Y-P. Small. 2008;4:940–944. doi: 10.1002/smll.200700714. [DOI] [PubMed] [Google Scholar]
- 32.Lutty GA. Toxicol. Appl. Pharmacol. 1978;44:225–249. doi: 10.1016/0041-008x(78)90185-0. [DOI] [PubMed] [Google Scholar]
- 33.Groc L, Lafourcade M, Heine M, Renner M, Racine V, Sibarita JB, Lounis B, Choquet D, Cognet L. J. Neurosci. 2007;27:12433–12437. doi: 10.1523/JNEUROSCI.3349-07.2007. [DOI] [PMC free article] [PubMed] [Google Scholar]
- 34.Jamieson T, Bakhshi R, Petrova D, Pocock R, Imani M, Seifalian AM. Biomaterials. 2007;28:4717–4732. doi: 10.1016/j.biomaterials.2007.07.014. [DOI] [PubMed] [Google Scholar]


