Abstract
Functional recognition imaging in Scanning Probe Microscopy (SPM) using artificial neural network identification is demonstrated. This approach utilizes statistical analysis of complex SPM responses to identify the target behavior, reminiscent of associative thinking in the human brain and obviating the need for analytical models. As an example of recognition imaging, we demonstrate rapid identification of cellular organisms using difference in electromechanical activity in a broad frequency range. Single-pixel identification of model Micrococcus lysodeikticus and Pseudomonas fluorescens bacteria is achieved, demonstrating the viability of the method.
I. Introduction
Scanning probe microscopy (SPM) techniques have become the mainstay of nanoscience and nanotechnology by providing easy-to-use, non-invasive structural imaging and manipulation on the nanometer and atomic scales. Beyond topographic imaging, SPMs have found a broad range of applications for probing electrical, magnetic, and mechanical properties – often at the level of several tens of nanometers1, 2 opening the pathway for understanding material functionality and interactions on these length scales.3 The surface topographic and functional (e.g., magnetic,1 electrostatic,1 or mechanical4) images are acquired in parallel and are interpreted by an observer to obtain required information, typically based on the morphology of the objects, as schematically illustrated in Fig. 1.
Figure 1.

(a) AFM topographic image (9 × 7 μm2) of the 2 types of bacteria on the surface imaged in using contact mode AFM in liquid. Two types of the bacteria with different shapes (rectangular and circular) are clearly seen on the image (a), which allows the construction of the recognition map for 2 bacteria types based on the shape. (b) Recognition image of the bacteria: type 1 – red, type 2 – blue, background – white, un-identified spot – green.
A common feature for existing SPM techniques is that only a single or a small number of parameters describing the local properties are obtained; furthermore, information contained in complementary images is ignored or interpreted within the limits of a cursory examination. As an example, applications of SPM for imaging and identification of biological systems are invariably based on the determination of small number of parameters (e.g. indentation modulus or binding force), or morphological analysis of object shape or structure. Examples include identification of cancer vs. normal cells based on mechanical properties,5-9 recognition imaging based on specific antibody interactions,10 morphological imaging and identification of bacterial spores and viruses based on the molecularly resolved structures of outer shell.11.
In contrast, the last 5 years has seen tremendous progress in multimodal and spectroscopic12 SPMs in which multiple information channels are acquired at each spatial pixel. In dynamic SPMs, these include dual excitation frequency SPM,13-15 multiple harmonic imaging,16, 17 HarmoniX mode,18 and band excitation SPM19 and rapid digital lock-ins20 that provide information on dynamic response at multiple frequencies. Common to all of these methods is the acquisition of complex multidimensional data sets comprised of local spectroscopic responses of materials to external stimuli. However, this abundance of information is belied by the difficulty in its interpretation in terms of materials properties or functionality, or even identification of the objects present in the system.
Here, we introduce a new SPM method – functional recognition imaging (FR-SPM) - that allows interpretation of multiple channel or spectroscopic data in terms of desired functionality, and demonstrate it on an example of rapid single cell identification using the detection of broadband frequency dependent electromechanical response. The method is demonstrated using Micrococcus lysodeikticus and Pseudomonas fluorescens deposited on a poly-L-lysine (PLL) coated mica substrate.
II. Recognition Imaging
II.1. Basic Principles of FR-SPM
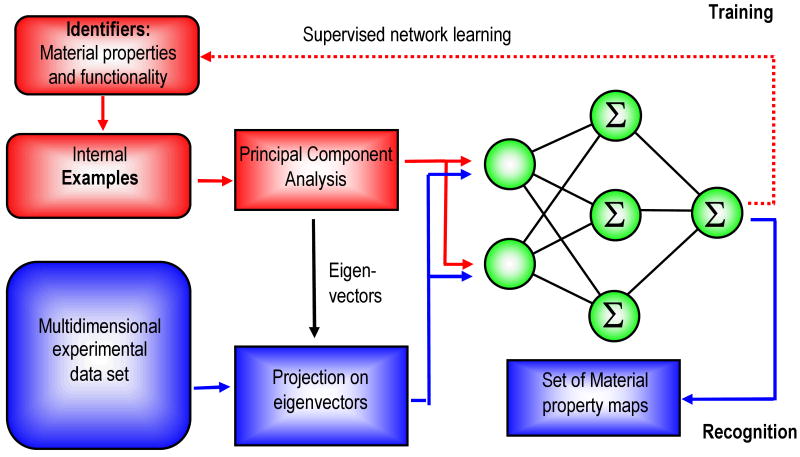
The central concept of FR-SPM is direct recognition of local behaviors from measured spectroscopic responses using neural networks trained on examples provided by the operator. This recognition step acts effectively as “associative thinking” in a human brain, with the additional advantage of numerical precision and error estimation of a mathematical model. Furthermore, it obviates the need for physical model of observed responses (except for obvious microscope calibratons) by directly linking response to target functionalities. The operation of FR-SPM includes the steps of training a neural net using a set of examples, data acquisition, and feature recognition (Fig. 2).
Figure 2.
FR-SPM flowchart showing the conversion of spatially resolved electromechanical spectra into recognition maps or materials' properties maps.
On the training stage, the neural network is configured to recognize material functionality for a set of examples provided by the observer. The structure of the resulting 3- or higher dimensional data set is simplified using principal component analysis (PCA) (or other projection methods) to whiten and decorrelate the data and reduce the number of independent variables. Thus determined parameter vector is used to train a feed-forward neural network using the PCA loadings as an input and parameters describing material functionality as a target.
On the recognition stage, the measured SPM data is analyzed using a prior-trained network to provide a map of material functionality. The measured responses are projected on the PCA eigenvectors, and the decorrelated components of multispectral data at each pixel are input for the previously trained neural network. The network output yields material property maps. The big advantage of this approach is that the decorrelation and neural network processing are linear and algebraic operations, which implies that recognition data processing is fast. At the same time, the flexibility of neural network algorithms obviates the need for human supervision during analysis of multiple spectra once target set is established. Finally, the recognition error of the neural net can be used as an indicator of the responses absent in the original training set.
II.2. Principal Component Analysis (PCA)
The first step in recognition imaging is the decorrelation and dimensionality reduction of the data. The standard spectroscopic SPM data (e.g. force-distance curve or set of harmonic images) is comprised of a large number of points distributed in parameter space, R(xj), j = 1,.., P, where R is response (e.g. force, amplitude, electromechanical signal), and x is parameter (e.g. frequency or bias). In typical spectroscopic techniques, P is of the order of several hundred. Hence, the dimensionality of the R(xj) vector is generally very high, and its components are strongly correlated (e.g. simply as a consequence of the fact that response are typically piece-wise smooth and monotonic functions). Hence, the natural basis for representation of the R(xj) [i.e. delta functions δ(xj) at each sampling point, ] is unsuitable for data analysis due to strong correlations and large dimensionality (all Rj are comparable).
A natural way to simplify such data is the PCA,21, 22 broadly used in electron microscopy23-25 and applied for SPM by Jesse and Kalinin.12 In PCA, the spectroscopic image of NxM pixels formed by spectra containing P points is represented as a superposition of the eigenvectors wk (linear basis change) as,
| (1) |
where aik ≡ ak (x,y) are position-dependent expansion coefficients, and Ri(xj) ≡ R(x,y,xj) are responses at different spatial locations. The eigenvectors wk(ω) and the corresponding eigenvalues λk are found from the covariance matrix, C = AAT, where A is the matrix of all experimental data points Aij, i.e. the rows of A correspond to individual grid points (i = 1,..,N · M), and columns correspond to sampling points, j = 1,..,P. The eigenvectors of C, wk(ωj), are orthogonal and are chosen such that corresponding eigenvalues are placed in descending order,. λ1 > λ2 > …. In other words, the first eigenvector w1(ωj) contains the most information (defined as variance) within the spectral-image dataset, the second contains the most information after subtraction of the first one, and so on. In this manner, the first p maps, ak(x,y), contain the majority of information within the 3D dataset, while the remaining P-p sets are dominated by noise. Hence, the response can now be represented as
| (2) |
where Y is the noise term.
Mathematically, the eigenvalues and corresponding eigenvectors are determined through singular value decomposition of the A matrix.26 The number of significant elements, p, can be chosen based on the overall shape of λk(k) dependence, where the linearly decaying part corresponds to the significant elements and the constant part corresponds to noise-dominated components, or from the correlation function analysis of ak(x,y) maps.27
Note that PCA allows simplifying and decorrelating the multivariate statistical data. However, the resulting components, while allowing most efficient representation of the data, are not directly related to the underpinning physical mechanisms. In specific cases, such correspondence can be established approximately.12 However, the capability to lower the dimensionality of the data is invaluable for all advanced forms of data analysis, as exemplified by neural network identification discussed below.
II.3. Neural network (NN)
On the second stage, the PCA components are used as an input for the recognition neural network.28 Typically, we utilize a layered back propagation network with 3 layers – input, hidden, and output, each formed by a number of neurons connected by intralayer weight matrices. The number of input neurons is equal to the number of significant PCA components, and they are initialized as , where s denotes the chosen data set.
On transition from the input to hidden layer, the values of the neurons are set as
| (3) |
where is weight matrix. The outputs of the hidden-layer neurons are processed using transfer function φ(x), which can be chosen as linear (purelin), or non-linear (e.g. sigmoidal–tansig). Finally, the values of the output neurons are defined as
| (4) |
where is the second weight matrix.
On the training stage, the neural net is presented with the set of examples, aik(s), and corresponding target outputs, . The weight matrices and are updated using back-propagation algorithm to minimize the square error.27 Upon presentation of multiple examples, until the minimum error is achieved, the network starts to act as a universal interpolator that is able to relate the input variables to the target outputs. The reproducibility and errors associated with NN analysis in comparison with conventional methods are well studied.29
III. Bacterial recognition based on the electromechanical response
As a model system we use live Micrococcus lysodeikticus (M. lysodeikticus) and Pseudomonas fluorescens (P. fluorescens) deposited on a poly-L-lysine (PLL) coated mica substrate (see Materials and Methods for details). The model bacteria are chosen to be easily identifiable by their characteristic shapes on an AFM topographic image, providing readily identifiable contrast (Fig. 1) and hence source of the training set for the network. While the mechanical properties of these bacteria have not been studied, the stiffness of P. aeruginosa, the closest species to the bacteria of our choice, has been reported in the literature as 0.016 – 0.053 N/m (4).
Here, we attempt to recognize the bacteria at a single pixel level, i.e. using the response measured at a single spatial location. This is fundamentally different from recognition methods based on shape identification, e.g. topographic images or membrane structure that utilize spatially-correlated information in multiple adjacent pixels. Furthermore, we explore the variability of identification within the bacteria.
III.1. Single frequency PFM imaging
The examples of the topographic images of the bacteria are shown in Fig. 3 (a). The several M. lysodeikticus and P. fluorescens bacteria are clearly identified by the characteristic shapes. In addition, a number of large-scale topographic features (e.g. contamination) are clearly seen.
Figure 3.
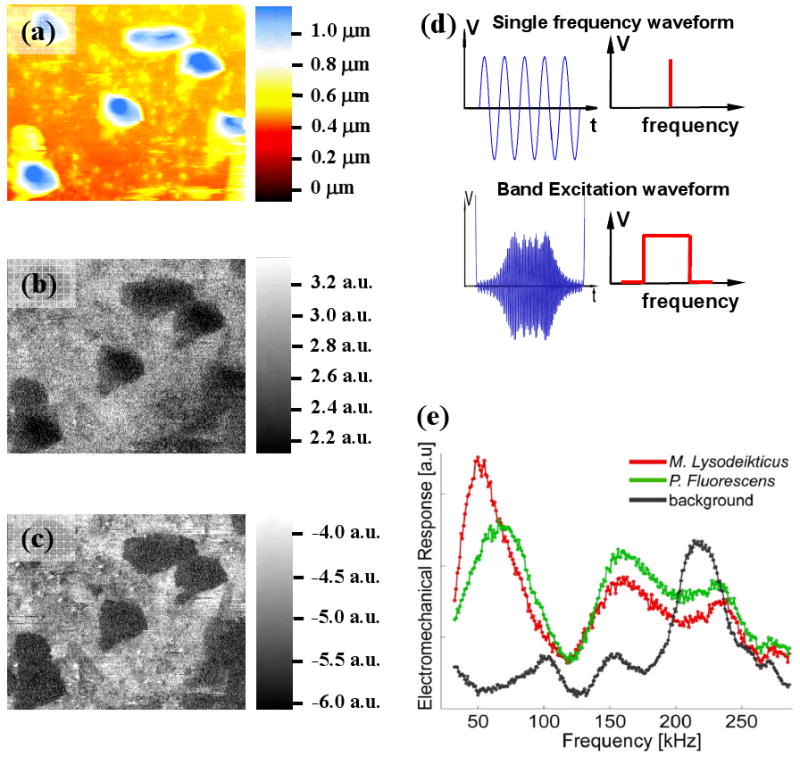
(a) AFM topography image (contact mode in liquid) of the M. lysodeikticus and P. fluorescens on PLL-coated mica (the average height of the features is 500 nm; red-to-blue contrast scale bar is 1 μm); (b) amplitude of the single frequency PFM, (c) phase of single frequency PFM, (d) schematic representation of the waveforms used in single frequency PFM and in BE probing of the electromechanical coupling.
As an example of functional imaging, we have performed single frequency Piezoresponse force microscopy. In this, the tip is excited using periodic bias, and mechanical response of the surface is detected as a cantilever deflection. This method is broadly used for characterization of ferroelectric materials30 and can be applied for imaging biological systems such as piezoelectric proteins in calcified and connective tissues 31, 32. PFM in liquid has been validated on ferroelectric materials33, and have recently been demonstrated for biological systems31. The PFM maps of the bacteria are shown in Fig. 3(b,c), and clearly show bacterial shapes. The contrast is virtually uniform within the bacteria. However, there is a little variability between different bacterial types.
III.2. Band excitation (BE) imaging
The PFM contrast, similar to most SPMs such as phase imaging,34 strongly depends on frequency. The optimal frequency for recognition imaging, i.e. corresponding to maximal contrast among bacteria types and between bacteria and substrate is unknown. To overcome this uncertainty, we adopt an approach based on a full frequency-response curve measured at each sample point using the band excitation approach19. This is essentially equivalent to performing measurements at multiple closely spaced frequencies, albeit avoiding the necessity for lengthy sequential acquisition.
In BE, the excitation and detection is performed using a signal having defined amplitude density and phase content in a given frequency interval, as compared to a single or two frequencies used in current SPMs. The use of the broadband signal allows frequency-dependent response to be obtained in a broad frequency range at a standard imaging rate, thus enabling rapid spatially-resolved measurements. This imaging step results in a 3D data array formed by amplitude- and frequency spectrum at each spatial point. The characteristic response spectra for the M. lysodeikticus, P. fluorescens and background are shown in Fig. 3(e), demonstrating the significant differences among the frequency-dependent responses between different bacteria types and substrate.
Note that the frequency dependence of electromechanical response is determined by the convolution of (a) electromechanical response of the system per se (excitation force), (b) contact mechanics of the tip-surface junction, and (c) dynamics of the cantilever (transfer function of the detector). The electromechanical response that acts as the excitation force is controlled by the long range interactions including electric double layer forces35, and bacteria-specific electromotility and membrane flexoelectricity36. Given the low diffusion coefficients of ions in solutions and relatively large effective mass of bacteria, both electrostatic interactions and electromechanical cellular response are expected to have significant frequency dispersion in 10 kHz – 1 MHz frequency range. The contact mechanics is controlled by the local elastic and loss moduli of the bacterial surface and the indentation force. Finally, cantilever dynamics is controlled by the boundary conditions on the tip-surface junction37 and hydrodynamic cantilever damping,38 giving rise to a complex resonant behavior. The lack of simple analytical models for any of the response components precludes analytical interpretation of the data.
However, in analyzing the experimental data, we note that the response curve is generally similar within bacteria of the same type and changes strongly among different bacteria and the substrate, suggesting that dynamic broad band electromechanical response (i.e. spectral response, as opposed to single frequency response used in standard scanning probe microscopy) can be used for rapid cell identification even though the detailed underlying mechanisms are unknown. The error bars (defined as standard deviation for signal within bacteria of selected type at a single frequency) are sufficiently high to preclude unambiguous identification based on single frequency. Below, we demonstrate the functional recognition based on the full broadband electromechanical response.
III.3. Recognition imaging
Band excitation PFM (BE-PFM) yields full amplitude and phase vs. frequency cantilever response curves at each surface point, generating a 3D {A,θ}(x, y, ω) data array, where {A,θ} is the response amplitude and phase, ω is frequency, and (x, y) is location of a pixel. The structure of the resultant data set was simplified using principal component analysis, as described in Section II.1.
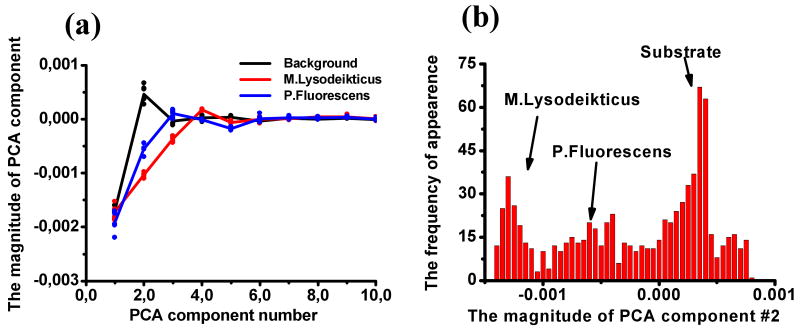
The eigenvectors of Eq. (1) are shown in Fig. 4 (a). Note that the eigenvectors do not have direct physical meaning, and rather represent the most statistically significant elements of the spectrum. The corresponding eigenvalues are shown in Fig. 4 (b) and illustrate that the first 6 PCA maps contain 99% of the information of the original spectra comprised of 261 data points. Spatial maps of the first 9 PCA components are shown in Fig. 4 (c). The marked contrast of the different types of bacteria between maps is obvious – i.e. M. lysodeikticus is clearly seen in the 2nd, 3d, and 4th PCA component maps, while P. fluorescens shows weak contrast in the 2nd and 4th maps and is not visible in other component maps. The characteristic distribution of the PCA components for M. lysodeikticus, P. fluorescens and substrate are shown in Fig. 5 (a). Note that while the average PCA values for two types of bacteria and the substrate are different and show clearly defined contrast [and hence may serve as an effective method to display the data], the histograms for each component strongly overlap, and hence identification of bacteria based on a single PCA component only is impossible (Fig. 5 (b)) and morphological information on bacteria shape must be used.
Figure 4.
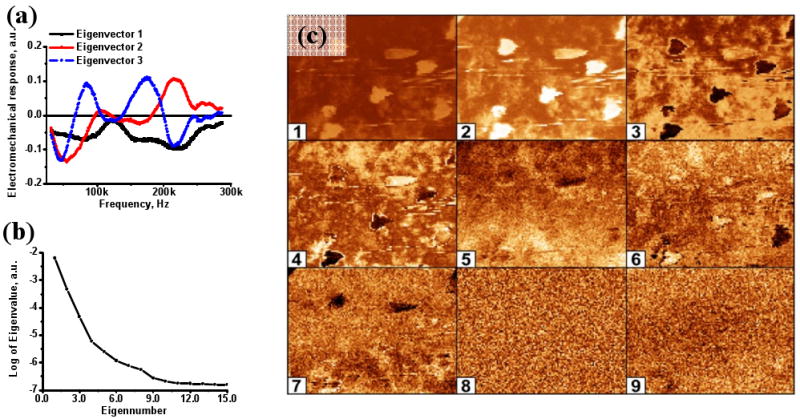
(a) Eigenvectors for the first 3 PCA components; (b) logarithm of the first 16 eigenvalues; (c) maps showing the spatial variations in magnitude of PCA components 1 through 9.
Figure 5.
(a) The magnitude of the PCA component as a function of PCA component number, showing the difference among the M. lysodeikticus, P. fluorescense and background; (b) The histogram of the 2nd PCA component image, differentiation of M. lysodeikticus, P. fluorescense and background is fairly difficult.
To identify the bacterial based on the single-pixel response we utilize the neural network approach described in section II.3. The fully connected neural network with 6 input, 3 output, and 3 neurons in the hidden layer was used. The transfer functions were sigmoid in the hidden layer and purelin in the output layer. The net was trained using standard back propagation algorithm using a part of the image [shown by rectangle]39. The targets were (1,0,0) for M. lysodeikticus, (0,1,0) for P. fluorescens and (0,0,1) for background. The validation set was chosen as a random subset of training data.
Thus the trained network was applied to the full BE-PFM image, providing intensity maps corresponding to individual bacterial components as shown in Fig. 6. Note that both bacteria types and the substrate are identified correctly both within and outside the training region. More importantly, the characteristic response is close to 1 within the each bacteria type, and is essentially zero outside. This demonstrates that the recognition is achieved on the level of a single spatial pixel and is only confirmed using the bacterial shape.
Figure 6.
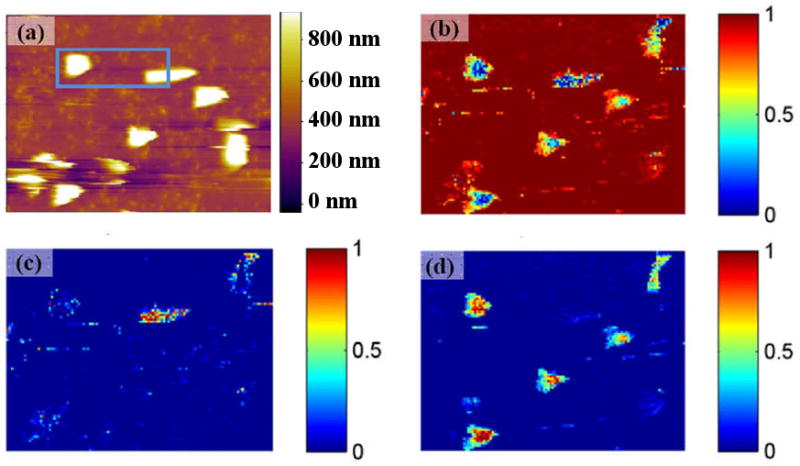
(a) Topography image of the bacteria on PLL mica (area within blue rectangle was used for training neural net). Output of the neural net in the form of recognition maps for the background (b), P. fluorescense (c) and M. lysodeikticus (d). Value 0 corresponds to the minimum likelihood of the point to be the target, when value 1 corresponds to the maximum one.
To generate the 3D recognition image, the intensity of the signals corresponding to the different types of bacteria and the substrate are color coded, i.e. neural network output at 1, 2, and 3d neurons mapped of the RGB intensities. The resulting image is overlaid on the topographic structure as shown in Fig. 7. Note that M. lysodeikticus, P. fluorescens, and the substrate are unambiguously identified. Furthermore, a patch of flat surface is identified as M. lysodeikticus (presumably flattened bacterial membrane), whereas large topographic features (debris) are not recognized as bacteria. Hence, the image illustrates unambiguous identification of bacteria types and substrate based on the electromechanical response.
Figure 7.
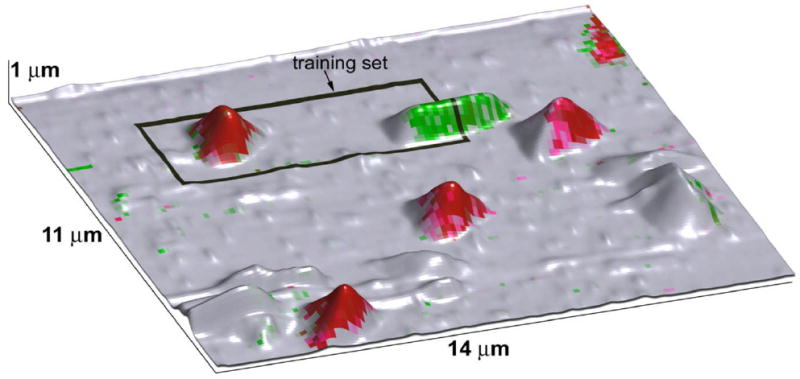
Results of neural network identification of the bacteria (M. lysodeikticus (red), P. fluorescens (green)) are overlaid with topography image. Training area for neural network is outlined by black rectangle.
V. Materials and methods
V.1. Culture growth and preparation
Bacteria samples, M. lysodeikticus (Sigma-Aldrich # M3770) and P. fluorescens (ATCC # 11150) were grown in Trypticase Soy Broth (BD # 211768) and Difco™ Nutrient Broth (BD # 234000), correspondingly, for 24 hrs at 30°C. The bacteria suspension was purified by centrifugations at 1000g for 5 minutes and then re-suspended in Millipore water. For bacteria immobilization we used poly-L-lysine (PLL, Sigma-Aldrich #P4707) coated mica – 50 μl of sterile 0.01% PLL solution was dried-out on freshly cleaved mica (EMS #71851-05) at room temperature. Then 50 μl of bacteria suspension was adsorbed on PLL-coated mica for 15 minutes, followed by washing with copious amounts of Millipore water. Pseudomonas species are prone to change from rod to coccoid shape during starvation; however this morphology change takes several days to occur. To avoid this problem, PFM experiments were performed immediately after immobilization of bacteria.
V.2. Scanning Probe Microscopy
Asylum Research MFP-3D Atomic Force Microscope (AFM) with a static fluid cell was used for the imaging in Millipore water. Piece of mica about 1 cm in diameter was glued on glass bottom of the cell. Bacteria samples were prepared according to the procedure (I). Au coated tip (Olympus, RC800PB) with stiffness ∼0.06 N/m and resonance frequency 17 kHz was used for the experiments. The cantilever has spring board shape with 20 μm width, 200 μm length and 0.8 μm thickness.
The Band Excitation (BE) Piezo Force Microscopy (PFM) was implemented on a MFP-3D AFM (Asylum Research) and an in-house developed MatLab/LabView data acquisition and control system [see Ref. 19 for additional details]. A voltage excitation band spanning approximately 32 - 286 kHz (increasing chirp) with amplitude of 10 V was applied to the microscope tip.
VI. Summary and outlook
To summarize, we proposed an approach for rapid recognition imaging based on the response recognition using trained neural network. The approach is demonstrated for rapid bacterial identification using dynamic electromechanical response. Note however that the recognition algorithms used here is universal and could be extended to other spectroscopic and multimodal SPM modes including force-distance curves, multiple harmonic detection, 16, 17 HarmoniX,18 etc. In all these cases, the use of direct identifiers and calibration standards can allow to avoid the necessity of defined physical model and use “functional recognition” based on single-point response shape. That said, there is tremendous potential for future development of method to introduce proper normalization and calibration routines (e.g. due to the use of cantilevers with different spring constants, etc).
Given the well-known scalability of principal component analysis for real-time operation,40 this approach can be used in real-time imaging. Furthermore, the standard strategies for biological recognition based on functionalized tips10, 41 can be synergistically combined with this approach to increase selectivity. This analysis mode is ideally suited for differentiation and identification of cells with differing phenotype obviating the need for quantitative extraction of materials properties, as such can be broadly applied for cancer identification, biodetection, and many other areas. The broad range of potential applications for the proposed technique may require modification/addition to the proposed protocol due to the variety of experimental conditions where this method can be used. Separate validation of the technique is required for each experimental configuration before reliable conclusions from the obtained results can be drawn.
Acknowledgments
The research was supported by ORNL SEED program (SJ, MPN, SVK). The development of BE-PFM was sponsored by the Center for Nanoscale Materials Sciences at the Oak Ridge National Laboratory, Office of Basic Energy Sciences, U.S. Department of Energy. The research was supported in part by CNMS User proposals [CNMS2008-077, CNMS2009-102] and NIH grant RR024449.
References
- 1.Meyer E, Hug HJ, Bennewitz R. Scanning Probe Microscopy: The Lab on a Tip. Springer; 2003. [Google Scholar]
- 2.Kalinin SV, Gruverman A. Scanning Probe Microscopy: Electrical and Electromechanical Phenomena at the Nanoscale. Springer; 2006. [Google Scholar]
- 3.Gerber C, Lang HP. Nature Nanotechnology. 2006;1(1):3–5. doi: 10.1038/nnano.2006.70. [DOI] [PubMed] [Google Scholar]
- 4.Rabe U, Arnold W. Applied Physics Letters. 1994;64(12):1493–1495. [Google Scholar]
- 5.Cross SE, Jin YS, Rao JY, Gimzewski JK. Nature Nanotechnology. 2009;4(2):72–73. doi: 10.1038/nnano.2007.388. [DOI] [PubMed] [Google Scholar]
- 6.Cross SE, Jin YS, Tondre J, Wong R, Rao J, Gimzewski JK. Nanotechnology. 2008;19(38):8. doi: 10.1088/0957-4484/19/38/384003. [DOI] [PubMed] [Google Scholar]
- 7.Cross SE, Jin YS, Rao J, Gimzewski JK. Nature Nanotechnology. 2007;2(12):780–783. doi: 10.1038/nnano.2007.388. [DOI] [PubMed] [Google Scholar]
- 8.Sokolov I. Nature Nanotechnology [Google Scholar]
- 9.Van Vliet KJ, Bao G, Suresh S. Acta Materialia. 2003;51(19):5881–5905. [Google Scholar]
- 10.Stroh C, Wang H, Bash R, Ashcroft B, Nelson J, Gruber H, Lohr D, Lindsay SM, Hinterdorfer P. Proceedings of the National Academy of Sciences of the United States of America. 2004;101(34):12503–12507. doi: 10.1073/pnas.0403538101. [DOI] [PMC free article] [PubMed] [Google Scholar]
- 11.Plomp M, Leighton TJ, Wheeler KE, Hill HD, Malkin AJ. Proceedings of the National Academy of Sciences of the United States of America. 2007;104(23):9644–9649. doi: 10.1073/pnas.0610626104. [DOI] [PMC free article] [PubMed] [Google Scholar]
- 12.Jesse S, Kalinin SV. Nanotechnology. 2009;20(8):085714. doi: 10.1088/0957-4484/20/8/085714. [DOI] [PubMed] [Google Scholar]
- 13.Proksch R. Applied Physics Letters. 2006;89(11):3. [Google Scholar]
- 14.Rodriguez BJ, Callahan C, Kalinin SV, Proksch R. Nanotechnology. 2007;18(47):6. [Google Scholar]
- 15.Lozano JR, Garcia R. Physical Review B. 2009;79(1):9. [Google Scholar]
- 16.Legleiter J, Park M, Cusick B, Kowalewski T. Proceedings of the National Academy of Sciences of the United States of America. 2006;103(13):4813–4818. doi: 10.1073/pnas.0505628103. [DOI] [PMC free article] [PubMed] [Google Scholar]
- 17.Raman A, Melcher J, Tung R. Nano Today. 2008;3(12):20–27. [Google Scholar]
- 18.Sahin O, Magonov S, Su C, Quate CF, Solgaard O. Nature Nanotechnology. 2007;2(8):507–514. doi: 10.1038/nnano.2007.226. [DOI] [PubMed] [Google Scholar]
- 19.Jesse S, Kalinin SV, Proksch R, Baddorf AP, Rodriguez BJ. Nanotechnology. 2007;18(43):8. [Google Scholar]
- 20.Kos AB, Hurley DC. Measurement Science & Technology. 2008;19(1):9. [Google Scholar]
- 21.Joliffe IT. Principle Component Analysis. 2nd. Springer; 2002. [Google Scholar]
- 22.http://www.snl.salk.edu/∼shlens/pub/notes/pca.pdf.
- 23.Bonnet N. Micron. 2004;35(8):635–653. doi: 10.1016/j.micron.2004.04.006. [DOI] [PubMed] [Google Scholar]
- 24.Bosman M, Watanabe M, Alexander DTL, Keast VJ. Ultramicroscopy. 2006;106(1112):1024–1032. doi: 10.1016/j.ultramic.2006.04.016. [DOI] [PubMed] [Google Scholar]
- 25.Bonnet N. Journal of Microscopy-Oxford. 1998;190:2–18. [Google Scholar]
- 26.E.g. svd function in Matlab, M., Inc.
- 27.Hagan MT, Demuth HB, Beale MH. Neural Network Design. 1996 [Google Scholar]
- 28.Haykin S. Neural Networks and Learning Machines. Plenum; 2008. [Google Scholar]
- 29.Simarasinghe S. Neural Networks for Scientists and Engineers. 2007 [Google Scholar]
- 30.Gruverman A, Kholkin A. Reports on Progress in Physics. 2006;69(8):2443–2474. [Google Scholar]
- 31.Kalinin SV, Rodriguez BJ, Jesse S, Seal K, Proksch R, Hohlbauch S, Revenko I, Thompson GL, Vertegel AA. Nanotechnology. 2007;18(42):10. doi: 10.1088/0957-4484/18/42/424020. [DOI] [PubMed] [Google Scholar]
- 32.Gruverman A, Wu D, Rodriguez BJ, Kalinin SV, Habelitz S. Biochemical and Biophysical Research Communications. 2007;352(1):142–146. doi: 10.1016/j.bbrc.2006.10.182. [DOI] [PubMed] [Google Scholar]
- 33.Rodriguez BJ, Jesse S, Baddorf AP, Kalinin SV. Physical Review Letters. 2006;96(23):4. doi: 10.1103/PhysRevLett.96.237602. [DOI] [PubMed] [Google Scholar]
- 34.Garcia R, Perez R. Surface Science Reports. 2002;47(68):197–301. [Google Scholar]
- 35.Derjaguin BV. Progress in Surface Science. 1994;45(14):223–231. [Google Scholar]
- 36.Todorov AT, Petrov AG, Fendler JH. Langmuir. 1994;10(7):2344–2350. [Google Scholar]
- 37.Hirsekorn S, Rabe U, Arnold W. Nanotechnology. 1997;8(2):57–66. [Google Scholar]
- 38.Green CP, Sader JE. Physics of Fluids. 2005;17(7):12. [Google Scholar]
- 39.Haykin S. Neural Networks: A Comprehensive Foundation. 2nd. Prentice Hall; 1998. [Google Scholar]
- 40.Chen Z, Haykin S, E JJ, Becker S. Correlative Learning: A Basis for Brain and Adaptive Systems. Willey; 2007. [Google Scholar]
- 41.Noy A. Handbook of Molecular Force Spectroscopy. Springer; 2007. [Google Scholar]


