

Abstract
Backgrounds
We tested the hypothesis that right ventricular (RV) pressure overload affects RV function, and further influences left ventricular (LV) geometry that adversely affects LV twist mechanics and segmental function.
Methods and Results
Echocardiographic images were prospectively acquired in 44 (46±12 years; 82%F) patients with evidence of pulmonary hypertension (PH) (estimated pulmonary systolic pressure [PASP] =71±23 mmHg) and in 44 age and gender-matched healthy subjects. Patients with intrinsic LV diseases were excluded. RV lateral wall (RVLAT) longitudinal strain (LS) and interventricular septal (IVS) LS were reduced in PH group compared with controls (-15.9±7.6% vs.-25.5±6.1%, p<0.001 and -17.3±4.4% vs.-20.2±3.9%, p=0.002, respectively), while LV lateral wall (LVLAT) LS was preserved. RVLAT and IVS LS, but not LVLAT LS, correlated with PASP(r=0.56, p<0.01; r=0.32, p<0.01) and LV eccentricity index (LVEI) (r=0.57, p<0.01; r=0.57, p<0.01). IVS and LVLAT circumferential strains (CS) were both reduced in the PH group. Although IVS CS and LVLAT CS correlated with PASP and LVEI, after adjusting CS for LVEI, differences between groups persisted for IVS CS (p<0.01) but not LVLAT CS (p=0.09). LV torsion was decreased in patients with PH compared with controls (9.6±4.9° vs. 14.7±4.9°, p<0.001). LV torsion inversely correlated with PASP (r=-0.39, p<0.01) and LVEI (r=-0.3, p<0.01). LV untwisting rates were similar in both groups (p=0.7).
Conclusions
Chronic RV pressure overload directly affects RV longitudinal systolic deformation. RV pressure overload further influences IVS and LV geometry, which impairs LV torsion and segmental LS and CS, more for the IVS than the free wall of the LV.
Keywords: Torsion, pulmonary hypertension, strain, echocardiography
The right and left ventricles share the interventricular septum (IVS) and are contained within the pericardial sac, inducing interdependence in ventricular structure and function1,2. Chronic right ventricular (RV) pressure overload leads to a leftward shift and flattening of the IVS1-4. The degree of severity of chronic RV pressure overload has traditionally relied on the degree of pulmonary artery systolic pressure (PASP) rise, yet patients may present with a wide range of disease severity within a similar range of elevated PASP. Little is known about the impact of RV pressure overload and ventricular geometric alteration on biventricular systolic deformation and left ventricular (LV) twist and untwist mechanics in the setting of pulmonary hypertension. Currently, ventricular strain and torsion analysis assessed by speckle tracking echocardiography (STE) may provide insights into the impact of RV pressure overload on ventricular interdependence and subsequent LV performance beyond structural and volumetric analysis. Accordingly, we sought to test the hypotheses by using this echocardiographic technique that (1) RV systolic pressure directly affects RV performance; (2) that RV pressure/volume overload influences LV geometry, which (3) in turn influences LV segmental function and torsion. We also hypothesized that these alterations will be more marked in the septum rather than lateral LV wall.
Methods
Patients
Detailed transthoracic echocardiographic data were prospectively collected from 62 patients diagnosed with pulmonary hypertension (PH), defined by the Third World Symposium on Pulmonary Arterial Hypertension 5, and family members of patients with familial pulmonary arterial hypertension (PAH). Of these 62 consecutive participants who underwent informed consent, we included 51 patients with PH and family members who had evidence of PAH defined as peak PASP >35 mmHg estimated by Doppler echocardiography 6,7. We excluded participants with abnormal LV end-diastolic diameter > 5.5 cm, LV wall thickness > 1.5 cm, prior myocardial infarction, uncontrolled hypertension, significant aortic/mitral valve disease, and age > 65 years, as it was felt that these patients might have alterations in LV function independent of their PH. Of 51 patients and family members, 44 met the study criteria and were included in the study. Of 44 patients, 42 had PH diagnosed previously by right heart catheterization. These 44 subjects constituted a heterogeneous group that included 16 patients with idiopathic PAH, 10 patients with familial PAH, 11 patients with PAH associated with connective tissue diseases, 4 patients with PH associated with sleep apnea disorders, 1 patient with PH associated with sarcoidosis, and 2 family members of patients with familial PAH who had estimated PASP > 35 mmHg. Similar echocardiographic data from age and gender-matched 44 healthy control subjects were collected for comparison. The study protocol was approved by the Cleveland Clinic IRB.
Echocardiographic Study
All 44 participants with PH and 44 controls underwent a complete transthoracic echocardiographic study including two-dimensional, color flow and spectral Doppler and high frame rate (70-140 Hz) imaging using a GE-Vingmed Vivid 7 system (Horten, Norway). Agitated saline was used to enhance tricuspid regurgitation (TR) spectral Doppler in subjects with PH who had weak spectral Doppler signals.
Echocardiographic Analysis
PASP was estimated from systolic pressure gradient between the RV and the right atrium by the peak continuous-wave Doppler velocity of the TR jet using the modified Bernoulli equation plus right atrial pressure estimated from inferior vena caval size and collapsibility with respiration, as previously validated and described by others6,7. RV end-diastolic and end-systolic areas were measured in the apical 4- chamber view by tracing the endocardial border of the RV and the tricuspid annular plane3,8-10. RV fractional area change (RVFAC) was calculated as: (RV end-diastolic area- RV end-systolic area)/RV end-diastolic area3,8-10. Tricuspid annular plane systolic excursion (TAPSE) was measured in the apical 4-chamber view as the distance of lateral tricuspid annular movement from end-diastole to end-systole 8-10. Right atrial volume (RAV) was measured in the apical 4- chamber view by using single plane area-length method 11. The RAV was indexed by body surface area. LV end-diastolic eccentricity index, a measure of IVS displacement, was measured in the parasternal mid papillary short axis view at both end-systole and -diastole. This index was calculated by the method of Ryan12 as D1/D2, where D1 is the diameter of the LV parallel to the IVS (anterior to inferior wall) and D2 is the diameter perpendicular to and bisecting the IVS (septum to posterolateral wall). LV end-diastolic and end-systolic volumes were calculated from apical views using the modified Simpson's method9. Stroke volume was calculated from the difference between LV end- diastolic and end- systolic volumes. LV ejection fraction was calculated from stroke volume/LV end-diastolic volume9.
Ventricular strain, torsion, and untwisting rate were analyzed by 2-dimensional STE technique using ECHOPAC® work station, as previously described13,14. The RV lateral wall (RV LAT), IVS, and LV lateral wall (LV LAT) were divided into three segments (basal, mid, and apex). In the apical 4-chamber view, the average value of end-systolic longitudinal strain (LS) of RV LAT wall from three segments was calculated as RV LAT longitudinal strain (RV LAT LS). Using apical 4-chamber data, the average value of end-systolic LS for the inferoseptal wall was calculated, while the apical long-axis view was used to obtain the data for the anteroseptal wall (in each case averaging basal, mid, and apical segments). The mean of these two strain measurements was considered to be IVS LS. Similarly, from these same images, the average value of end-systolic LS for three levels of the anterolateral (lateral) and inferolateral (posterior) walls was considered to represent LVLAT LS. From three short-axis views (at the mitral valve, mid papillary muscle, and apical level), end-systolic circumferential strain (CS) curves were obtained. As with LS, peak CS was averaged from each level of the two septal segments and the two free wall segments to yield IVS CS and LVLAT CS.
LV rotation in the three short-axis planes was determined as average rotation of the six myocardial segments around the central axis. Counterclockwise rotation (as viewed from the apex) was considered positive while clockwise rotation was deemed negative. LV torsion was calculated as the maximal difference between the apical and basal rotation curves during systole13,15. That maximal difference per second during early diastole was calculated as LV untwisting rate13,15.
The digitally stored echocardiographic data were analyzed by an experienced sonographer and cardiologist who were unaware of patient's clinical characteristics. All measurements represent an average of 3-5 consecutive cycles.
Reproducibility
Echocardiographic data from a nested case group of 10 randomly selected patients and controls were analyzed by the same observer and by a second different observer, respectively. Measurements of RV LAT LS by the same observer and 2 independent observers showed a mean ± SD difference of 0.4 ±1.5% and 0.2 ± 1.6%, respectively. Intraclass correlation coefficients between the same observer and different 2 observers were 0.92 and 0.93, respectively (p<0.001). Measurements of LV torsion by 2 independent observers showed a mean difference by the same observer and of 0.03 ± 1.74° and 0.30 ± 1.58°, respectively. Intraclass correlation coefficients between the same observer and different 2 observers were 0.88 and 0.93, respectively (p<0.001).
Statistical Analysis
Continuous data are presented as mean and standard deviation or median (range). Categorical data are presented as frequency. Comparison of categorical and continuous variables between subjects with PH and controls were performed by McNemar's test and paired-t test, respectively. Correlations between echocardiographic parameters and estimated PASP or LV end-diastolic eccentricity index were tested by linear regression analysis and Pearson's correlation coefficients. The correlation coefficients were further compared amongst septal, LV lateral, and RV lateral (if applicable) walls by using SISA online software 16. Analysis of covariance (ANCOVA) was performed to test whether certain factors (PH and controls) have an effect after removing the variance for which quantitative covariates (peak PASP and LV end-diastolic eccentricity index) account. Statistical significance was defined as p <0.05.
Results
Clinical and echocardiographic characteristics in PH and control groups are shown in Table 1. The mean age of participants with PH was 46 ± 12 years; 82% were female. Participants with PH had significantly larger RV size, increased RV free wall thickness, impaired gross RV systolic and diastolic function, increased LV eccentricity index, and lower LV end-systolic and end-diastolic volume indexes. Estimated peak PASP in PH group was 71 ± 23 mmHg. Sixty-six percent (29 of 44) of participants with PH had estimated peak PASP > 60 mmHg.
Table 1. Baseline Characteristics.
| PH (n=44) |
Controls (n=44) |
P | |
|---|---|---|---|
| Age (years) | 46 ± 12 (45, 18-64) |
46 ± 12 (45, 8-61) |
0.90 |
| Female (n) | 36 | 36 | 0.79 |
| Diabetes Mellitus (n) | 2 | 0 | 0.17 |
| Systolic BP(mmHg) | 115 ± 17 (114, 85-140) |
118 ± 14 (114, 96-131) |
0.44 |
| Diastolic BP (mmHg) | 65 ± 11 (66, 45-88) |
69 ±10 (69, 45-88) |
0.32 |
| Estimated pulmonary systolic pressure (mmHg) | 71 ± 23 (71, 37-125) |
23 ± 4 (22, 17-31) |
<0.001 |
| RV end-diastolic area (cm2) | 26.3 ± 9.5 (25, 12-49) |
12.3 ± 3.5 (12, 3-22) |
<0.001 |
| RV end-systolic area (cm2) | 18.3 ± 8.7 (16, 6-40) |
5.8 ± 1.9 (6, 2-10) |
<0.001 |
| RV fractional area change (%) | 32 ± 14 (32, 19-61) |
60 ± 13 (53, 25-96) |
<0.001 |
| Tricuspid annular plane systolic excursion (cm) | 1.6 ± 0.5 (1.6, 0.6-2.8) |
2.4 ± 0.5 (2.5, 1.1-3.2) |
<0.001 |
| Right atrial volume index (ml/m2) | 35 ± 21 (27, 11-92) |
14 ± 5 (13, 6-29) |
<0.001 |
| RV thickness (mm) | 9.7 ± 3.0 (10, 4 -19) |
3.7 ± 0.9 (4, 2- 6) |
<0.001 |
| LV end-systolic eccentricity index | 1.55 ± 0.69 (1.16, 0.84-2.13) |
1.03 ± 0.21 (0.94, 0.76-2.11) |
<0.001 |
| LV end-diastolic eccentricity index | 1.24 ±0.32 (1.39, 0.47-3.50) |
0.96 ± 0.09 (1.04, 0.67-2.11) |
<0.001 |
| LV ejection fraction (%) | 67 ± 12 (65, 42-92) |
63 ± 9 (61, 47-78) |
0.043 |
| Mitral E velocity (cm/s) | 77 ± 27 (76, 28-192) |
76 ±16 (76, 37-112) |
0.836 |
| Mitral E deceleration time (ms) | 200± 63 (189,107-349) |
186 ± 30 (183, 130-260) |
0.202 |
| Mitral E/A | 1.14 ±0.46 (1.05, 0.50-2.50) |
1.40 ± 0.40 (1.41, 0.70-2.80) |
0.015 |
| LV end-diastolic volume (ml) | 65 ± 26 (63, 14-135) |
75 ± 25 (70, 40-164) |
0.078 |
| LV end-diastolic volume index (ml/m2) | 35 ± 13 (33, 8-62) |
43 ± 12 (42, 25-75) |
0.001 |
| LV end-systolic volume (ml) | 21 ± 11 (21, 3-50) |
28 ± 12 (27, 10-75) |
0.009 |
| LV end-systolic volume index (ml/m2) | 11 ± 5 (11, 2-23) |
16 ± 6 (16, 6-39) |
<0.001 |
| Stroke Volume (ml) | 44 ± 18 (41, 8 –85) |
47 ± 18 (44, 22-124) |
0.440 |
| Heart Rate (beat/min) | 77 ± 14 (79,47 –112) |
70 ± 9 (70, 48-91) |
0.003 |
BP, blood pressure; LV left ventricular; PH; pulmonary hypertension; RV, right ventricular.
I. Relationship between Estimated Pulmonary Artery Systolic Pressure and Biventricular Function
Estimated Pulmonary Artery Systolic Pressure vs. Biventricular Longitudinal Strain
Patients with PH had significantly reduced (lower absolute values) RV LAT LS (-15.9 ± 7.6 % vs. -25.5 ± 6.1 %, p <0.001) and IVS LS (-17.3 ± 4.4% vs.-20.2 ± 3.9%, p=0.002) compared to those in controls, while LV LAT LS was similar between patients with PH and controls (-18.0 ± 5.2% vs.-19.4 ± 3.4%, p=0.24), Table 2. Regression analysis (Fig 1A, 1B, and 1C) showed that, after combining patients and controls, the correlation between estimated peak PASP and strains was stronger for RV LAT LS (r =0.56, p <0.001) than for IVS LS (r=0.32, p=0.007 vs. RV LAT LS), and lower still for LV LAT LS (r=0.06, p=0.027 vs. IVS LS). After adjusting for estimated peak PASP as a covariate (Table 2), differences between controls and patients were not significant anymore, indicating that the differences between two groups in longitudinal strains were due primarily to the presence of PH.
Table 2. Right and Left Ventricular LS, LV CS, and LV Torsion in Patients with PH vs. Controls.
| Unadjusted | Adjusted for PASP | Adjusted for LV Eccentricity Index | |
|---|---|---|---|
| Longitudinal Strain (%) | |||
|
|||
| PH | -15.9 ± 7.6* | -19.2 ± 1.3 | -17.1 ± 1.1* |
| Controls | -25.5 ± 6.1 | -21.9 ± 1.6 | -24.0 ± 1.1 |
|
|||
| PH | -17.3 ± 4.4* | -18.0 ± 0.8 | -18.1 ±0.6 |
| Control | -20.4 ±3.9 | -19.6 ±1.0 | -19.5 ± 0.6 |
|
|||
| PH | -18.0 ± 5.2 | -17.3 ± 0.9 | -18.1 ± 0.7 |
| Controls | -19.4 ± 3.4 | -20.6 ± 1.1 | -19.4 ±0.7 |
| Circumferential Strain (%) | |||
|
|||
| PH | -17.6±5.8* | -19.8 ± 1.0 | -17.9 ± 0.8* |
| Controls | -23.1±4.9 | -19.5 ± 1.2 | -22.7 ± 0.8 |
|
|||
| PH | -11.5 ±5.1† | -11.7 ± 1.2 | -11.3 ± 0.9† |
| Controls | -15.5 ± 6.4 | -15.4 ± 1.4 | -15.7 ± 0.9 |
| LV Torsion (degree) | |||
| PH | 9.6 ± 4.9 * | 9.9 ± 1.1† | 9.4 ± 0.8* |
| Controls | 14.7 ± 4.9 | 14.7 ± 1.2 | 14.9 ± 0.8 |
| LV Untwist E Rate (degree/s) | |||
| PH | -90.2 ± 46.3 | -87.6 ± 10.8 | -88.7 ± 7.1 |
| Controls | -91.1 ± 41.0 | -95.7 ± 9.4 | -92.5 ± 6.8 |
Figure 1. Regression Analysis of RV and LV Longitudinal Strain vs. Estimated Pulmonary Systolic Pressures and LV Eccentricity Index.
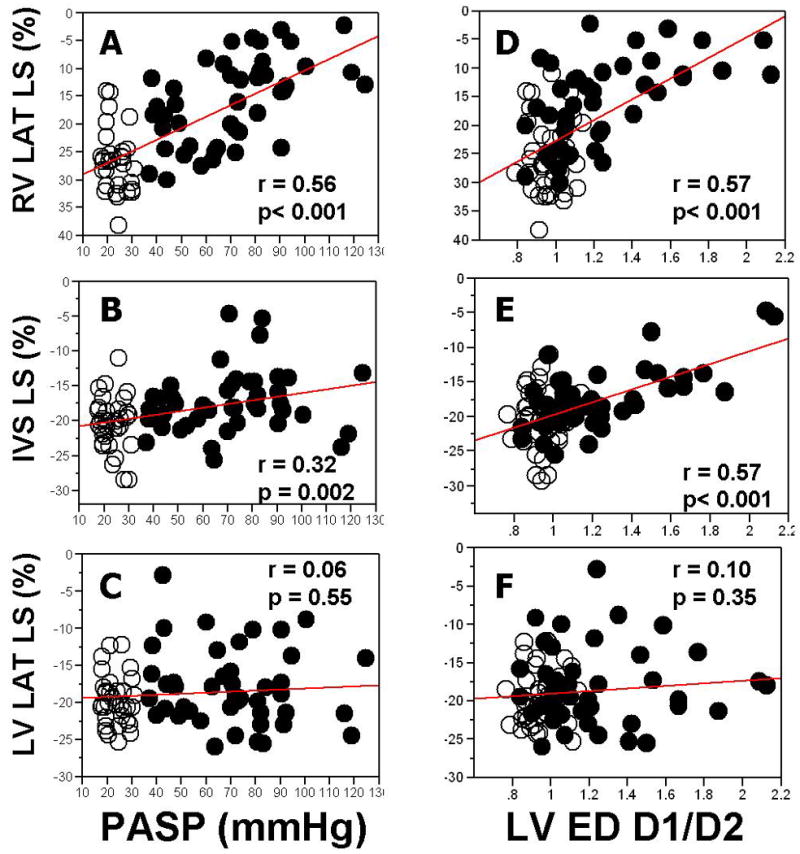
RV LAT LS, right ventricular lateral wall longitudinal strain; IVS LS, interventricular septal longitudinal strain; LV LAT LS, left ventricular lateral wall longitudinal strain; PASP, estimated pulmonary artery systolic pressure; LVED D1/D2, left ventricular end-diastolic eccentricity index. Closed circles, PH patients; open circles, controls.
Estimated Pulmonary Artery Systolic Pressure vs. LV Circumferential Strain
Patients with PH had significantly reduced both IVS CS (-17.6±5.8% vs.-23.1±4.87%, p < 0.001) and LV LAT CS (-11.9±5.0% vs. -14.5± 6.1%, p=0.002), Table 2. Regression analysis (Fig 2A, 2B) showed that, after combining patients and controls, correlation between estimated peak PASP and circumferential strains was stronger with IVS CS (r=0.60, p <0.001) than with LV LAT CS (r=0.28, p<0.001 vs. IVS CS). After adjusting for estimated peak PASP as a covariate, differences between groups disappeared for both IVS CS (p=0.90) and LV LAT CS (p=0.09), again indicating that the differences between two groups in circumferential strains are due primarily to presence of PH.
Figure 2. Regression Analysis of LV Circumferential Strain vs. Estimated Pulmonary Systolic Pressures and LV Eccentricity Index.
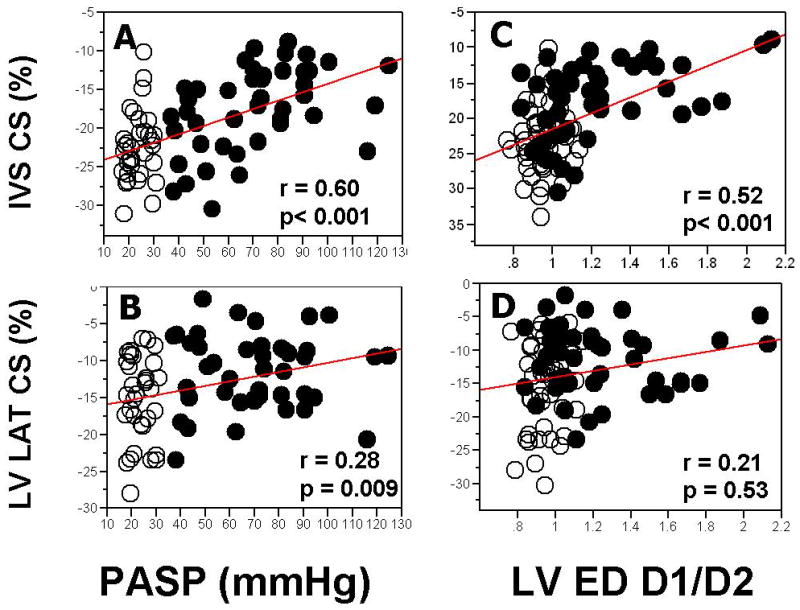
CS denotes circumferential strain. See abbreviation in Figure 1
Estimated Pulmonary Artery Systolic Pressure vs. LV Torsion
Finally, torsion was also significantly decreased in patients with PH compared to those in controls (9.6 ± 4.9° vs. 14.7 ± 4.9°, p < 0.001), and showed a moderately strong correlation with estimated peak PASP (r=- 0.39, p <0.001), Fig 3. However, even after adjusting for estimated peak PASP as a covariate, patients with PH had significantly lower torsion (p=0.008). LV untwisting rates were similar in both groups (-90.2 ± 46.3 °/s vs. -91.1 ± 41.0 °/s, p=0.72), and show poor correlation with PASP (r=-0.10, p=0.40), even after adjusting for peak PASP as a covariate.
Figure 3. Regression Analysis of LV Torsion vs. Estimated Pulmonary Systolic Pressures and LV Eccentricity Index.
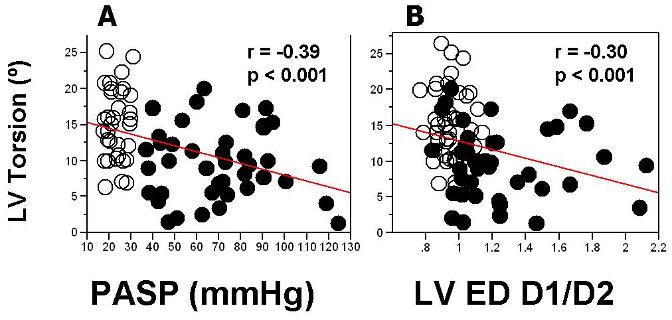
See abbreviation in Figure 1
II. Relationship between Estimated Pulmonary Artery Systolic Pressure vs. LV Diastolic Geometry
Patients with PH had significantly increased LV diastolic eccentricity index compared to those in controls (1.24±0.32 vs.0.96±0.09, p < 0.0001), Table 2. There was a moderately strong correlation between estimated peak PASP and LV diastolic eccentricity (r=0.63, p <0.0001).
III. Relationship between LV Diastolic Geometry vs. LV Function
LV Diastolic Geometry vs. LV Longitudinal Strain
Regression analysis (Fig 1 E-F) showed that, after combining patients and controls, the correlation between LV diastolic eccentricity index and longitudinal strains was stronger with IVS LS (r=0.57, p<0.0001) than with LV LAT LS (r=0.10, p< 0.0001 vs. IVS LS).
LV Diastolic Geometry vs. LV Circumferential Strain
Regression analysis (Fig 2 C-D) showed that, after combining patients and controls, correlation between diastolic eccentricity index and circumferential strains was stronger with IVS CS (r=0.52, p <0.0001) than with LV LAT CS (r=0.21, p=0.0024 vs. IVS CS). After adjusting for LV diastolic eccentricity index as a covariate, differences between groups persisted for IVS CS (p=0.0001) but not LV LAT CS (p=0.09).
LV Diastolic Geometry vs. LV Torsion
Torsion showed a weak inverse correlation with LV diastolic eccentricity (r=-0.30, p=0.006), Fig 3. Adjusting for LV diastolic eccentricity index did not eliminate effect of PH diagnosis on LV torsion (p=0.0004). LV untwisting showed poor correlation with LV diastolic eccentricity index (r=-0.08, p=0.5), even after adjusting peak LV diastolic eccentricity index as a covariate.
Discussion
The major findings of our study are: 1) RV free wall and IVS longitudinal strains were significantly reduced in patients with PH while LV lateral wall longitudinal strain was preserved; 2) IVS and LV lateral wall circumferential, but not longitudinal, strain were both significantly reduced in patients with PH, but the magnitude of reduction was greater with IVS circumferential strain; and 3) LV systolic torsion was significantly reduced in patients with PH whereas LV early untwisting rate was similar in both groups.
Chronic RV Pressure Overload and RV Longitudinal Deformation
Unlike the LV, the RV does not tolerate systemic arterial pressures due to its thinner wall and higher compliance8. Chronic RV pressure overload leads to a gradual change in RV sarcomeres and myocytes resulting in structural and functional deterioration17. In our study, we demonstrated that in patients with chronic PH RV longitudinal deformation is significantly reduced in magnitude in comparison with controls. Furthermore, we demonstrated that the severity of PH significantly correlates with the degree of RV strain reduction. These findings agree with the previous report by Pirat and colleagues18 who showed impaired RV peak systolic strain (assessed by Velocity Vector Imaging) in 58 patients with PH vs. 19 controls. Similar to our study, they found that the PASP estimated by TR Doppler velocities was the best predictor of RV strain (r=0.61, p <0.05). Prior to the development of STE, several investigators19-21 have previously used tissue Doppler imaging (TDI) to demonstrate reduced RV strain in patients with PH. Although TDI has significant limitations due to angle dependency, noise, and tethering, the major findings of those studies accord with the present study. They also reported that RV LAT LS was significantly reduced in PH patients and correlated with pulmonary systolic pressures. Notably, our study further analyzed the data by adjusting longitudinal strains using estimated PASP as a covariate. Once adjusted for PASP, the differences between controls and patients were no longer significant, suggesting that the differences in RV LAT LS between two groups are predominantly due to the presence of PH.
Chronic RV Pressure Overload and Biventricular Geometric Alteration
Under normal conditions, the RV forms a crescent wrapped around the LV8. In the milieu of PH, the RV is characterized by increased end-diastolic area and volume, a change of geometry to more spherical conformation, and varying degree of RV hypertrophy3,17,22. We have confirmed that PH not only impairs RV function but also alters RV geometry. In our study, RV area and RV free wall thickness were significantly increased in patients with PH. Previous studies 3,17 have reported that marked RV dilatation, increased RV pressures, and increased transseptal pressure gradient cause bowing of the IVS towards the LV due to anatomic contiguity of the two ventricles with a shared IVS within the restricted intrapericardial space, known as ventricular interdependence. As a result, septal and LV geometry is distorted by a decreased septal-free wall dimension and, conversely, increased anterior-posterior dimension4,17. The elevated LV end-diastolic eccentricity index, more D-shaped LV, in our PH group confirms the findings of Raymond et al3 and Manzel et al23 who also reported increased LV end-diastolic eccentricity index in patients with PH. In our study, we found that LV end-systolic volume significantly decreased in PH group as well. Previous studies3,4,17,22,23 supported the theory that encroachment on the LV by the IVS could impair LV filling, if the increase in D1 was a result of leftward septal displacement. It was clearly shown that the remodeling in RV geometry and wall thickness, septal configuration, and LV geometry, hence volume, accompany the increase in RV pressure load.
Pulmonary Systolic Pressures and Geometric Alteration vs. LV Function
Left Ventricular Longitudinal Deformation
In the present study, IVS LS was significantly reduced in patients with PH compared to that in controls, while LV LAT LS was maintained, findings concordant with those of Lopez-Candales and colleagues20. They assessed longitudinal strains of RV LAT, IVS, and LV LAT wall by TDI technique in patients with PH and controls, showing that LV LAT LS was similar between PH group and controls whereas RV LAT and IVS longitudinal strains were significantly impaired in patients with PH. Similarly, Hues et al19 studied LS by TDI technique in 18 patients with PH and 14 controls, showing LV LAT LS to be preserved. However, in contrast to our and Lopez-Candales' studies, the IVS LS was not reduced in their PH group.
In our study, we demonstrated the reduction in IVS LS to correlate significantly with both PASP as well as the LV diastolic eccentricity index. This implies a close relationship between septal geometry and IVS LS. Moon et al2 elegantly demonstrated that septal configuration changes, including leftward shift, flattening and thickening, can cause abnormal septal function and reduced septal output in the setting of reduced septal/LV preload. Their results support the idea that septal functional alteration is closely linked with septal geometric alteration, and vice versa. In our cohorts, we found that the differences in IVS LS between the two groups are mainly due to PH and altered LV geometry and not a primary abnormality of septal contractility. Strain represents a part of the stress-strain relationships, which define myocardial contractility13,24-26. Thus, strain can be decreased even in the setting of normal contractility if regional or global stress (i.e. afterload) is elevated. This is even more pronounced in the setting of RV circulation, which is especially sensitive to afterload elevation13,25,26.
LV Circumferential Deformation
In contrast to longitudinal deformation, both IVS and LV LAT CS were reduced in PH patients. However, the correlation between estimated PASP and CS was significantly stronger for the IVS than the LV LAT. This supports the findings that PH influences the septum more than the lateral LV wall. The mechanism of impaired LV LAT CS, but preserved LV LAT LS, was unclear. A potential explanation could be that reverse septal curvature and more D-shaped LV in patients with PH affects circumferential more than longitudinal myocardial fiber shortening. Wang et al27 demonstrated that CS was preserved while LS was impaired in patients with diastolic heart failure. This implies that LS and CS do not necessarily vary in parallel. It also is reasonable that abnormalities in circumferential fiber function could propagate farther from the septum than longitudinal fibers. Nevertheless, previous studies have shown that longitudinal rather than circumferential shortening plays a major contribution of global LV systolic performance28. Similar to estimated PASP, the correlation between LV diastolic eccentricity index and circumferential strains was also stronger with IVS than with LV LAT. However, after adjusting for LV diastolic eccentricity as a covariate, differences between groups persisted for septal circumferential but not lateral circumferential strains.
LV Torsion and Untwisting Rate
It is well established that LV torsion is sensitive to changes in both regional and global LV dysfunction13,26. However, our study has shown that LV torsion is significantly decreased in patients with chronic RV pressure overload, with moderate correlation to estimated PASP. However, significantly lower LV torsion persisted in patients with PH even after adjusting for estimated PASP and LV geometry as covariates. This may reflect decreased global preload present in the setting of PH. Supporting this postulate, Tji-Joong Gan et al29 showed that LV filling rate measured by cardiac MRI was significantly decreased in patients with PH compared with controls. Further, they found that the LV filling rate correlated significantly and inversely with leftward IVS curvature, confirming reduced LV preload in PH patients. The authors also concluded that the underfilled LV in the setting of PH could be due to either a decrease in RV output or a leftward displacement of IVS. Previous studies have investigated the hemodynamic determinants of LV torsion. Dong et al30 demonstrated that preload, afterload, and contractility were predictors of LV torsion on multiple regression analysis. Furthermore, Gibbons et al31 studied the effect of preload, afterload, contractility, and heart rate on apical rotation. In their model, preload was a major determinant of apical rotation. In our study, we found that LV end-systolic and end-diastolic volume indexes were significantly lower in PH group compared with those in controls, suggesting reduced preload in patients with PH. These supported that reduced LV preload in patients with PH may contribute to a significant reduction in LV torsion.
In addition to preload reduction, the interaction between myocardial fiber traction and RV dilation can be an additional potential explanation for reduced systolic torsion in PH group. It is known that subendocardial fibers form a right-handed helix whereas subepicardial fibers form a left-handed helix25. Under normal physiologic circumstances, epicardial traction dominates over endocardial movement during systole 25,31. Furthermore, there is evidence for a continuum of subepicardial RV muscle angles along the LV to the region of fibrous trigone25. These suggest that if this balance of fiber rotation, especially in septum, is altered and compressed by RV dilation in the setting of PH, LV twist pattern might be affected. Thus, we believe that septal bowing and non-circular LV configuration may impact LV torque resulting in a reduction in LV torsion in PH patients.
LV untwisting rate provides additional noninvasive insight into LV elastic recoil and diastolic suction13. Wang et al 24 demonstrated that LV untwisting rate was affected by loading conditions. In their animal study, inferior vena caval occlusion led to a significant decrease in LV end-systolic volume and a significant increase in LV untwisting rate. Furthermore, LV untwisting rate inversely correlated with LV end-systolic volume, to compensate LV filling. In our study, we found that LV untwisting rates were similar between PH and control groups. The possible explanation for a lack of reduction in untwisting velocity in PH group was most likely that early diastolic suction in the setting of reduced LV end-systolic volume in PH group may be exaggerated, to compensate LV filling.
Study Limitations
Simultaneous invasive pulmonary pressure and vascular resistance measurements were not performed in patients with PH. However, Doppler interrogation of TR to estimate peak PASP has been validated and widely accepted, and although it has some limitations, its widespread use suggests it remains the best noninvasive measure available6,7. We also excluded patients with severe TR when modified Bernoulli's method was used. Another limitation of the study is the heterogeneous nature of the PH group: they reflected a variety of etiologies and concurrent PH therapy which may have affected the PASP and loading conditions of the ventricles. We did not exclude the potential confounding effects of RV volume overload caused by TR and pulmonic regurgitation on LV geometry and function. Among 44 patients with PH, 20, 10, 13, and 1 patient had no, mild (1+), moderate (2+), and severe TR (3-4+), respectively. Furthermore, none of our patients had severe (3-4+) PR. The contribution of RV volume overload cannot be excluded. Furthermore, as RV geometry is quite complex, RV LAT LS might not optimally reflect overall RV function. Lastly, we showed that difference in regional systolic function between groups can be, to a large degree, statistically accounted for by the variability of LV diastolic geometry. However, as we used regression analysis technique, this cannot be taken as a proof of causality. Still, one can safely assume that PASP plays a critical role in the altered LV geometry. Furthermore, LV geometry in diastole temporally precedes, and functionally affects subsequent systolic strains of the IVS and lateral wall (the last assumption based on Starling's law of the heart), making the relationship between regional geometry and function quite probable.
Conclusions
In patients with PH, chronic RV pressure overload directly affects RV systolic function as manifested by impaired RV longitudinal deformation. RV pressure overload further influences IVS and LV geometry, which detrimentally impairs LV longitudinal and circumferential systolic deformation, more in the septum than more remote walls, and results in a decrease in LV torsion.
Acknowledgments
Sources of Funding: Supported in part by NIH grant HL60917 (SCE), National Space Biomedical Research Institute through NASA NCC 9-58 (JDT), and National Institute of Health, National Center for Research Resources, CTSA (UL1-RR024989), Cleveland, OH
Footnotes
Disclosures: none.
A short commentary of potential clinical impact: Due to ventricular interdependence, analysis of concomitant intrinsic LV diseases (i.e., myocardial fibrosis) in patients with significant PH is challenging. The farther a region is from the RV (e.g., the lateral wall), the less the impact that the PH will have on LV strain. Furthermore, parameters based on circumferential fibers appear to propagate farther from the RV than longitudinal parameters, likely reflecting continuity of the circumferential fibers from the septum to the lateral wall. Accordingly, a finding of abnormal LV lateral wall LS in patients with PH might identify true LV dysfunction that is independent of PH. We further demonstrated that LV torsion correlated negatively with estimated PASP as well as with septal flattening. Abnormally reduced LV torsion in PH could represent an advanced stage of PH and geometric alteration. Interestingly, although torsion was reduced, untwisting velocity was similar regardless of PASP. This may reflect the known association of rapid untwisting with reduced LVESV, a likely compensatory mechanism to maintain filling in the presence of reduced preload and/or exercise. Further study defining the relationship between LV torsion and untwisting with clinical outcomes and evaluating the effect of PH therapy on LV torsion is needed.
References
- 1.Williams JF, Jr, Childress RH, Boyd DL, Higgs LM, Behnke RH. Left ventricular function in patients with chronic obstructive pulmonary disease. J Clin Invest. 1968;47:1143–53. doi: 10.1172/JCI105803. [DOI] [PMC free article] [PubMed] [Google Scholar]
- 2.Moon MR, Bolger AF, DeAnda A, Komeda M, Daughters GT, 2nd, Nikolic SD, Miller DC, Ingels NB., Jr Septal function during left ventricular unloading. Circulation. 1997;95:1320–7. doi: 10.1161/01.cir.95.5.1320. [DOI] [PubMed] [Google Scholar]
- 3.Raymond RJ, Hinderliter AL, Willis PW, Ralph D, Caldwell EJ, Williams W, Ettinger NA, Hill NS, Summer WR, de Boisblanc B, Schwartz T, Koch G, Clayton LM, Jobsis MM, Crow JW, Long W. Echocardiographic predictors of adverse outcomes in primary pulmonary hypertension. J Am Coll Cardiol. 2002;39:1214–9. doi: 10.1016/s0735-1097(02)01744-8. [DOI] [PubMed] [Google Scholar]
- 4.Stojnic BB, Brecker SJ, Xiao HB, Helmy SM, Mbaissouroum M, Gibson DG. Left ventricular filling characteristics in pulmonary hypertension: a new mode of ventricular interaction. Br Heart J. 1992;68:16–20. doi: 10.1136/hrt.68.7.16. [DOI] [PMC free article] [PubMed] [Google Scholar]
- 5.Simonneau G, Galie N, Rubin LJ, Langleben D, Seeger W, Domenighetti G, Gibbs S, Lebrec D, Speich R, Beghetti M, Rich S, Fishman A. Clinical classification of pulmonary hypertension. J Am Coll Cardiol. 2004;43:5S–12S. doi: 10.1016/j.jacc.2004.02.037. [DOI] [PubMed] [Google Scholar]
- 6.Currie PJ, Seward JB, Chan KL, Fyfe DA, Hagler DJ, Mair DD, Reeder GS, Nishimura RA, Tajik AJ. Continuous wave Doppler determination of right ventricular pressure: a simultaneous Doppler-catheterization study in 127 patients. J Am Coll Cardiol. 1985;6:750–6. doi: 10.1016/s0735-1097(85)80477-0. [DOI] [PubMed] [Google Scholar]
- 7.Kircher BJ, Himelman RB, Schiller NB. Noninvasive estimation of right atrial pressure from the inspiratory collapse of the inferior vena cava. Am J Cardiol. 1990;66:493–6. doi: 10.1016/0002-9149(90)90711-9. [DOI] [PubMed] [Google Scholar]
- 8.Kosiborod M, Wackers FJ. Assessment of right ventricular morphology and function. Semin Respir Crit Care Med. 2003;24:245–62. doi: 10.1055/s-2003-41106. [DOI] [PubMed] [Google Scholar]
- 9.Lang RM, Bierig M, Devereux RB, Flachskampf FA, Foster E, Pellikka PA, Picard MH, Roman MJ, Seward J, Shanewise JS, Solomon SD, Spencer KT, Sutton MS, Stewart WJ. Recommendations for chamber quantification: a report from the American Society of Echocardiography's Guidelines and Standards Committee and the Chamber Quantification Writing Group, developed in conjunction with the European Association of Echocardiography, a branch of the European Society of Cardiology. J Am Soc Echocardiogr. 2005;18:1440–63. doi: 10.1016/j.echo.2005.10.005. [DOI] [PubMed] [Google Scholar]
- 10.Miller D, Farah MG, Liner A, Fox K, Schluchter M, Hoit BD. The relation between quantitative right ventricular ejection fraction and indices of tricuspid annular motion and myocardial performance. J Am Soc Echocardiogr. 2004;17:443–7. doi: 10.1016/j.echo.2004.01.010. [DOI] [PubMed] [Google Scholar]
- 11.Graham TP, Jr, Atwood GF, Faulkner SL, Nelson JH. Right atrial volume measurements from biplane cineangiocardiography. Methodology, normal values, and alterations with pressure or volume overload. Circulation. 1974;49:709–16. doi: 10.1161/01.cir.49.4.709. [DOI] [PubMed] [Google Scholar]
- 12.Ryan T, Petrovic O, Dillon JC, Feigenbaum H, Conley MJ, Armstrong WF. An echocardiographic index for separation of right ventricular volume and pressure overload. J Am Coll Cardiol. 1985;5:918–27. doi: 10.1016/s0735-1097(85)80433-2. [DOI] [PubMed] [Google Scholar]
- 13.Helle-Valle T, Crosby J, Edvardsen T, Lyseggen E, Amundsen BH, Smith HJ, Rosen BD, Lima JA, Torp H, Ihlen H, Smiseth OA. New noninvasive method for assessment of left ventricular rotation: speckle tracking echocardiography. Circulation. 2005;112:3149–56. doi: 10.1161/CIRCULATIONAHA.104.531558. [DOI] [PubMed] [Google Scholar]
- 14.Leitman M, Lysyansky P, Sidenko S, Shir V, Peleg E, Binenbaum M, Kaluski E, Krakover R, Vered Z. Two-dimensional strain-a novel software for real-time quantitative echocardiographic assessment of myocardial function. J Am Soc Echocardiogr. 2004;17:1021–9. doi: 10.1016/j.echo.2004.06.019. [DOI] [PubMed] [Google Scholar]
- 15.Notomi Y, Setser RM, Shiota T, Martin-Miklovic MG, Weaver JA, Popovic ZB, Yamada H, Greenberg NL, White RD, Thomas JD. Assessment of left ventricular torsional deformation by Doppler tissue imaging: validation study with tagged magnetic resonance imaging. Circulation. 2005;111:1141–7. doi: 10.1161/01.CIR.0000157151.10971.98. [DOI] [PubMed] [Google Scholar]
- 16.Uitenbroek DG. Corre. SISA-correlations. [August 11, 2009];1997 available from: http://www.quantitativeskills.com/sisa/statistics/correl.htm.
- 17.Bristow MR, Zisman LS, Lowes BD, Abraham WT, Badesch DB, Groves BM, Voelkel NF, Lynch DM, Quaife RA. The pressure-overloaded right ventricle in pulmonary hypertension. Chest. 1998;114:101S–106S. doi: 10.1378/chest.114.1_supplement.101s. [DOI] [PubMed] [Google Scholar]
- 18.Pirat B, McCulloch ML, Zoghbi WA. Evaluation of global and regional right ventricular systolic function in patients with pulmonary hypertension using a novel speckle tracking method. Am J Cardiol. 2006;98:699–704. doi: 10.1016/j.amjcard.2006.03.056. [DOI] [PubMed] [Google Scholar]
- 19.Huez S, Vachiery JL, Unger P, Brimioulle S, Naeije R. Tissue Doppler imaging evaluation of cardiac adaptation to severe pulmonary hypertension. Am J Cardiol. 2007;100:1473–8. doi: 10.1016/j.amjcard.2007.06.047. [DOI] [PubMed] [Google Scholar]
- 20.Lopez-Candales A, Dohi K, Bazaz R, Edelman K. Relation of right ventricular free wall mechanical delay to right ventricular dysfunction as determined by tissue Doppler imaging. Am J Cardiol. 2005;96:602–6. doi: 10.1016/j.amjcard.2005.04.028. [DOI] [PubMed] [Google Scholar]
- 21.Lopez-Candales A, Rajagopalan N, Dohi K, Gulyasy B, Edelman K, Bazaz R. Abnormal right ventricular myocardial strain generation in mild pulmonary hypertension. Echocardiography. 2007;24:615–22. doi: 10.1111/j.1540-8175.2007.00439.x. [DOI] [PubMed] [Google Scholar]
- 22.Olivari MT, Fiorentini C, Polese A, Guazzi MD. Pulmonary hemodynamics and right ventricular function in hypertension. Circulation. 1978;57:1185–90. doi: 10.1161/01.cir.57.6.1185. [DOI] [PubMed] [Google Scholar]
- 23.Menzel T, Wagner S, Kramm T, Mohr-Kahaly S, Mayer E, Braeuninger S, Meyer J. Pathophysiology of impaired right and left ventricular function in chronic embolic pulmonary hypertension: changes after pulmonary thromboendarterectomy. Chest. 2000;118:897–903. doi: 10.1378/chest.118.4.897. [DOI] [PubMed] [Google Scholar]
- 24.Wang J, Khoury DS, Yue Y, Torre-Amione G, Nagueh SF. Left ventricular untwisting rate by speckle tracking echocardiography. Circulation. 2007;116:2580–6. doi: 10.1161/CIRCULATIONAHA.107.706770. [DOI] [PubMed] [Google Scholar]
- 25.Taccardi B, Lux RL, Ershler PR, MacLeod R, Dustman TJ, Ingebrigtsen N. Anatomical architecture and electrical activity of the heart. Acta Cardiol. 1997;52:91–105. [PubMed] [Google Scholar]
- 26.Sengupta PP, Khandheria BK, Narula J. Twist and untwist mechanics of the left ventricle. Heart Fail Clin. 2008;4:315–24. doi: 10.1016/j.hfc.2008.03.001. [DOI] [PubMed] [Google Scholar]
- 27.Wang J, Khoury DS, Yue Y, Torre-Amione G, Nagueh SF. Preserved left ventricular twist and circumferential deformation, but depressed longitudinal and radial deformation in patients with diastolic heart failure. Eur Heart J. 2008;29:1283–9. doi: 10.1093/eurheartj/ehn141. [DOI] [PubMed] [Google Scholar]
- 28.Simonson JS, Schiller NB. Descent of the base of the left ventricle: an echocardiographic index of left ventricular function. J Am Soc Echocardiogr. 1989;2:25–35. doi: 10.1016/s0894-7317(89)80026-4. [DOI] [PubMed] [Google Scholar]
- 29.Gan CT, Lankhaar JW, Marcus JT, Westerhof N, Marques KM, Bronzwaer JG, Boonstra A, Postmus PE, Vonk-Noordegraaf A. Impaired left ventricular filling due to right-to-left ventricular interaction in patients with pulmonary arterial hypertension. Am J Physiol Heart Circ Physiol. 2006;290:H1528–33. doi: 10.1152/ajpheart.01031.2005. [DOI] [PubMed] [Google Scholar]
- 30.Dong SJ, Hees PS, Huang WM, Buffer SA, Jr, Weiss JL, Shapiro EP. Independent effects of preload, afterload, and contractility on left ventricular torsion. Am J Physiol. 1999;277:H1053–60. doi: 10.1152/ajpheart.1999.277.3.H1053. [DOI] [PubMed] [Google Scholar]
- 31.Gibbons Kroeker CA, Tyberg JV, Beyar R. Effects of load manipulations, heart rate, and contractility on left ventricular apical rotation. An experimental study in anesthetized dogs Circulation. 1995;92:130–41. doi: 10.1161/01.cir.92.1.130. [DOI] [PubMed] [Google Scholar]