

Abstract
Neuroimaging studies suggest that a fronto-parietal network is activated when we expect visual information to appear at a specific spatial location. Here we examined whether a similar network is involved for auditory stimuli. We used sparse fMRI to infer brain activation while participants performed analogous visual and auditory tasks. On some trials, participants were asked to discriminate the elevation of a peripheral target. On other trials, participants made a nonspatial judgment. We contrasted trials where the participants expected a peripheral spatial target to those where they were cued to expect a central target. Crucially, our statistical analyses were based on trials where stimuli were anticipated but not presented, allowing us to directly infer perceptual orienting independent of perceptual processing. This is the first neuroimaging study to use an orthogonal-cuing paradigm (with cues predicting azimuth and responses involving elevation discrimination). This aspect of our paradigm is important, as behavioral cueing effects in audition are classically only observed when participants are asked to make spatial judgments. We observed similar fronto-parietal activation for both vision and audition. In a second experiment that controlled for stimulus properties and task difficulty, participants made spatial and temporal discriminations about musical instruments. We found that the pattern of brain activation for spatial selection of auditory stimuli was remarkably similar to what we found in our first experiment. Collectively, these results suggest that the neural mechanisms supporting spatial attention are largely similar across both visual and auditory modalities.
Introduction
Spatial attention helps us select relevant information from rich, noisy, and potentially overwhelming amounts of perceptual information. For example, people selectively listen to a single speaker in a cocktail party filled with many voices (Cherry, 1953). Although many influential theories of perceptual attention were driven by research in the auditory domain (Treisman, 1969; Broadbent, 1954), recent neuroimaging research has predominantly examined the visual modality. In the current study, our aim was to identify the brain regions involved with strategic (endogenous) audiospatial attention and to contrast these regions with those involved with visuospatial attention.
There is a clear functional benefit for the integration of spatial information across the senses. One modality can be used to orient another (e.g., we can hear sounds from behind our head, where we cannot see them), and we can combine information across modalities to respond to the appropriate location. Indeed, as signals that occur simultaneously in more than one modality are unlikely to be due to random noise, there is evidence that one sensorial input can alter the performance of another (McDonald & Ward, 2000). Illusions such as the McGurk effect, that is, seeing one spoken phoneme while listening to another phoneme leads to a third, intermediate, phoneme (McGurk & Macdonald, 1976), and ventriloquism effects (Driver, 1996) illustrate how cross-modal integration influences perception. Further evidence for the notion of a cross-modal attentional system comes from work with neurological patients. For example, patients experiencing spatial neglect following right hemisphere stroke tend to ignore stimuli on their left side. Generally, neglect patients tend to ignore both auditory and visual stimuli (Pavani, Ladavas, & Driver, 2002), hinting that some circuits may provide cross-modal spatial selection. Curiously, however, there are accounts of patients who do not show this pattern of deficits (Eramudugolla, Irvine, & Mattingley, 2007; Spierer, Meuli, & Clarke, 2007; Soto-Faraco & Spence, 2002). Work with auditory neglect suggests that patients can show selective deficits in an auditory “what” and “where” pathways, indicating functional heterogeneity within a single modality that may attribute to empirical differences between auditory and visual attention in some facets (Clarke & Thiran, 2004). These discrepancies highlight the need to study and to compare auditory and visual attention in higher detail.
Macaluso and Driver (2005) examined the integration of vision and touch and speculated that the parietal cortex and the frontal regions near the FEFs provide multisensory processing. This conclusion was based on neuroimaging and electrophysiological research conducted in both humans and monkeys. Eimer, van Velzen, and Driver (2004) review similar electrical scalp recordings in adults during anticipatory stages of visual, tactile, and auditory tasks, suggesting involvement of a supramodal attentional network (also see van der Lubbe, Neggers, Verleger, & Kenemans, 2006). Additional electrophysiology work has delineated how attention (Talsma, Doty, & Woldorff, 2007) and temporal synchrony (Senkowski, Talsma, Grigutsch, Herrmann, & Woldorff, 2007) influence multisensory integration in the cortex. Although the cortical involvement in multisensory integration is well documented, subcortical evidence of multisensory integration also comes from several single-unit studies (Perrault, Vaughan, Stein, & Wallace, 2003; Stein & Meredith, 1993). Specifically, Stein and Meredith (1993) have shown that superior colliculus is a major integrator of multisensory information. Collectively, these studies highlight the interest in studying multisensory integration; however, studies such as these could be refined if the mechanisms subserving unisensory auditory spatial attention were further elucidated.
Recent work has distinguished between different cognitive processes involved with spatial attention. For example, some have suggested that alerting, orienting, and reorienting are at least somewhat functionally and anatomically distinct (Fan, McCandliss, Fossella, Flombaum, & Posner, 2005; Thiel, Zilles, & Fink, 2004; Fan, McCandliss, Sommer, Raz, & Posner, 2002; Coull & Nobre, 1998). Alerting refers to a temporal expectancy, causing a phasic arousal when a target is expected. In contrast, orienting refers to the spatial preparation at the location of an expected target, whereas reorienting refers to an attentional response that occurs when one expects a target at the incorrect location. For the visual modality, it is likely that these functions preferentially recruit different brain circuits. For example, Thiel et al. (2004) suggest that extrastriate regions are particularly involved with alerting, orienting specifically recruits the anterior cingulate and reorienting causes the largest activation in the right temporal–parietal junction and the bilateral activation of the intraparietal sulci.
A further distinction has been drawn regarding whether spatial attention is reflexively “pulled” to a location or strategically “pushed” to a region of space. Specifically, attention is influenced by both top–down (endogenous) and bottom–up (exogenous) influences. For example, the strategic endogenously driven decision to look both ways before crossing a street can be contrasted with the rapid, reflexive, exogenously driven shift of attention that follows the sound of a car skidding around a corner. In general, there is a strong consensus that endogenous visual attention invokes a network including the FEFs and the posterior parietal cortex (PPC; Corbetta & Shulman, 2002; Hopfinger, Woldorff, Fletcher, & Mangun, 2001; Hopfinger, Buonocore, & Mangun, 2000; Kanwisher & Wojciulik, 2000; Corbetta, 1998; Corbetta et al., 1998; Mangun, Buonocore, Girelli, & Jha, 1998). In contrast, exogenous stimuli invoke more ventral areas of the fronto-parietal network (Corbetta & Shulman, 2002; Corbetta, Kincade, Ollinger, McAvoy, & Shulman, 2000). However, it remains unclear whether the same anatomical circuits are involved for audiospatial attention.
Our aim was to identify the brain areas involved with endogenous audiospatial orienting and contrast these regions to the activations detected in an analogous visual task. To do this, we conducted the first neuroimaging study of audiospatial attention using an orthogonal-cuing task with a sparse acquisition protocol. An important aspect of our design is the use of a spatial localization task. Curiously, nonspatial auditory tasks (e.g., target detection, pitch discrimination, intensity discrimination) do not generate robust behavioral-cuing effects, whereas auditory spatial tasks (e.g., judging elevation of target) are aided by a spatial cue (Spence & Driver, 1994). This is different than vision or touch, where people are faster responding to cued versus uncued items regardless of the nature of the task (e.g., detection, intensity, etc.). Spence and Driver (1994) argue that this reflects the fundamental properties of these modalities; the visual and the tactile receptor coding is intrinsically spatial, whereas the auditory system's coding is initially tonotopic. Therefore, to observe the network underlying auditory spatial attention, it may be crucial to ask the participant to make a spatial discrimination. Accordingly, our paradigm uses an orthogonal-cuing paradigm to orient auditory attention. The orthogonal-cuing method uses a cue that predicts the lateralization of the target (left or right), whereas the participant's task is to decide the elevation of the target (i.e., an up/down judgment), regardless of which side the target appears on (Driver & Spence, 1998). Because the cue predicts the target side but not the actual response, any observed changes cannot be simply due to motoric priming. Note that the orthogonal-cuing paradigm requires that the auditory stimuli must appear distinct in both azimuth and elevation. Unfortunately, the air-conduction headphones traditionally used in neuroimaging studies have relatively poor acoustic fidelity, making it difficult to generate stimuli that appear to differ in their elevation. We solved this problem by using high fidelity headphones with ceramic speakers.
A further novel aspect of our study was the use of sparse imaging during the attentional task. Unfortunately, the MRI scanner generates loud sounds while acquiring data—and these sounds can activate the brain's auditory system as well as masking other auditory stimuli. Because there is a delay between the brain activation and the hemodynamic signal measured during fMRI, it is possible to present a sound while the scanner is quiet and subsequently measure the hemodynamic response (Nebel et al., 2005; Hall et al., 1999). Specifically, a quiet temporal delay occurs after each three-dimensional image of the brain is acquired, and the perceptual task is conducted during the silent gap between acquisitions. Although sparse imaging necessarily means less data are acquired because of the silent gaps and longer repetition times (TRs), the ability to observe effects is quite comparable to continuously acquired data (Nebel et al., 2005).
Another important aspect of our paradigm is the inclusion of “catch” trials, where a participant was cued to expect a target that was never presented. This allows us to obtain a more “pure” measure of the orienting of attention, without contamination from the perceptual consequence of orienting. In fact, our entire statistical analysis only involves these catch trials, focusing on trials having expected spatial and nonspatial targets. In addition to separating cue- and target-related processes, this method offers an unbiased measure of attentional orienting because the temporal expectancy is similar across comparisons.
Our paradigm combined the use of an orthogonal-cuing design, sparse imaging, and statistical analysis of “catch” trials to identify brain areas involved with audiospatial attention. Specifically, we compared trials where participants were cued to make spatial judgments to laterally presented items to trials where the participant was anticipating a centrally presented target that required a nonspatial judgment. In both cases, central cues provided virtually identical perceptual stimulation and temporal predictability, with the only difference being the location and the type of target anticipated.
Experiment 1
Methods
Participants
Twenty-three participants (9 females; age range = 19–36 years, median = 21 years) were enrolled in this study. All participants had normal or corrected-to-normal vision, and none reported any history of hearing, neurological, or psychiatric problems. Those individuals with visual refractory errors wore MRI compatible glasses. Informed consent was obtained from all participants before enrollment. Although accurate identification of targets was not a primary concern, given the focus on cue-related effects and “catch” trials, participants that failed to follow directions on either task were excluded from the analyses. In total, data from six participants were excluded from the final analysis because of excessive head motion (>3 mm) or lack of task compliance, leaving 17 subjects for the neuroimaging analyses. Participants were given course credit and/or a CD with brain images.
Auditory Stimuli and Presentation
Auditory stimuli for the peripheral trials were created by recording noise samples at various locations in space using a recording manikin. A single 50-msec burst of white noise (50 Hz–20 kHz) was presented every 100 msec via a Roland MA-12 powered speaker. The speaker was positioned 45° left of the midline and 58 cm from the manikin's ear. One recording was made with the speaker fixed at 45° above the transverse plane intersecting the manikin's ear and another was made with the speaker 45° below the ear. The level at the ear was 90 decibels sound pressure level. The KEMAR recording manikin was fitted with Etymotic ER-11 microphones at the positions of the tympanic membranes and models of average human male pinna. The stereo output was recorded at 48 kHz sampling and 16-bit resolution using a desktop PC and Echo Gina 24 D/A converters and downsampled to 44 kHz for presentation. A single stimulus consisted of a 500-msec file having five complete noise bursts and five 50-msec silences following each burst. The right and the left channels of the stereo recording were reversed to create stimuli appearing right of midline. This procedure effectively created stimuli that were spatially consistent with appearing “left up,” “left down,” “right up,” and “right down.”
In addition to auditory targets that required spatial discriminations, we also included targets presented centrally that required a nonspatial discrimination of presentation rate. “Fast” auditory targets were created by recording five 50-msec noise bursts/silences with the speaker directly in front of the manikin and level with its ears. For the “slow” targets, the noise bursts/silences were 83.3 msec in duration, so the 500-msec stimulus contained three such bursts and following silences. This process effectively created stimuli appearing at high and low presentation rates directly in front of the participant.
Auditory stimuli were delivered during fMRI scanning using Serene Sound (Resonance Technologies, Northridge, CA) headphones, with stereo quality sound and passive scanner noise attenuation. Participants also wore flat frequency-response earplugs (ER20; Etymotic Research, Inc., Elk Grove Village, IL) to further attenuate scanner noise while preserving the integrity of auditory stimuli.
Experimental Design
The display background remained black throughout the study. A small white central fixation cross was visible throughout the study (subtending 1.25° vertically and horizontally). This was the only visual stimulus present during the first 2000 msec of each trial (during scanner acquisition). This fixation cross was followed by the cue, which lasted 500 msec. The cue appeared as a central diamond, composed of a left- and a right-facing triangle (2.5° tall and 1.2° wide). The color of these triangles denoted the type of trial. When both triangles were the same color (both red or both green), any subsequent target appeared centrally (central nonspatial trials). When the triangles were different in color (one green and one red), subsequent targets appeared peripherally (peripheral spatial trials). The cues always correctly predicted the upcoming task. For example, the central cue always preceded a central target, and the peripheral attention cues always correctly predicted the side of an upcoming target (e.g., a left peripheral target was always preceded by a left-facing green triangle). The cue and the target were separated by a delay between 500 and 1500 msec. The fixation cross was present during this delay. In the auditory session, the target lasted 500 msec; whereas targets lasted 100 msec in the visual session. Peripheral visual targets appeared as small blue squares (0.6°) presented at the top or at the bottom of the display (appearing 7.6° laterally and 4.4° vertically from fixation). Central visual targets appeared as small blue triangles on top of the fixation cross pointing up or down (these were 0.5° high and 1° wide). In both tasks, the time remaining after each target was variable but always yielded a total trial time of 7000 msec (compensating for the cue-target delay and keeping trials locked with the scanner's rate of acquisition). To separate cue- and target-related activity, targets did not follow all cues (for trial schematic, see Figure 1). Out of 112 trials, 48 (∼43%) were catch trials (i.e., trials without targets). Trial type was randomized across both visual and auditory tasks, with precisely half of the trials containing central cues and half containing peripheral cues.
Figure 1.
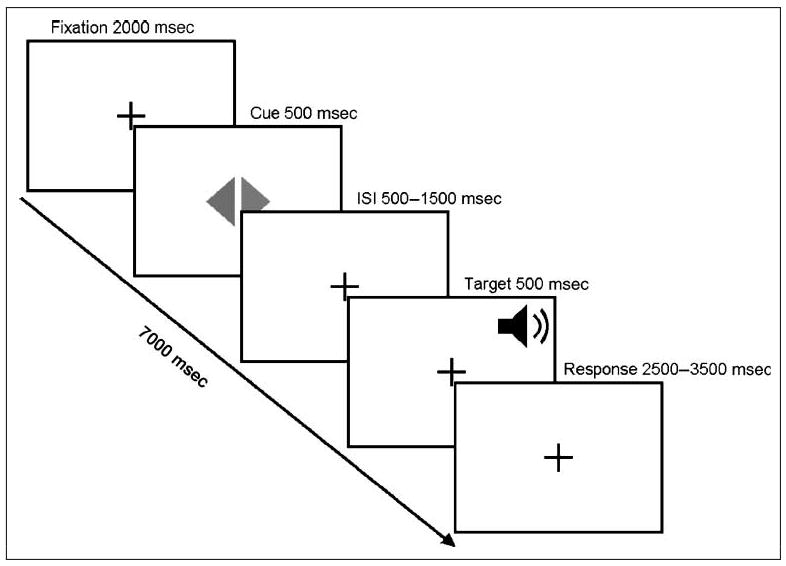
Schematic illustrating the sequence of events for a single trial. A central visual symbol was used to cue the trial type: two red or green triangles indicated a nonspatial target, whereas a green and a red triangle indicated a peripheral spatial target (on the side of the green triangle). The cue was followed by an ISI of variable duration, which was typically followed by a brief target. A response period followed the target, having a duration that compensated for the ISI so that the duration for each trial was precisely 7 sec. Note that both spatial and nonspatial cues were temporally predictive for an upcoming target, which followed 57% of all cues. Spatial targets were never presented on the uncued side (i.e., the spatial cues were always spatially valid). In one session, the targets were auditory stimuli (as shown, with a duration of 500 msec), whereas in a separate session, the targets were visual stimuli (with a duration of 100 msec, with the response period 400 msec longer than the illustrated auditory timeline).
Procedure
After the task was described, each participant listened to all the auditory stimuli and completed a short practice session. Participants were instructed to maintain fixation on the centered cross throughout the experiment. Their ability to comply with this requirement was evaluated during the prescanning practice session, which included eye tracking using a head-mounted ASL 210 system. For the experiment, participants underwent two approximately 13-min sessions of fMRI scanning. Because our focus was auditory spatial attention, all participants completed the auditory task before the visual task to prevent the use of any visual strategy on the auditory task. Participants rested in the scanner for 7 min between fMRI sessions. Participants were instructed to respond to all targets. Visual events were presented on the back of the scanner bore, and participants viewed this through a mirror place on top of the head coil. Responses were made using a fiber optic button response system (Psychology Software Tools, Inc., Pittsburgh, PA) glove placed on their right hand. For the visual targets and the peripheral auditory targets, participants were instructed to use their index finger to indicate “up” and their thumb to indicate “down.” “Fast” and “slow” central auditory targets were responded to using the index finger and thumb, respectively.
fMRI Acquisition and Analysis
Scanning was performed on a 3-T Siemens Trio scanner equipped with a 12-channel receiver coil. In both fMRI sessions, a total of 114 echo planar imaging (EPI) volumes with 33 axial slices were collected from each participant. We used a sparse sampling technique in both auditory and visual tasks for comparative purposes. The sparse sampling technique allowed the auditory stimuli to be delivered and processed without concomitant scanner noise. Parameters used during acquisition were as follows: TR = 7 sec; acquisition time = 2 sec; echo time = 30 msec; no parallel imaging acceleration, matrix = 64 × 64; bandwidth 2232 Hz/px, phase encoding in the anterior to posterior dimension, voxel dimensions 3.25 × 3.25 × 3.20 mm.
Within a general linear model, we used six regressors of interest that modeled the onset of the cues in “left catch,” “left target,” “right catch,” “right target,” “center catch,” and “center target” trial types. These were convolved with a single Gamma function. In addition, we used temporal derivatives of each of the six regressors of interests to assist in accounting for the temporal variability within the hemodynamic response across different brain regions. We included one nuisance variable orthogonalized to the rest of the model which accounted for the actual target onset and motoric response following some of the cues. To account for residual effects of motion, we also added six parameters (for translations and rotations in the x y z dimensions) as regressors of no interest. Our main contrast vector of interest compared our “right catch” and “left catch” parameters against our “center catch” parameter. This contrast vector highlights regions of significant activation associated with pure endogenous orienting. The same model and contrasts were used for both the auditory and the visual tasks.
Analysis was carried out using the fMRI expert analysis tool, part of the FMRIB's software library (www.fmrib.ox.ac.uk/fsl; Smith et al., 2004). The lower level analyses implemented motion correction using the motion correction using FMRIB's linear image registration tool (Jenkinson, Bannister, Brady, & Smith, 2002); nonbrain removal using the brain extraction tool (Smith, 2002); spatial smoothing using a Gaussian kernel of FWHM 8 mm; mean-based intensity normalization of all volumes by the same factor; and high-pass temporal filtering (Gaussian-weighted LSF straight line fitting, with sigma = 50.0 sec). Time-series statistical analysis was carried out using FMRIB's improved linear model with local autocorrelation correction (Woolrich, Ripley, Brady, & Smith, 2001). Registration to the Montreal Neurological Institute (MNI) space was carried out using FMRIB's linear image registration tool (Jenkinson et al., 2002; Jenkinson & Smith, 2001). The cross-subject analysis used FMRIB's local analysis of mixed effects (Woolrich, Behrens, Beckmann, Jenkinson, & Smith, 2004; Beckmann, Jenkinson, & Smith, 2003). All statistical images were initially filtered using a threshold of z > 2.3, with the resulting clusters thresholded for p < .05 corrected for multiple comparisons across the whole brain using Gaussian random field theory (Worsley, 2001). MRIcron was used to display statistical maps on a standard brain template (Rorden, Karnath, & Bonilha, 2007). Anatomical labels for local maxima were obtained from the Talairach client (Lancaster et al., 2000). All coordinates in this article are reported in MNI space.
Results
Behavioral Performance
Participants generally found the auditory task to be more difficult than the visual task, as might be expected given the spatial nature of vision compared with audition. Average accuracy for the auditory task was 73.35% (SD = 6.68%), and average accuracy for the visual task was 96.96% (SD = 4.29%). Although these differences were significantly different within subjects, t(16) = −11.81, p < .001, it is important to note that our fMRI analyses are based on within-modality contrasts and on trials in which there was no target presented. This notwithstanding, within-modality accuracy and response time data for vision and audition suggest that our results cannot simply be attributed to one trial type being responded to differently than another trial type. Specifically, for the auditory task, participants were less accurate on trials that required a spatial (M = 55.70%, SD = 7.43%) discrimination in the periphery compared with trials that required a nonspatial (M = 90.99%, SD = 9.75%) discrimination in the center, t(16) = 13.18, p < .001. In sharp contrast, participants performing the analogous visual task were more accurate on peripheral spatial (M = 99.08%, SD = 1.84%) discriminations compared with central nonspatial (M = 94.85%, SD = 7.73%) discriminations, t(16) = −2.41, p < .05. A related pattern was observed for response times. Response times on the auditory task were slower for spatial (M = 697.68 msec, SD = 243.68 msec) compared with nonspatial (M = 536.06 msec, SD = 167.78 msec) trials, t(16) = −2.58, p < .05. In contrast, response times on the visual task were faster on peripheral spatial (M = 515.41 msec, SD = 80.88 msec) discriminations compared with central nonspatial (M = 563.61 msec, SD = 94.88 msec) discriminations, t(16) = 2.94, p < .01. Given this pattern of behavioral data and the fact that we only examine trials without targets in our neuroimaging data, we do not believe that any behavioral differences observed contribute to our neuroimaging findings.
Stimulus processing differed as a function of hemispace only in terms of accuracy in the auditory modality. Specifically, subjects were significantly better at discriminating stimuli in left hemispace (M = 59.57%, SD = 10.60%) compared with right hemispace (M = 51.84%, SD = 9.57%), t(16) = 2.33, p < .05. This result is consistent with past studies suggesting asymmetries of processing in the auditory modality (e.g., Ofek & Pratt, 2004).
Neuroimaging Results
To investigate the neural bases of auditory attention shifts, we examined cue-related effects attributable to attentional orienting. Specifically, we contrasted peripheral catch trials against central catch trials in hopes of isolating a measure of pure endogenous orienting. These trials have the same temporal expectancies but do not actually contain a target, which may contaminate measures of attentional orienting with target processing. This same analysis was also carried out in the visual task for comparative purposes.
As illustrated on the rendered brain in Figure 2A, endogenous orienting of auditory attention evoked brain activation across a fronto-parietal network. Table 1 delineates the related statistics for local maxima associated with auditory orienting. We observed significant bilateral activation in the PPC and the superior frontal activation near the FEFs. There was also significant activation in the SMA. Furthermore, we found evidence of preparatory biasing in the auditory cortex. These auditory results were similar to the results we obtained for the analogous vision task as can be seen on the rendered brain in Figure 2B and Table 2. Here, the main difference we observed was the extent of the activation seen in the fronto-parietal network as well as activation in the visual cortical areas, which is to be expected with preparatory biasing associated with an anticipated visual event.
Figure 2.
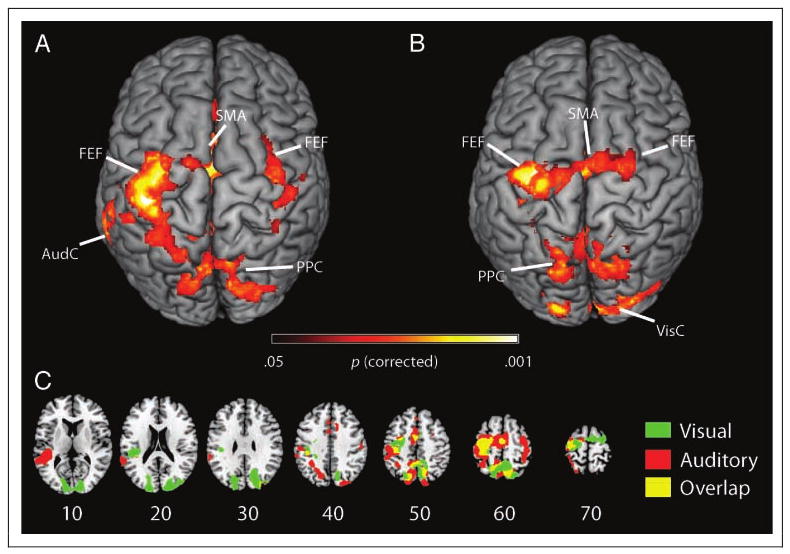
Auditory and visual attention evoke similar patterns of brain activation. (A) To examine the neural basis of audiospatial attention, we contrasted spatial cues and nonspatial cues in our auditory task. We found that regions of the FEFs, PPC, and SMA were significantly modulated by spatial cues. In addition, regions of the auditory cortex (AudC) are also activated for this contrast, possibly reflecting preparatory biasing in sensory cortices. This analysis is only based on “catch” trials where a target was anticipated but not presented. Therefore, these results offer a pure measure of orienting preparation, rather than combining the effects of orienting preparation with perceptual processing of targets. (B) We performed a similar analysis for our visual task. We found similar regions involved in visuospatial orienting. We also found that visual cortex (VisC) was activated in addition to the fronto-parietal attentional network, which presumably reflects preparatory biasing in sensory cortices. (C) To better illustrate the similar patterns of activation across auditory and visual domains, we plotted the statistical maps from both contrasts (auditory and vision) on the same background image. Shown in red are regions that were significantly activated for audiospatial attention, and shown in green are regions involved with visuospatial attention. As illustrated by the yellow color, many regions of the fronto-parietal network respond to both audiospatial and visuospatial attention. The numbers refer to the corresponding stereotaxic axial slices of the MNI template image. Statistical maps were generated using an initial statistical threshold of z > 2.3 followed by a cluster significance threshold of p < .05 corrected for multiple comparisons.
Table 1.
Regions Exhibiting Increased Activation for Auditory Shifts of Attention, as Measured by a Contrast of Peripheral Catch Trials Minus Central Catch Trials
| x | y | z | Region | Brodmann's Area (BA) | Z Statistics |
|---|---|---|---|---|---|
| −4 | −66 | 52 | Precuneus | BA 7 | 3.76 |
| −8 | −70 | 56 | Superior parietal lobule | BA 7 | 3.65 |
| −10 | −62 | 54 | Precuneus | BA 7 | 3.62 |
| 10 | −80 | 52 | Precuneus | BA 7 | 3.58 |
| −38 | −28 | 58 | Precentral gyrus | BA 4 | 4.24 |
| −34 | −18 | 60 | Precentral gyrus | BA 6 | 3.99 |
| −30 | −14 | 60 | Precentral gyrus | BA 6 | 3.86 |
| −4 | 4 | 50 | Medial-frontal gyrus | BA 32 | 4.04 |
| −6 | −4 | 56 | Medial-frontal gyrus | BA 6 | 3.99 |
| 10 | −2 | 54 | Cingulate gyrus | BA 24 | 3.69 |
| 6 | 0 | 52 | Cingulate gyrus | BA 24 | 3.62 |
| 6 | −12 | 60 | Medial-frontal gyrus | BA 6 | 3.6 |
| −54 | −36 | 14 | Superior temporal gyrus | BA 42 | 3.93 |
| −54 | −32 | 12 | Superior temporal gyrus | BA 41 | 3.76 |
| −48 | −32 | 14 | Superior temporal gyrus | BA 41 | 3.69 |
| −52 | −40 | 14 | Insula | BA 13 | 3.61 |
| −58 | −44 | 18 | Superior temporal gyrus | BA 13 | 3.59 |
| −40 | −32 | 16 | Superior temporal gyrus | BA 41 | 3.54 |
| 28 | 2 | 54 | Middle frontal gyrus | BA 6 | 3.51 |
| 38 | −16 | 62 | Precentral gyrus | BA 6 | 3.5 |
| 32 | −12 | 56 | Precentral gyrus | BA 6 | 3.48 |
| 28 | −10 | 54 | Middle frontal gyrus | BA 6 | 3.39 |
| 30 | −4 | 56 | Middle frontal gyrus | BA 6 | 3.38 |
| 12 | 22 | 36 | Cingulate gyrus | BA 32 | 3.19 |
| −8 | 18 | 34 | Cingulate gyrus | BA 32 | 3.18 |
| −4 | 24 | 38 | Cingulate gyrus | BA 32 | 3.11 |
| 0 | 34 | 36 | Medial-frontal gyrus | BA 9 | 2.87 |
| 2 | 24 | 38 | Cingulate gyrus | BA 32 | 2.85 |
Coordinates of local maxima within significant clusters are reported in MNI space.
Table 2.
Regions Exhibiting Increased Activation for Visual Shifts of Attention, as Examined by a Contrast of Peripheral Catch Trials Minus Central Catch Trials
| x | y | z | Region | Brodmann's Area (BA) | Z Statistics |
|---|---|---|---|---|---|
| −14 | −60 | 62 | Superior parietal lobule | BA 7 | 4.21 |
| −18 | −72 | 48 | Precuneus | BA 7 | 3.85 |
| 8 | −60 | 54 | Precuneus | BA 7 | 3.73 |
| 12 | −56 | 56 | Precuneus | BA 7 | 3.71 |
| −22 | −72 | 54 | Precuneus | BA 7 | 3.68 |
| 6 | −90 | 10 | Cuneus | BA 18 | 3.8 |
| −16 | −94 | 20 | Cuneus | BA 19 | 3.77 |
| −20 | −92 | 26 | Cuneus | BA 19 | 3.73 |
| −16 | −80 | 28 | Cuneus | BA 18 | 3.73 |
| 18 | −84 | 20 | Cuneus | BA 18 | 3.72 |
| 26 | −86 | 22 | Cuneus | BA 18 | 3.7 |
| −32 | −10 | 54 | Precentral gyrus | BA 6 | 4.08 |
| −38 | −14 | 58 | Precentral gyrus | BA 6 | 4 |
| −28 | −18 | 72 | Precentral gyrus | BA 6 | 3.67 |
| −30 | −22 | 58 | Precentral gyrus | BA 6 | 3.67 |
| −40 | −16 | 68 | Precentral gyrus | BA 6 | 3.59 |
| −22 | −16 | 56 | Middle frontal gyrus | BA 6 | 3.58 |
| −52 | −32 | 26 | Inferior parietal lobule | BA 40 | 3.7 |
| −44 | −32 | 24 | Insula | BA 13 | 3.57 |
| −48 | −36 | 20 | Insula | BA 13 | 3.4 |
| −48 | −30 | 24 | Inferior parietal lobule | BA 40 | 3.37 |
| −42 | −34 | 20 | Insula | BA 13 | 3.31 |
| 2 | −4 | 54 | Medial-frontal gyrus | BA 6 | 3.68 |
| −4 | 0 | 52 | Cingulate gyrus | BA 24 | 3.62 |
| −4 | −10 | 56 | Medial-frontal gyrus | BA 6 | 3.56 |
| −4 | −4 | 58 | Medial-frontal gyrus | BA 6 | 3.41 |
| 22 | −10 | 70 | Superior frontal gyrus | BA 6 | 3.36 |
| 24 | 0 | 68 | Superior frontal gyrus | BA 6 | 2.89 |
Coordinates of local maxima within significant clusters are reported in MNI space.
The visual and the auditory tasks recruited similar networks of brain activation associated with endogenous orienting of attention. In Figure 2C, statistical maps for visual attention and auditory attention are overlaid onto the same brain. Regions that were significantly activated by audiospatial attention are denoted by the red color, and regions that were significantly activated by visuospatial attention are denoted in green. Areas overlap, indicated by the yellow color, was observed in the SMA, PPC, and FEFs, suggesting that these areas are representative of a supramodal attentional network. For completeness, a statistical analysis was conducted to explore the nature of this supramodal network, contrasting the visual orienting against auditory orienting. This analysis failed to detect any significant difference between these tasks, which could be attributable to insufficient statistical power. In summary, there was no detectable evidence for modality-specific spatial orienting; however, there was a strong indication that there is a supramodal network involved in orienting attention.
Experiment 2
Experiment 1 found similar regions activated for trials when participants expected a peripheral target relative to a central target, regardless of whether the anticipated target would be an auditory or a visual event. Although our analysis examined catch trials (where no targets were present), it should be noted that different types of stimuli were expected for the central and the peripheral cues. Therefore, it is possible that the response patterns could in principle be due to expectancies regarding stimulus properties rather than spatial selection. In addition, while all participants completed the auditory task before the visual task, they were all told before scanning that they would complete both a visual and an auditory task. This could in theory bias participants to use a “visual” strategy for the auditory task that they might not have used if they had only expected to conduct auditory trials. To address these concerns, we conducted a second experiment. In this experiment, the stimuli were identical regardless of task. Specifically, the individuals heard the sound of two musical instruments. During some blocks, they were asked to decide which instrument was more to one side (a spatial task), whereas on other blocks, they were asked to determine which instrument occurred first [a temporal order judgment (TOJ) task]. Therefore, the low-level stimuli were always identical, regardless of task. Further, in this study, participants only conducted an auditory task. We expected that the spatial task would cause greater activation in the regions identified in Experiment 1 than the temporal order task.
Methods
Participants
Twenty-two right-handed participants (12 females; age range = 18–22 years; median = 19 years) were enrolled in this study. All participants had normal or corrected-to-normal vision, and none reported any history of hearing, neurological, or psychiatric problems. Those individuals with visual refractory errors wore MRI compatible glasses. Informed consent was obtained from all participants before enrollment. In total, data from six participants were excluded from the final analysis because of excessive head motion (>3 mm) or inability to perform greater than chance (<53% accuracy for a task), leaving 16 subjects for the neuroimaging analyses (8 females). Participants were given $20, a 1-GB USB drive with brain images and a chance for an additional $50 for the individual who achieved the highest accuracy score.
Auditory Stimuli and Presentation
Each auditory stimulus consisted of two different sounds perceptually separated in space and time. One sound was the viola playing at the note “B,” which was clipped from first movement of Bartok's Viola Concerto (BB128). The other sound was the bassoon playing at the note “middle C,” which was clipped from Stravinsky's The Rite of Spring. The different pitch and timbre help to distinguish the two sounds. To control the level of difficulty between participants of different familiarity with the bassoon and viola, the two sounds were called “clean” and “messy,” respectively. This also makes identification easier because the bassoon sounds more like a pure tone whereas the viola is noisier. The raw sounds were tuned using Cool Edit Pro 2.00. Specifically, we cropped them to 359 msec in length, filtered out background noise, adjusted the start and end to an amplitude of zero to avoid bursts, and group waveform normalized them to an average root mean square power of −25.18 dB to control loudness. Each sound was panned spatially in a horizontal fashion 90° to the right (R90), 45° to the right (R45), 0° in the middle (M), 45° to the left (L45), and 90° to the left (L90) by adjusting the amplitude (to mimic interaural loudness difference) and the onset delay (to mimic interaural time difference) of the two channels. M was created by emitting the exact same sound from the left and the right channels. L45 was created by starting with M and then decreasing the amplitude of the right channel by 5 dB, increasing the left channel by 5 dB, and delaying the right channel by 0.3 msec. L90 was created by decreasing the amplitude of the right by 10 dB, increasing the left channel by 10 dB, and delaying the onset of the right channel by 0.6 msec. The R45 and the R90 were created in an analogous set of modifications to M. Relatively, the two sounds were always separated by exactly 90°. In each trial, if one sound, the clean or the messy, was L90, then the other was M; and if one was R90, the other was M. Finally, if one sound was L45, the other was R45. Both sounds ended together at the same point in time, but one always started before the other with stimuli onset asynchrony of 110, 145, or 180 msec. All 96 stimuli possibilities were saved as 44.1 kHz, 16-bit resolution stereo files. Participants also wore flat frequency-response earplugs (ER20, Etymotic Research, Inc.) to further attenuate scanner noise while preserving the integrity of auditory stimuli. Stimuli were presented as in the previous experiment (using the SereneSound headphones with Etymotic earplugs).
Experimental Design
Participants received visual information using the same screen projection system as Experiment 1. The display background remained gray throughout this experiment with only a small central fixation cross visible. The color of this cross indicated the task. A black fixation cross indicated a rest block, where no auditory stimuli were presented. When the fixation point was yellow, the participant was instructed to perform a TOJ task by deciding which sound came first. When the fixation point was blue, half of the participants were instructed to decide which of the two sounds appeared to be spatially farther to the left, and half were instructed to decide which appeared to be farther to the right as the spatial task. Identical stimuli were presented regardless of task. Likewise, both tasks required the same set of right-handed motoric responses, pushing their index finger to select clean or their middle finger for messy. Responses were recorded using the same response gloves as Experiment 1.
Participants completed two fMRI sessions, with each session lasting ∼13 min. Each session was a block design consisting of alternating 12 sec blocks of the TOJ and spatial tasks, with each task block separated by a rest block whose duration varied between 4000 and 12000 msec. Each block consisted of four trials, each lasting 3 sec. Each trial began with the presentation of the 359-msec stimuli, followed by a 2641-msec silence to allow time for a response. Each session consisted of 36 rest blocks (288 sec), 18 TOJ blocks (216 sec), and 18 spatial blocks (216 sec), yielding a total of 144 trials.
Procedure
Before scanning, the participants were familiarized with the task. They first listened to the two sounds individually panned in different spatial locations through headphones and a laptop outside the scanner. Each participant confirmed that the clean and the messy were distinguishable and the spatial locations were clear. Subsequently, the task was described and each participant was tested with three to six TOJ and spatial trials, depending on how many orally reported responses were correct, to confirm that the task would not be too difficult. The participants were instructed to maintain fixation on the centered cross throughout the experiment and to respond to all targets. The participants then completed a 6- to 7-min practice session inside the scanner against scanning noise. During this practice, each response was followed by feedback on the screen, and the participant had the option of repeating the practice a second time. Next, participants completed the tasks during approximately two 13-min sessions of fMRI scanning. Between the two sessions, the participants rested ∼7 min while a T1-weighted anatomical scan was taken.
fMRI Acquisition and Analysis
This experiment used the same scanner and headcoil as Experiment 1. However, this study used continuous scanning acquisition. Specifically, 334 EPI volumes were acquired during each fMRI session. Parameters used during acquisition were as follows: TR = 2.2 sec; echo time = 30 msec; no parallel imaging acceleration, matrix = 64 × 64; bandwidth = 2232 Hz/px, 36-axial slices, 3-mm-thick slices with 0.6-mm gap yielding voxel dimensions of 3 × 3 × 3.6 mm.
Statistical analysis proceeded in three stages, with the first and the last stage being the same as Experiment 1, except where noted. The intermediate stage was necessary to account for the multiple sessions of data collection in Experiment 2. In the first stage, preprocessed functional data for each session were analyzed using a general linear model with local autocorrelation correction (Woolrich et al., 2001). Within this general linear model, we used two regressors of interest that modeled the TOJ and the spatial blocks. These were convolved with a single Gamma function. Our main contrast vector of interest compared spatial > TOJ to see what areas were involved in audiospatial attention. We then conducted participant-level analysis using a fixed effects analysis by forcing the random-effects variance to zero in FMRIB's local analysis of mixed effects (Woolrich et al., 2004; Beckmann et al., 2003). Finally, group-level analyses were carried out using a mixed-effects model to allow inference to the population (Woolrich et al., 2004; Beckmann et al., 2003). The statistical maps were thresholded to account for multiple comparisons as described for Experiment 1.
Results
Behavioral Performance
Participants found both the two tasks to be equally difficult. Average accuracy for the spatial task was 84.11% (SD = 8.81%), and average accuracy for the TOJ task was 85.55% (SD = 7.96%). These differences were not significant, t(15) = 0.4812. Average RT for the spatial task was 1384 msec (SD = 149 msec) and for the TOJ task was 1307 msec (SD = 209 msec); this was also not significant, t(15) = 0.1261.
Neuroimaging Results
To investigate the neural bases of audiospatial attention, we identified regions that exhibited increased brain activation during spatial blocks relative to TOJ blocks. This contrast was designed to eliminate effects due to low-level perception or motoric responses (as these were identical across tasks). As illustrated in Figure 3, we see a pattern similar to the classic attentional network used for visual attention. We observed significant activation in bilateral temporal parietal junction, bilateral superior frontal activation near the FEFs, bilateral intraparietal sulcus, and bilateral occipital temporal junction (for additional regions and related statistics, see Table 3).
Figure 3.

Audiospatial judgments evoke robust activation in fronto-parietal cortices. In a follow-up experiment, we sought to rule out the possibility that our initial results could be explained by task difficulty or differential expectancies of stimulus properties. We contrasted spatial judgments against TOJ and found a very similar pattern activation pattern as Experiment 1. Statistical maps were generated using a cluster threshold of z > 2.3 and a corrected cluster significance threshold of p < .05.
Table 3.
Regions Exhibiting Increased Activation for Spatial Relative to TOJs
| x | y | z | Region | Brodmann's Area (BA) | Z Statistics |
|---|---|---|---|---|---|
| 38 | −68 | 38 | Inferior parietal lobule | BA 39 | 5.85 |
| −10 | −72 | 44 | Precuneus | BA 7 | 5.68 |
| 40 | −76 | 32 | Angular Gyrus | BA 39 | 5.59 |
| 10 | −68 | 42 | Precuneus | BA 7 | 5.52 |
| 10 | −62 | 50 | Precuneus | BA 7 | 5.03 |
| 10 | −56 | 62 | Precuneus | BA 7 | 4.8 |
| 32 | −8 | 44 | Middle frontal gyrus | BA 6 | 5.46 |
| 34 | −2 | 54 | Middle frontal gyrus | BA 6 | 4.53 |
| 30 | 8 | 40 | Middle frontal gyrus | BA 8 | 4.05 |
| 30 | 26 | 48 | Middle frontal gyrus | BA 8 | 3.96 |
| −8 | −78 | −14 | Declive | * | 4.66 |
| 14 | −60 | 16 | Posterior cingulate | BA 30 | 3.52 |
| −16 | −80 | 8 | Cuneus | BA 17 | 3.48 |
| −8 | −84 | 4 | Cuneus | BA 17 | 3.33 |
| −28 | −56 | −2 | Parahippocampal gyrus | BA 19 | 3.26 |
| −48 | −2 | 50 | Precentral gyrus | BA 6 | 4.04 |
| −36 | 16 | 48 | Middle frontal gyrus | BA 8 | 3.89 |
| −20 | 22 | 56 | Superior frontal gyrus | BA 8 | 3.78 |
| −26 | 18 | 60 | Middle frontal gyrus | BA 6 | 3.42 |
| −34 | −4 | 40 | Precentral gyrus | BA 6 | 3.42 |
| −20 | 8 | 66 | Middle frontal gyrus | BA 6 | 3.38 |
| 36 | −66 | −56 | Inferior semilunar lobule | * | 3.89 |
| 30 | −48 | −44 | Cerebellar tonsil | * | 3.62 |
| 38 | −80 | −42 | Pyramis | * | 3.44 |
| −4 | 14 | 4 | Caudate | Caudate head | 4.03 |
| 20 | 14 | 8 | Lentiform nucleus | Putamen | 3.06 |
| 2 | 16 | 40 | Cingulate gyrus | BA 32 | 3.36 |
| 0 | 8 | 50 | Medial-frontal gyrus | BA 32 | 3.36 |
| −4 | 32 | 42 | Medial-frontal gyrus | BA 6 | 3.32 |
Coordinates of local maxima within significant clusters are reported in MNI space. Asterisks (*) denote cerebellar regions, which do not have Brodmann labels.
General Discussion
Classical investigations of visual spatial attention have established a fronto-parietal network involved in attention. Activation for voluntary visual shifts of attention is typically seen within the FEFs, the superior parietal lobule extending to the intraparietal sulci, and the lateral occipital cortex (Husain & Rorden, 2003; Corbetta & Shulman, 2002; Cabeza & Nyberg, 2000; Hopfinger et al., 2000; Mangun et al., 1998). Results from our two experiments suggest that many of these circuits are cross modal, as we found very similar patterns of activation in the visual and auditory tasks. This conclusion is similar to the handful of previous neuroimaging studies of auditory attention, which have largely come to the same conclusion (Brunetti et al., 2008; Wu, Weissman, Roberts, & Woldorff, 2007; Mayer, Harrington, Adair, & Lee, 2006; Shomstein & Yantis, 2006; Tzourio et al., 1997). However, previous studies have suggested that visual processing recruits different types of attentional processes (e.g., endogenous, exogenous, orienting, reorienting, and alerting). Careful review of the previous auditory literature reveals paradigm differences that may tap into different aspects of these attentional processes. Therefore, we conclude, by a review of the previous neuroimaging studies of auditory attention, that different attentional processes appear to drive different anatomical circuits, analogous to the visual domain. This strongly suggests that a substantial component of cortical attention is cross modal, with similar effects for audition and vision.
Tzourio et al. (1997) used PET to examine endogenous auditory attention. Participants listened to pure tones randomly presented to the left or right ear: 80% of these tones were low pitched whereas 20% were high pitched. In some blocks, participants were asked to passively listen to sounds, while in other blocks they heard to the same sounds but were instructed to press a button for rare high pitched sounds occurring on one side. Analysis suggested that spatial attention evoked strong activation bilaterally in the SMA and in the precentral cortex as well as the left postcentral cortex. This paradigm differs from our own study in many ways. For example, Tzourio et al. asked the participants to attend to the same side for the entire scanning block (commencing 75 sec before injection of the radiotracer and continuing throughout the 80-sec scan). Therefore, the statistical analysis conducted by Tzourio et al. highlights regions involved in sustained spatial attention rather than the initial endogenous orienting of attention to a location. In addition, as the scanning blocks included many targets, it is unclear whether these results highlight the anticipatory process of attention or the facilitation of attended stimuli.
More recently, Mayer et al. (2006) examined auditory reorienting using event-related fMRI. Similar to our study, they used an auditory localization task, whereas many other neuroimaging studies of auditory attention have used a nonspatial task. As noted earlier, this may be important, as Spence and Driver (1994) reported that robust behavioral effects are typically only observed when the participant is asked to make spatial judgments. Indeed, a number of studies have reported how auditory localization tasks recruit different circuits from nonspatial tasks (Zimmer, Lewald, Erb, & Karnath, 2006; Alain, Arnott, Hevenor, Graham, & Grady, 2001; Bushara et al., 1999; Weeks et al., 1999). Mayer et al. examined reorienting by cuing participants to expect a sound on the left or right followed by a decision regarding which side the target actually appeared. Unfortunately, this design confounds perceptual and motoric expectations: a left cue predicts both a left-sided target and a left response. In the present study, we used an orthogonal-cuing paradigm, where the cue predicted the target side, but the task was to discriminate target elevation. Therefore, in our paradigm, the cue is not predictive of the motoric response. A further difference between these studies is that Mayer et al. used a peripheral cue, whereas our study used central symbolic cues. Therefore, the data of Mayer et al. are presumably influenced by both endogenous and exogenous attention, whereas our study is a purer measure of endogenous attention. This difference may explain differences in anatomical findings. Specifically, Mayer et al. reported that auditory reorienting modulates activity in the right precuneus as well as a bilateral temporal–frontal network: substantially more ventral to our own findings for orienting and in line with visual studies of exogenous attention (Corbetta, Kincade, & Shulman, 2002; Corbetta et al., 2000). Furthermore, their work shows an interaction with the time between the exogenous cue and the target, with shorter cue-target intervals associated with parietal–frontal activation.
Another recent article that combined fMRI and magnetoencephalography also reported that a fronto-parietal network is engaged for audiospatial reorienting (Brunetti et al., 2008). Similar to the results of Mayer et al. (2006), auditory reorienting evoked of a fronto-parietal network that was substantially more ventral than our results. This observation makes sense in light of the fact our study was focused on strategic aspects of attention. One key contribution of the study by Brunetti et al. (2008) is the ability to map out the temporal dynamics of auditory reorienting using magnetoencephalogram. Specifically, they found that the activity in temporal and parietal cortices precedes frontal activity. This result is similar to recent electrophysiological findings in nonhuman primates (Buschman & Miller, 2007).
Shomstein and Yantis (2006) had participants listen to two streams of auditory letters (e.g., “A,” “H,” “J”), with one stream presented in a male voice whereas the other stream was presented in a female voice. The task was to detect whenever the attended voice said a number (either “2” or “4”) and to switch which voice they were attending to when they heard one of these numbers (e.g., half the participants were asked to continue listening to the same voice if they heard the number “2” and switch voices if they heard the number “4,” whereas the other half of the participants were given the reverse instructions). Crucially, in some sessions, the voices were presented dichotically (so each voice had a unique spatial position), whereas in the remaining trials, the voices were both presented with equal intensity to the two ears (so they did not have a unique spatial position). This elegant design allowed the authors to isolate the regions that were active during shifting between voices relative to holding to the same voice. They found that shifting in the dichotic listening task elicited increased activation in the right precuneus and in the superior parietal lobe bilaterally as well as increase in the right cingulate and in the right middle frontal gyrus. On the other hand, they reported that in the nonspatial sessions, attentional shifting caused increased activation in the right precuneus/SPL, bilateral superior temporal gyrus, and bilateral medial-frontal gyrus as well as the right insula. One limitation of this study is that the authors did not directly compare the differences between the spatial and the nonspatial experiments. Therefore, it is difficult to be confident that the two tasks elicited a different pattern of activity or whether both tasks activated the same regions with the low statistical power inherent in neuroimaging causing apparent variability in the observed anatomy.
A similarity between our own work and that of Wu et al. (2007) is the analysis of “catch” trials where participants expect but do not observe a target. By focusing on nontarget trials, one can dissociate attention (activation due to expectation) from the consequences of attention (facilitated processing of attended information). Because the blood-flow changes measured in neuroimaging are sluggish, it is difficult to dissociate peri-contemporaneous events. However, our work extends that of Wu et al. in several ways. First, as previously described, we used a spatial task whereas they used a target detection task. Another difference is that Wu et al. compared peripheral attention tasks to trials in which a cue informs the participant that a target will not occur. Therefore, their statistical contrast combined temporal alerting with spatial orienting. In contrast, we compared cues that predict a spatial task with those that predict a nonspatial task: Both cues have identical temporal predictability offering a purer measure of orienting. The anatomical findings Wu et al. reported are largely similar to our own study: activation of a medial–superior parietal and frontal network. However, unlike our results from Experiment 1, they also detected additional activation in the anterior insula and in the BG. It is unclear whether these differences reflect differences in statistical power for detecting subcortical activity (as they acquired continuous data) or whether this reflects their inclusion of temporal alerting effects. Indeed, results from our own Experiment 2, which had more power than our first experiment because of the blocked design and acquisition of continuous data, also suggest that the BG may have a role in audiospatial attention. More studies, however, are needed to further delineate the functional anatomy of individual nodes of these large networks of activation.
In the present study, a comparison between auditory and visual orienting revealed no significant differences, which further suggests that the mechanisms supporting endogenous attentional orienting are largely the same across vision and audition and are thus supramodal. However, this observation is perhaps anecdotal because we did not control for difficulty or order effects in Experiment 1 given our primary interest in auditory attention alone and the already established neural circuitry for visual attention. Future studies will have to further tease apart the mechanisms supporting these functions by using interdisciplinary techniques (e.g., neuropsychology combined with neuroimaging), transient brain disruption (e.g., Smith, Jackson, & Rorden, 2009) and advanced analysis techniques (e.g., MVPA). This may reconcile the debate over whether different mechanisms support attentional orienting in different modalities. Given the results of our study, a large amount of overlap would be expected between endogenous visuospatial and audiospatial attention. However, it is unclear if exogenous attention and/or reorienting would show similar overlap across vision and audition. Modality-specific attentional mechanisms could shine new light on hemispatial neglect because occasionally there are patients who show deficits in one modality and not another (e.g., vision and not audition; Eramudugolla et al., 2007; Sinnett, Juncadella, Rafal, Azanon, & Soto-Faraco, 2007; Spierer et al., 2007). These studies may highlight attentional differences that are not specific to endogenous attention. Alternatively, there could be subtle differences in the attentional mechanisms across vision and audition, which have been previously documented (Green, Teder-Salejarvi, & McDonald, 2005), that our study was unable to tease apart due to the poor temporal resolution of fMRI. Future studies investigating the ostensible supramodal nature of attention would benefit from exploiting newer analysis techniques that use multivoxel pattern analysis and machine learning algorithms (Kay, Naselaris, Prenger, & Gallant, 2008; Peelen & Downing, 2007; Haynes & Rees, 2006; Norman, Polyn, Detre, & Haxby, 2006). With these advanced techniques, investigators could, in principle, develop statistical models based on the patterns of brain activation to one modality and examine how well these models predict other modalities.
As with any fMRI research, one could argue that the spatially extensive effects that we observed may actually be driven by very small anatomical structures. This view suggests that the very small structures may simply be too small to resolve with the spatial resolution currently available using fMRI. Specifically, there is substantial evidence that layers of the superior colliculus respond to vision, touch, and audition, using maps that remain in register (Stein & Meredith, 1993). This region is tightly connected to the parietal cortex and could in theory drive large cortical responses. Ignashchenkova, Dicke, Haarmeier, and Thier (2004) suggest that some cells in the superior colliculus fire during periods of exogenously cued visual attention, though it remains unclear whether these cells also respond during endogenous attention. In contrast, neurons in the parietal lobe are modulated during endogenous covert attention (for a review, see Raffi & Siegel, 2005). This electrophysiological work suggests that the parietal cortex is specifically involved in top–down control of attention.
In conclusion, we have shown that audiospatial attention recruits similar brain areas as visuospatial attention. In our first experiment, we used a sparse scanning technique coupled with orthogonal cuing to delineate the cortical regions associated with endogenous orienting of auditory spatial attention. This is the first neuroimaging study to use these techniques to study orienting in audition. Our study shows that audiospatial attention activates a brain network consisting of the PPC and FEF. These areas have a striking amount of overlap with areas traditionally seen in visual attention research as well as our own analogous examination of visual attention. The large amount of overlap seen for auditory and visual attention strongly suggests that the underlying mechanisms are largely supramodal. In a secondary experiment, we have confirmed that these results cannot be attributed to potential confounds such as differential expectancies regarding stimulus properties or task difficulty. Future studies will have to further tease apart the mechanisms supporting these functions by using interdisciplinary techniques (e.g., neuropsychology combined with neuroimaging) and advanced analysis techniques (e.g., multivoxel pattern analysis). These investigations may be able to shine light on previous studies that suggest differences between auditory and visual attention.
Acknowledgments
This research was supported by NIH grant R01 NS054266.
References
- Alain C, Arnott SR, Hevenor S, Graham S, Grady CL. “What” and “where” in the human auditory system. Proceedings of the National Academy of Sciences, U S A. 2001;98:12301–12306. doi: 10.1073/pnas.211209098. [DOI] [PMC free article] [PubMed] [Google Scholar]
- Beckmann CF, Jenkinson M, Smith SM. General multilevel linear modeling for group analysis in FMRI. Neuroimage. 2003;20:1052–1063. doi: 10.1016/S1053-8119(03)00435-X. [DOI] [PubMed] [Google Scholar]
- Broadbent DE. The role of auditory localization in attention and memory span. Journal of Experimental Psychology. 1954;47:191–196. doi: 10.1037/h0054182. [DOI] [PubMed] [Google Scholar]
- Brunetti M, Della Penna S, Ferretti A, Del Gratta C, Cianflone F, Belardinelli P, et al. A frontoparietal network for spatial attention reorienting in the auditory domain: A human fMRI/MEG study of functional and temporal dynamics. Cerebral Cortex. 2008;18:1139–1147. doi: 10.1093/cercor/bhm145. [DOI] [PubMed] [Google Scholar]
- Buschman TJ, Miller EK. Top–down versus bottom–up control of attention in the prefrontal and posterior parietal cortices. Science. 2007;315:1860. doi: 10.1126/science.1138071. [DOI] [PubMed] [Google Scholar]
- Bushara KO, Weeks RA, Ishii K, Catalan MJ, Tian B, Rauschecker JP, et al. Modality-specific frontal and parietal areas for auditory and visual spatial localization in humans. Nature Neuroscience. 1999;2:759–766. doi: 10.1038/11239. [DOI] [PubMed] [Google Scholar]
- Cabeza R, Nyberg L. Imaging cognition: II. An empirical review of 275 PET and fMRI studies. Journal of Cognitive Neuroscience. 2000;12:1–47. doi: 10.1162/08989290051137585. [DOI] [PubMed] [Google Scholar]
- Cherry EC. Some experiments on the recognition of speech, with one and with 2 ears. Journal of the Acoustical Society of America. 1953;25:975–979. [Google Scholar]
- Clarke S, Thiran AB. Auditory neglect: What and where in auditory space. Cortex. 2004;40:291–300. doi: 10.1016/s0010-9452(08)70124-2. [DOI] [PubMed] [Google Scholar]
- Corbetta M. Frontoparietal cortical networks for directing attention and the eye to visual locations: Identical, independent, or overlapping neural systems. Proceedings of the National Academy of Sciences, U S A. 1998;95:831–838. doi: 10.1073/pnas.95.3.831. [DOI] [PMC free article] [PubMed] [Google Scholar]
- Corbetta M, Akbudak E, Conturo TE, Snyder AZ, Ollinger JM, Drury HA, et al. A common network of functional areas for attention and eye movements. Neuron. 1998;21:761–773. doi: 10.1016/s0896-6273(00)80593-0. [DOI] [PubMed] [Google Scholar]
- Corbetta M, Kincade JM, Ollinger JM, McAvoy MP, Shulman GL. Voluntary orienting is dissociated from target detection in human posterior parietal cortex. Nature Neuroscience. 2000;3:292–297. doi: 10.1038/73009. [DOI] [PubMed] [Google Scholar]
- Corbetta M, Kincade JM, Shulman GL. Neural systems for visual orienting and their relationships to spatial working memory. Journal of Cognitive Neuroscience. 2002;14:508–523. doi: 10.1162/089892902317362029. [DOI] [PubMed] [Google Scholar]
- Corbetta M, Shulman GL. Control of goal-directed and stimulus-driven attention in the brain. Nature Reviews Neuroscience. 2002;3:201–215. doi: 10.1038/nrn755. [DOI] [PubMed] [Google Scholar]
- Coull JT, Nobre AC. Where and when to pay attention: The neural systems for directing attention to spatial locations and to time intervals as revealed by both PET and fMRI. Journal of Neuroscience. 1998;18:7426–7435. doi: 10.1523/JNEUROSCI.18-18-07426.1998. [DOI] [PMC free article] [PubMed] [Google Scholar]
- Driver J. Enhancement of selective listening by illusory mislocation of speech sounds due to lip-reading. Nature. 1996;381:66–68. doi: 10.1038/381066a0. [DOI] [PubMed] [Google Scholar]
- Driver J, Spence C. Cross-modal links in spatial attention. Philosophical Transactions of the Royal Society of London, Series B, Biological Sciences. 1998;353:1319–1331. doi: 10.1098/rstb.1998.0286. [DOI] [PMC free article] [PubMed] [Google Scholar]
- Eimer M, van Velzen J, Driver J. ERP evidence for cross-modal audiovisual effects of endogenous spatial attention within hemifields. Journal of Cognitive Neuroscience. 2004;16:272–288. doi: 10.1162/089892904322984562. [DOI] [PubMed] [Google Scholar]
- Eramudugolla R, Irvine DR, Mattingley JB. Association between auditory and visual symptoms of unilateral spatial neglect. Neuropsychologia. 2007;45:2631–2637. doi: 10.1016/j.neuropsychologia.2007.03.015. [DOI] [PubMed] [Google Scholar]
- Fan J, McCandliss BD, Fossella J, Flombaum JI, Posner MI. The activation of attentional networks. Neuroimage. 2005;26:471–479. doi: 10.1016/j.neuroimage.2005.02.004. [DOI] [PubMed] [Google Scholar]
- Fan J, McCandliss BD, Sommer T, Raz A, Posner MI. Testing the efficiency and independence of attentional networks. Journal of Cognitive Neuroscience. 2002;14:340–347. doi: 10.1162/089892902317361886. [DOI] [PubMed] [Google Scholar]
- Green JJ, Teder-Salejarvi WA, McDonald JJ. Control mechanisms mediating shifts of attention in auditory and visual space: A spatio-temporal ERP analysis. Experimental Brain Research. 2005;166:358–369. doi: 10.1007/s00221-005-2377-8. [DOI] [PubMed] [Google Scholar]
- Hall DA, Haggard MP, Akeroyd MA, Palmer AR, Summerfield AQ, Elliott MR, et al. “Sparse” temporal sampling in auditory fMRI. Human Brain Mapping. 1999;7:213–223. doi: 10.1002/(SICI)1097-0193(1999)7:3<213::AID-HBM5>3.0.CO;2-N. [DOI] [PMC free article] [PubMed] [Google Scholar]
- Haynes JD, Rees G. Decoding mental states from brain activity in humans. Nature Reviews Neuroscience. 2006;7:523–534. doi: 10.1038/nrn1931. [DOI] [PubMed] [Google Scholar]
- Hopfinger JB, Buonocore MH, Mangun GR. The neural mechanisms of top–down attentional control. Nature Neuroscience. 2000;3:284–291. doi: 10.1038/72999. [DOI] [PubMed] [Google Scholar]
- Hopfinger JB, Woldorff MG, Fletcher EM, Mangun GR. Dissociating top–down attentional control from selective perception and action. Neuropsychologia. 2001;39:1277–1291. doi: 10.1016/s0028-3932(01)00117-8. [DOI] [PubMed] [Google Scholar]
- Husain M, Rorden C. Non-spatially lateralized mechanisms in hemispatial neglect. Nature Reviews Neuroscience. 2003;4:26–36. doi: 10.1038/nrn1005. [DOI] [PubMed] [Google Scholar]
- Ignashchenkova A, Dicke PW, Haarmeier T, Thier P. Neuron-specific contribution of the superior colliculus to overt and covert shifts of attention. Nature Neuroscience. 2004;7:56–64. doi: 10.1038/nn1169. [DOI] [PubMed] [Google Scholar]
- Jenkinson M, Bannister P, Brady M, Smith S. Improved optimization for the robust and accurate linear registration and motion correction of brain images. Neuroimage. 2002;17:825–841. doi: 10.1016/s1053-8119(02)91132-8. [DOI] [PubMed] [Google Scholar]
- Jenkinson M, Smith S. A global optimisation method for robust affine registration of brain images. Medical Image Analysis. 2001;5:143–156. doi: 10.1016/s1361-8415(01)00036-6. [DOI] [PubMed] [Google Scholar]
- Kanwisher N, Wojciulik E. Visual attention: Insights from brain imaging. Nature Reviews Neuroscience. 2000;1:91–100. doi: 10.1038/35039043. [DOI] [PubMed] [Google Scholar]
- Kay KN, Naselaris T, Prenger RJ, Gallant JL. Identifying natural images from human brain activity. Nature. 2008;452:352–355. doi: 10.1038/nature06713. [DOI] [PMC free article] [PubMed] [Google Scholar]
- Lancaster JL, Woldorff MG, Parsons LM, Liotti M, Freitas CS, Rainey L, et al. Automated Talairach atlas labels for functional brain mapping. Human Brain Mapping. 2000;10:120–131. doi: 10.1002/1097-0193(200007)10:3<120::AID-HBM30>3.0.CO;2-8. [DOI] [PMC free article] [PubMed] [Google Scholar]
- Macaluso E, Driver J. Multisensory spatial interactions: A window onto functional integration in the human brain. Trends in Neurosciences. 2005;28:264–271. doi: 10.1016/j.tins.2005.03.008. [DOI] [PubMed] [Google Scholar]
- Mangun GR, Buonocore MH, Girelli M, Jha AP. ERP and fMRI measures of visual spatial selective attention. Human Brain Mapping. 1998;6:383–389. doi: 10.1002/(SICI)1097-0193(1998)6:5/6<383::AID-HBM10>3.0.CO;2-Z. [DOI] [PMC free article] [PubMed] [Google Scholar]
- Mayer AR, Harrington D, Adair JC, Lee R. The neural networks underlying endogenous auditory covert orienting and reorienting. Neuroimage. 2006;30:938–949. doi: 10.1016/j.neuroimage.2005.10.050. [DOI] [PubMed] [Google Scholar]
- McDonald JJ, Ward LM. Involuntary listening aids seeing: Evidence from human electrophysiology. Psychological Science. 2000;11:167–171. doi: 10.1111/1467-9280.00233. [DOI] [PubMed] [Google Scholar]
- McGurk H, Macdonald J. Hearing lips and seeing voices. Nature. 1976;264:746–748. doi: 10.1038/264746a0. [DOI] [PubMed] [Google Scholar]
- Nebel K, Stude P, Wiese H, Muller B, de Greiff A, Forsting M, et al. Sparse imaging and continuous event-related fMRI in the visual domain: A systematic comparison. Human Brain Mapping. 2005;24:130–143. doi: 10.1002/hbm.20075. [DOI] [PMC free article] [PubMed] [Google Scholar]
- Norman KA, Polyn SM, Detre GJ, Haxby JV. Beyond mind-reading: Multi-voxel pattern analysis of fMRI data. Trends in Cognitive Sciences. 2006;10:424–430. doi: 10.1016/j.tics.2006.07.005. [DOI] [PubMed] [Google Scholar]
- Ofek E, Pratt H. Ear advantage and attention: An ERP study of auditory cued attention. Hearing Research. 2004;189:107–118. doi: 10.1016/S0378-5955(03)00392-7. [DOI] [PubMed] [Google Scholar]
- Pavani F, Ladavas E, Driver J. Selective deficit of auditory localisation in patients with visuospatial neglect. Neuropsychologia. 2002;40:291–301. doi: 10.1016/s0028-3932(01)00091-4. [DOI] [PubMed] [Google Scholar]
- Peelen MV, Downing PE. Using multi-voxel pattern analysis of fMRI data to interpret overlapping functional activations. Trends in Cognitive Sciences. 2007;11:4–5. doi: 10.1016/j.tics.2006.10.009. [DOI] [PubMed] [Google Scholar]
- Perrault TJ, Vaughan JW, Stein BE, Wallace MT. Neuron-specific response characteristics predict the magnitude of multisensory integration. Journal of Neurophysiology. 2003;90:4022–4026. doi: 10.1152/jn.00494.2003. [DOI] [PubMed] [Google Scholar]
- Raffi M, Siegel RM. Functional architecture of spatial attention in the parietal cortex of the behaving monkey. Journal of Neuroscience. 2005;25:5171–5186. doi: 10.1523/JNEUROSCI.5201-04.2005. [DOI] [PMC free article] [PubMed] [Google Scholar]
- Rorden C, Karnath HO, Bonilha L. Improving lesion-symptom mapping. Journal of Cognitive Neuroscience. 2007;19:1081–1088. doi: 10.1162/jocn.2007.19.7.1081. [DOI] [PubMed] [Google Scholar]
- Senkowski D, Talsma D, Grigutsch M, Herrmann CS, Woldorff MG. Good times for multisensory integration: Effects of the precision of temporal synchrony as revealed by gamma-band oscillations. Neuropsychologia. 2007;45:561–571. doi: 10.1016/j.neuropsychologia.2006.01.013. [DOI] [PubMed] [Google Scholar]
- Shomstein S, Yantis S. Parietal cortex mediates voluntary control of spatial and nonspatial auditory attention. Journal of Neuroscience. 2006;26:435–439. doi: 10.1523/JNEUROSCI.4408-05.2006. [DOI] [PMC free article] [PubMed] [Google Scholar]
- Sinnett S, Juncadella M, Rafal R, Azanon E, Soto-Faraco S. A dissociation between visual and auditory hemi-inattention: Evidence from temporal order judgements. Neuropsychologia. 2007;45:552–560. doi: 10.1016/j.neuropsychologia.2006.03.006. [DOI] [PubMed] [Google Scholar]
- Smith DT, Jackson S, Rorden C. Repetitive transcranial magnetic stimulation over frontal eye fields disrupts visually cued auditory attention. Brain Stimulation. 2009;2:81–87. doi: 10.1016/j.brs.2008.07.005. [DOI] [PMC free article] [PubMed] [Google Scholar]
- Smith SM. Fast robust automated brain extraction. Human Brain Mapping. 2002;17:143–155. doi: 10.1002/hbm.10062. [DOI] [PMC free article] [PubMed] [Google Scholar]
- Smith SM, Jenkinson M, Woolrich MW, Beckmann CF, Behrens TE, Johansen-Berg H, et al. Advances in functional and structural MR image analysis and implementation as FSL. Neuroimage. 2004;23(Suppl 1):S208–S219. doi: 10.1016/j.neuroimage.2004.07.051. [DOI] [PubMed] [Google Scholar]
- Soto-Faraco S, Spence C. Modality-specific auditory and visual temporal processing deficits. Quarterly Journal of Experimental Psychology: Section A, Human Experimental Psychology. 2002;55:23–40. doi: 10.1080/02724980143000136. [DOI] [PubMed] [Google Scholar]
- Spence CJ, Driver J. Covert spatial orienting in audition—Exogenous and endogenous mechanisms. Journal of Experimental Psychology: Human Perception and Performance. 1994;20:555–574. [Google Scholar]
- Spierer L, Meuli R, Clarke S. Extinction of auditory stimuli in hemineglect: Space versus ear. Neuropsychologia. 2007;45:540–551. doi: 10.1016/j.neuropsychologia.2006.04.012. [DOI] [PubMed] [Google Scholar]
- Stein BE, Meredith MA. The merging of the senses. Cambridge, MA: MIT Press; 1993. [Google Scholar]
- Talsma D, Doty TJ, Woldorff MG. Selective attention and audiovisual integration: Is attending to both modalities a prerequisite for early integration? Cerebral Cortex. 2007;17:679–690. doi: 10.1093/cercor/bhk016. [DOI] [PubMed] [Google Scholar]
- Thiel CM, Zilles K, Fink GR. Cerebral correlates of alerting, orienting and reorienting of visuospatial attention: An event-related fMRI study. Neuroimage. 2004;21:318–328. doi: 10.1016/j.neuroimage.2003.08.044. [DOI] [PubMed] [Google Scholar]
- Treisman AM. Strategies and models of selective attention. Psychological Review. 1969;76:282–299. doi: 10.1037/h0027242. [DOI] [PubMed] [Google Scholar]
- Tzourio N, ElMassioui F, Crivello F, Joliot M, Renault B, Mazoyer B. Functional anatomy of human auditory attention studied with PET. Neuroimage. 1997;5:63–77. doi: 10.1006/nimg.1996.0252. [DOI] [PubMed] [Google Scholar]
- van der Lubbe RHJ, Neggers SFW, Verleger R, Kenemans JL. Spatiotemporal overlap between brain activation related to saccade preparation and attentional orienting. Brain Research. 2006;1072:133–152. doi: 10.1016/j.brainres.2005.11.087. [DOI] [PubMed] [Google Scholar]
- Weeks RA, Aziz-Sultan A, Bushara KO, Tian B, Wessinger CM, Dang N, et al. A PET study of human auditory spatial processing. Neuroscience Letters. 1999;262:155–158. doi: 10.1016/s0304-3940(99)00062-2. [DOI] [PubMed] [Google Scholar]
- Woolrich MW, Behrens TE, Beckmann CF, Jenkinson M, Smith SM. Multilevel linear modelling for FMRI group analysis using Bayesian inference. Neuroimage. 2004;21:1732–1747. doi: 10.1016/j.neuroimage.2003.12.023. [DOI] [PubMed] [Google Scholar]
- Woolrich MW, Ripley BD, Brady M, Smith SM. Temporal autocorrelation in univariate linear modeling of FMRI data. Neuroimage. 2001;14:1370–1386. doi: 10.1006/nimg.2001.0931. [DOI] [PubMed] [Google Scholar]
- Worsley KJ. Statistical analysis of activation images. In: Jezzard P, Matthews PM, Smith SM, editors. Functional MRI: An introduction to methods. Oxford: Oxford University Press; 2001. [Google Scholar]
- Wu CT, Weissman DH, Roberts KC, Woldorff MG. The neural circuitry underlying the executive control of auditory spatial attention. Brain Research. 2007;1134:187–198. doi: 10.1016/j.brainres.2006.11.088. [DOI] [PMC free article] [PubMed] [Google Scholar]
- Zimmer U, Lewald J, Erb M, Karnath HO. Processing of auditory spatial cues in human cortex: An fMRI study. Neuropsychologia. 2006;44:454–461. doi: 10.1016/j.neuropsychologia.2005.05.021. [DOI] [PubMed] [Google Scholar]