Abstract
Purpose
A dosimetric comparison between multiple static-field intensity-modulated radiation therapy (IMRT), multi-arc intensity-modulated arc therapy (IMAT) and single-arc arc-modulated radiation therapy (AMRT) is performed to evaluate their clinical advantages and shortcomings.
Methods and Materials
Twelve cases were selected for this study, including 3 head-and-neck (HN), 3 brain (CNS), 3 lung, and 3 prostate cases. An IMRT, IMAT, and AMRT plan was generated for each of the patient cases with clinically-relevant planning constraints. For fair comparison, the same parameters were used for the IMRT, IMAT, and AMRT planning for each patient.
Results
Multi-arc IMAT provided the best plan quality while single-arc AMRT achieved comparable dose distributions to IMRT, especially in the complicated HN and brain cases. Both AMRT and IMAT showed effective normal tissue sparing without compromising target coverage and delivered a lower total dose to the surrounding normal tissues in some cases.
Conclusions
IMAT provides the most uniform and conformal dose distributions especially for the cases with large and complex targets with a similar delivery time to IMRT. AMRT achieves results comparable to IMRT with significantly faster treatment delivery.
Keywords: IMRT, IMAT, AMRT, arc therapy, radiotherapy techniques
Introduction
With the recent availability of several commercial products such as Varian’s RapidArc™ and Elekta’s VMAT, intensity-modulated arc therapy (IMAT) techniques using one rotational arc have gained interest in the clinic (1–6). These techniques are believed to improve delivery efficiency compared to static-field IMRT while maintaining similar treatment plan quality (5–6).
Similar to step-and-shoot IMRT where the intensity modulation is achieved by superimposing multileaf collimator (MLC) shaped segments, multi-arc IMAT uses multiple overlapping arcs. At a given beam angle within an arc, a MLC aperture delivers a 2D uniform intensity distribution. By superimposing these apertures from several overlapping arcs, intensity modulation is achieved at this angle. During delivery, the MLC dynamically transitions from one aperture to the next between adjacent angles while the gantry is rotating and the beam is on. Although multi-arc IMAT can achieve highly conformal dose distributions (7), the delivery time increases with the number of arcs used, e.g. 6 – 17 minutes for 5 – 15 arcs (1 arc approximately takes at least 1 minute to deliver). This extended delivery time has led exploration of the single-arc technique as a more efficient process.
As demonstrated in a previous study, the dosimetric effect is negligible when a beam is delivered at a slightly different angle from its planned position (8). Hence, the dose to target delivered from a stack of overlapping apertures at a given angle versus that delivered from the same set of apertures spaced in a narrow angular sector around this given angle is virtually the same. This is the essence of a single-arc technique called arc-modulated radiation therapy (AMRT), which intends to deliver a conformal dose distribution comparable to multi-arc IMAT in a single gantry rotation (6).
Typically, N equi-spaced static beams separated by an angular interval Δθ are used to optimize the ideal fluence distributions for AMRT. Each of the N ideal intensity maps is segmented into k segments and each segment delivers a 2D uniform intensity profile. The apertures are spaced evenly over Δθ and the entire plan is delivered with a single arc spanning a range of (N-1) Δθ. Although there is no intensity modulation with each beam, the same dosimetric effect is achieved when the doses from these tightly packed apertures are summed up in the target.
With renewed interest in these techniques, in this study, we evaluate the advantages and shortcomings of multiple static-field IMRT, multi-arc IMAT, and single-arc AMRT by comparing the plan quality of 12 clinical cases in 4 disease sites.
Methods and Materials
Twelve previously treated IMRT cases including 3 head-and-neck (HN), 3 brain, 3 lung, and 3 prostate cases were selected for this retrospective study. Target sizes > 14 cm in the x-direction were excluded because of the limitations of the sequencing algorithms of IMAT and AMRT. All cases were chosen by a physician to present challenging cases for different disease sites that had needed an IMRT solution in the clinic. Except for prostate, each case was selected with a different stage of disease, primary site, prescription dose (reflecting definitive versus adjuvant treatment), and avoidance structure in order to represent a variety of clinical scenarios.
To ensure a fair comparison, the initial plans for all three techniques were generated using the same planning system with the same fundamental planning parameters such as the isocenter, prescription, and optimization constraints; the final dose distributions were calculated using the same in-house developed Monte-Carlo based superposition algorithm (9), and the computed doses were transferred to the same commercial treatment planning system for DVH analyses.
The planning procedure for all three treatment modalities follows a sequential four-step approach. 1) A set of ideal intensity maps were optimized in Pinnacle3 treatment planning system utilizing the P3IMRT module (Philips Medical, Madison, WI). 2) MLC leaf sequencing of the ideal intensity maps was performed. 3) A segment weight optimization was applied. 4) The final MLC sequence that contains the MLC positions and monitor units (MU) was used to compute the doses with the in-house dose engine. The three techniques differed in the number of beams used and in the leaf sequencing methods which will be described below.
Beam Orientation and Optimization
For a benchmark, IMRT plans that conformed to clinical standards were first generated for all cases with 7 – 9 beam angles. The same set of optimization objectives and constraints were used to generate IMAT and AMRT plans, with 36 equi-spaced static beam angles that approximate the 360-degree arcs. The prescription dose was based on the actual clinical treatment and the normal tissue constraints were derived from RTOG protocols (www.rtog.org) of 05-22 (H&N), 05-13 (CNS), 06-17 (lung), 04-15 (prostate), and accepted clinical guidelines at the University of Maryland. Dose constraint goals included: mean parotid < 26 Gy, uninvolved larynx < 45 Gy, brachial plexus < 60 Gy, optic nerves < 45 Gy, retina and spinal cord < 50 Gy, optic chiasm < 54 Gy, brainstem < 60 Gy, bilateral lungs V20 < 37%, heart V67 < 45 Gy, bladder V65 ≤ 50% and V75 ≤ 25%, and rectal V60 ≤ 50% and V70 ≤ 25%.
Leaf Sequencing
For IMRT, the ideal fluence maps were converted into a set of step-and-shoot sequences with the k-mean clustering algorithm in Pinnacle3. Segmentation parameters were specified with minimum segment area ≤ 4 cm2 and minimum MU per segment ≤ 2.
For IMAT and AMRT, the plans were sequenced using our in-house sequencing algorithms with both aperture shape and weight variations allowed. Dose-rate variation is therefore required for treatment delivery. Compared to IMRT, MLC segmentation for rotational therapy is more complicated. To ensure deliverability, a MLC connectivity constraint must be applied for leaf sequencing. Equation 1 describes the relationship among the maximum allowed MLC displacement between adjacent planning angles dmax, the maximum MLC speed vmax, the angular spacing of the planning beams θ, and the maximum gantry speed ωmax:
| (1) |
In IMAT, MLC are allowed to travel between the adjacent planning angles up to 5 cm with θ of 10°, vmax of 3 cm/s, and ωmax of 6 °/s. The larger the MLC displacement, the larger the aperture shape variation that exists between the adjacent beam angles. As a result, the delivered dose distribution may degrade compared to the planned dose. From experience, a moderate connectivity constraint of 3 cm gives sufficient freedom for the MLC to produce the aperture shape variation required for complex intensity modulation without causing significant plan degradation between static-beam planning and continuous arc delivery. All IMAT plans in this study were planned with a MLC constraint of 3 cm.
For AMRT, the choice of MLC constraint is more complicated. Because the number of beams increases and the angular spacing decreases in the single arc, the MLC transition constraint limits the treatment delivery time, i.e. the larger the MLC constraint, the longer the delivery may take:
| (2) |
| (3) |
| (4) |
The maximum deliverable gantry speed smax, is defined by the maximum MLC speed vmax and the maximum MLC displacement per degree Δd (Eqn. 2). In this study, the arc range of all AMRT plans is 360°. The quickest or the minimum delivery time Tmin, is therefore only governed by the maximum MLC displacement allowed (see Eqns. 3 and 4). Typically, for an efficient and deliverable AMRT delivery (2 to 5 minutes), a MLC constraint of 1 cm/° to 2.5 cm/° is used. Further considerations such as plan complexity and possible plan degradation in delivery are taken into account when choosing the appropriate MLC constraint. Details of the leaf sequencing algorithms for AMRT and IMAT can be found in previous publications (6, 10).
Segment Weight Optimization
After leaf sequencing, all plans were imported into Pinnacle3 for segment weight optimization to regain any loss of plan quality due to the approximations of the optimal intensity distribution and considerations of delivery constraints during segmentation. The segment weight optimization objectives were identical to those used in the initial optimization.
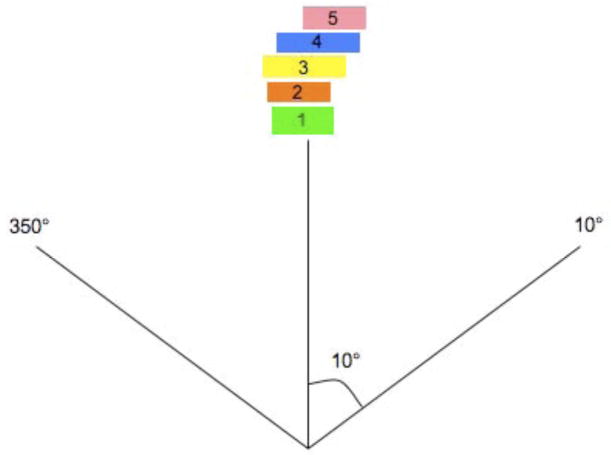
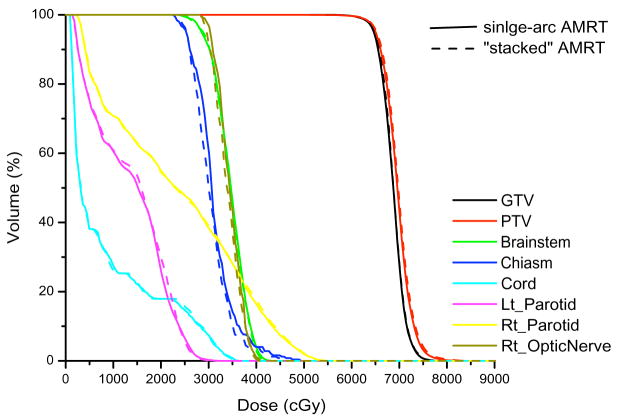
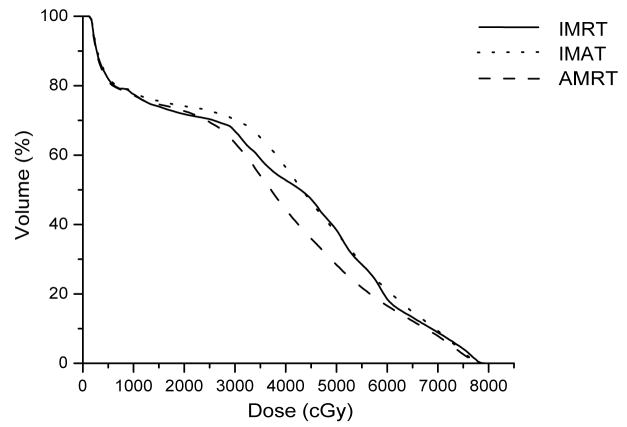
Unlike the IMAT sequence, which consists of 36 beams and each beam containing k segments, where k is the total number of arcs, an AMRT sequence typically consists of 180 – 432 beams, each with one segment. Due to software limitations, we stacked the neighboring apertures over the given angles to reduce the number of beams to 36 before transferring to Pinnacle3 as illustrated in Figure 1. This conversion is justified by a previous study, which found that the dosimetric effects are minimal if the beams were delivered at slightly different angular positions (≤±5°) from the original planning angles (8). The dose-volume histogram (DVH) comparison of a single-arc HN AMRT plan with 395 beams and the corresponding plan with apertures stacked on to 36 beam angles shows minimal differences as shown in Figure 2. Based on this benchmark, all AMRT plans were converted for segment weight optimization and the final MLC sequences were exported from Pinnacle3 and were processed to reposition each segment back to its original beam angle such that the final dose calculation would be based on a single-arc sequence.
Figure 1.
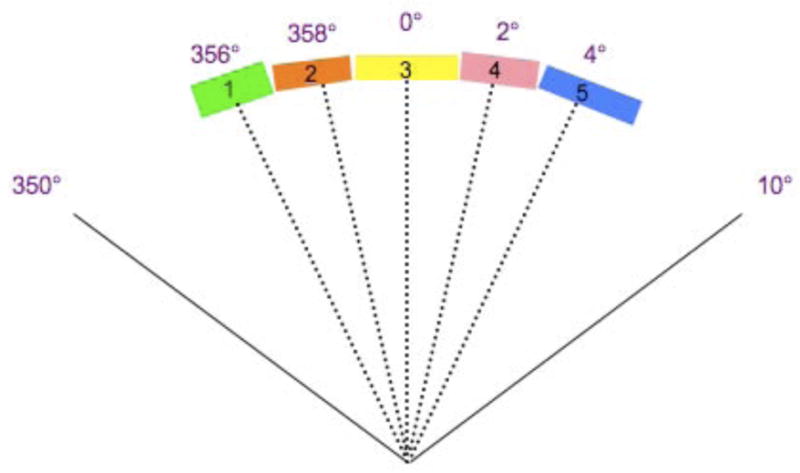
The conversion of a single-arc AMRT MLC sequence into an equivalent 36-beam sequence from
(a) 180 bems with one segment per beam spaced at every 2° to
(b) apertures stacked up at the mid-beam interval of where the 5 segments were originally occupied in the single-arc sequence.
Figure 2.
Comparison of a single-arc AMRT plan and a “stacked” AMRT plan of a HN case.
Dose Calculation
Because Pinnacle3 limits the total number of beams in a plan (≤180 beams) and the majority of the AMRT plans violate this limit, all plans were computed with our in-house dose engine, Monte Carlo kernel-based convolution/superposition (MCKS) (9) for a fair comparison. All plans were calculated with a dose grid of 2 × 2 × 3 mm3 and the end point of all simulations was where 2% statistics was achieved. For IMAT and AMRT, all plans were calculated with a finely interpolated angular spacing of 0.5° and 0.1° to simulate continuous delivery arcs. Since MCKS uses random sampling, this interpolation did not significantly increase the dose computation time (11).
Plan Evaluation
All resultant dose files were imported back to Pinnacle3 for isodose distribution and DVH evaluations. Several clinically used dose matrices were analyzed such as Vx, which indicates the volume of the anatomical structure receiving x Gy of dose. For serial organs such as the brainstem and spinal cord, the dose received by ≤ 0.5 cc of the volume served as an index of plan quality. For the measure of target coverage, the volume that received ≥ 95% of the prescription dose, or V95%, was used.
Results
The results are grouped by disease site with summaries of each case’s dose indices in tables 1–4. For reference, table 5 summarizes plan parameters such as number of fields, segments, and MU for each disease site.
Table 1.
Summary of dose indices of the HN case studies.
| ROI | Dose Index | IMRT | IMAT | AMRT | |
|---|---|---|---|---|---|
| Case 1 | PTV | * V95% | 95.6% | 98.0% | 95.1% |
| Left Parotid | Mean dose | 20.3 Gy | 20.0 Gy | 20.5 Gy | |
| Right Parotid | Mean dose | 9.0 Gy | 11.4 Gy | 13.8 Gy | |
|
| |||||
| Case 2 | PTV | * V95% | 97.8% | 96.2% | 97.0% |
| Right Parotid | Mean dose | 22.9 Gy | 20.6 Gy | 20.5 Gy | |
| Brainstem | 0.5 cc | 40.7 Gy | 43.2 Gy | 48.1 Gy | |
| Optic Chiasm | Max Dose | 53.4 Gy | 50.2 Gy | 52.5 Gy | |
| Right Optic Nerve | Max Dose | 49.9 Gy | 44.7 Gy | 47.9 Gy | |
|
| |||||
| Case 3 | PTV | * V95% | 95.0% | 96.7% | 96.9% |
| Larynx | Mean Dose | 34.0 Gy | 36.0 Gy | 36.7 Gy | |
| Spinal Cord | 0.5 cc | 39.1 Gy | 39.4 Gy | 40.1 Gy | |
V95% is the volume of ROI receiving 95% of the prescription dose.
Table 4.
Summary of dose indices of the prostate case studies.
| ROI | Dose Index | IMRT | IMAT | AMRT | |
|---|---|---|---|---|---|
| Case 10 | PTV | * V95% | 100% | 100% | 97.3% |
| Bladder | V65 | 30.7% | 31.5% | 29.6% | |
| V75 | 18.4% | 19.8% | 11.6% | ||
| Rectum | V60 | 18.5% | 21.3% | 16.6% | |
| V70 | 8.9 % | 9.4% | 7.9% | ||
|
| |||||
| Case 11 | PTV | * V95% | 100% | 100% | 97.7% |
| Bladder | V65 | 26.5% | 27.1% | 26.5% | |
| V75 | 17.0% | 19.7% | 15.4% | ||
| Rectum | V60 | 22.5% | 24.1% | 20.6% | |
| V70 | 15.6% | 15.7% | 13.8% | ||
|
| |||||
| Case 12 | PTV | * V95% | 98.3% | 99.9% | 100% |
| Bladder | V65 | 10.1% | 11.3% | 10.5% | |
| V75 | 5.1% | 7.1% | 6.7% | ||
| Rectum | V60 | 21.9% | 20.6% | 20.2% | |
| V70 | 14.4% | 13.7% | 12.9% | ||
V95% is the volume of ROI receiving 95% of the prescription dose.
Table 5.
Plan information of the cases: total number of fields, total number of segments and total number of monitor units.
| IMRT | IMAT | AMRT | ||
|---|---|---|---|---|
| HN cases | Field | 7 – 9 | 36 (9 – 11 arcs) | 36 |
| Segment | 74 – 102 | 324 – 396 | 324 – 396 | |
| MU | 530 – 672 | 478 – 754 | 609 – 1022 | |
|
| ||||
| Brain cases | Field | 6 – 10 | 36 (7 – 12 arcs) | 36 |
| Segment | 55 – 105 | 252 – 432 | 252 – 432 | |
| MU | 393 – 752 | 474 – 681 | 627 – 871 | |
|
| ||||
| Lung cases | Field | 7 | 36 (5– 12 arcs) | 36 |
| Segment | 53 – 104 | 180 – 432 | 180 – 432 | |
| MU | 347 – 1195 | 547 – 907 | 665 – 1325 | |
|
| ||||
| Prostate cases | Field | 7 | 36 (5 arcs) | 36 |
| Segment | 22 – 34 | 180 | 180 | |
| MU | 293 – 387 | 362 – 420 | 444 – 546 | |
HN cases 1 – 3
The target of case 1 is a T4N0 squamous cell of the left maxilla and recurrent T1N0 squamous cell of the retromolar fossa that was treated after surgery to 59.4 Gy. Case 2 is a T4N0 squamous cell of the left nasal cavity and maxillary sinus treated with definitive chemo-radiation to 70.2 Gy; and case 3 is a T2N1 squamous cell of the right floor of mouth treated to 72 Gy. The major avoidance structures for all three cases were the parotids, optic nerve and larynx, respectively.
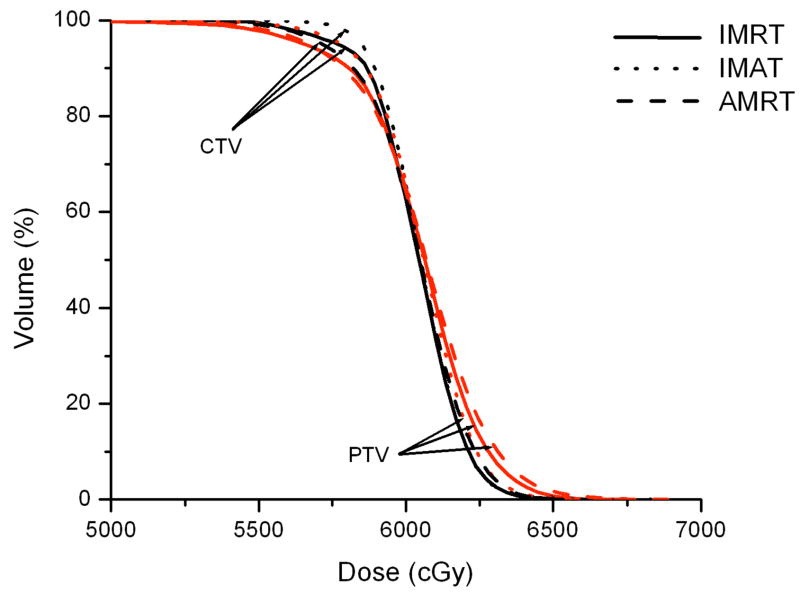
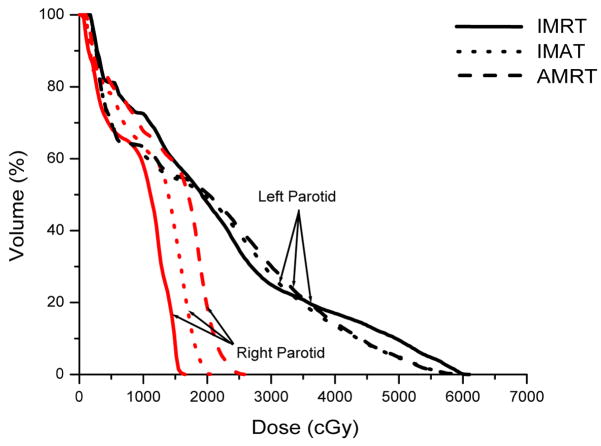
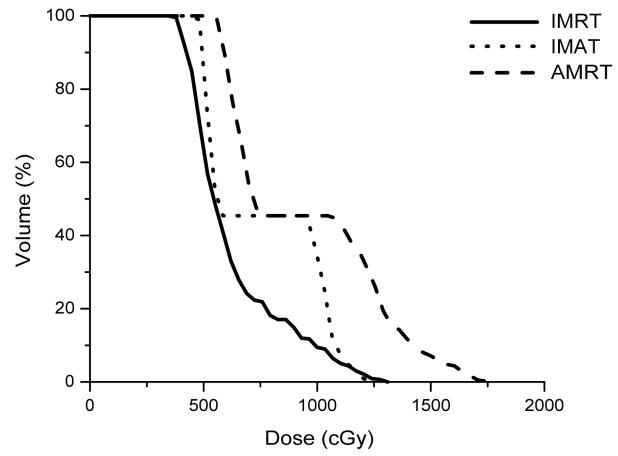
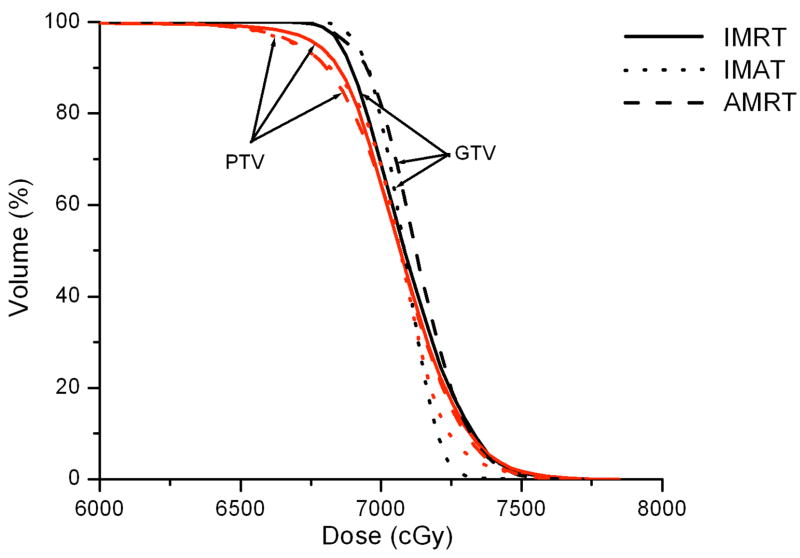
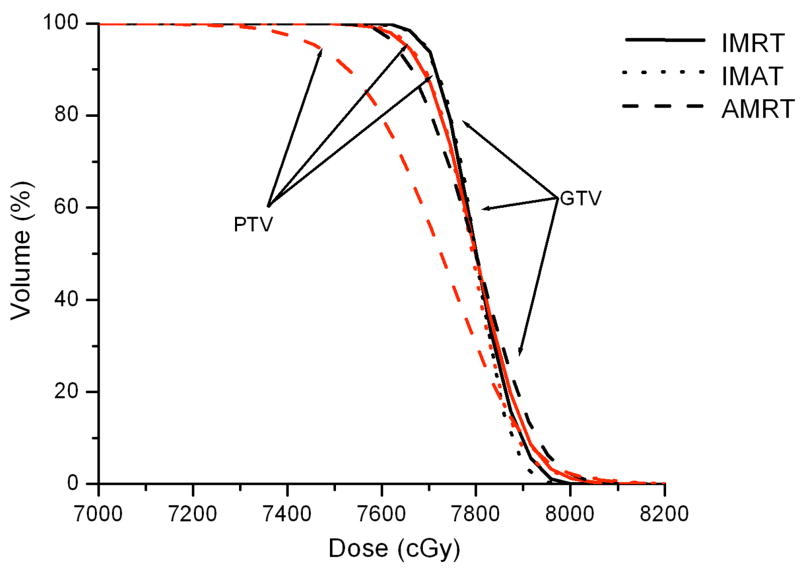
IMRT, IMAT, and AMRT achieved similar plan quality for all three HN cases. For example, Figure 3 illustrates the DVH comparison of the IMRT, IMAT, and AMRT plan for case 1. The 7-field IMRT and single-arc AMRT plans achieved similar PTV coverage with V95% of 95.6% and 95.1%, respectively, where the 11-arc IMAT plan provided the most conformal dose distribution to the PTV with V95% of 98.0%. Among the three plans, the contralateral parotid received similar dose but the mean dose to the ipsilateral parotid was different - with 9.0 Gy, 11.4 Gy, and 13.8 Gy in IMRT, IMAT, and AMRT, respectively.
Figure 3.
Comparison of IMRT, IMAT, and AMRT for HN case 1 for
(a) the targets,
(b) the right and left parotids, and
(c) the optic chias.
The proximal organs-at-risk (OARs) around the PTV include the right optic nerve and the optic chiasm in case 2. 7 fields were used in IMRT and it achieved a slightly better target coverage than IMAT while it was similar to AMRT. The IMAT plan delivered the lowest dose to the normal tissues and spared the optic chiasm and right optic nerve with the maximum dose of 50.2 Gy and 44.7 Gy, while it was 53.4 Gy and 49.9 Gy for IMRT, and 52.5 Gy and 47.9 Gy for AMRT. In addition, AMRT obtained the highest dose to the brainstem with 48.1 Gy, while this was 40.7 Gy in IMRT and 43.2 Gy in IMAT.
For case 3, it was important to keep the mean dose of larynx under 40 Gy and the 7-field IMRT plan produced the least favorable plan with V95% of 95.0% while the 11-arc IMAT plan and the 324-segment AMRT plan were similar with 96.7% and 96.9% in PTV coverage, respectively. However, the doses to larynx and spinal cord were not largely different between all three plans.
Brain cases 4 – 6
Case 4 was a localized right sphenoid wing meningioma treated to 54 Gy; case 5 was a recurrent astrocytoma located in the left frontoparietal lobe treated to 60 Gy; and case 6 was a grade 3 anaplastic oligoastrocytoma occupying two-thirds of the cerebrum treated to 59.4 Gy. In general, IMAT provided the best target coverage while IMRT and AMRT produced similar dose distributions.
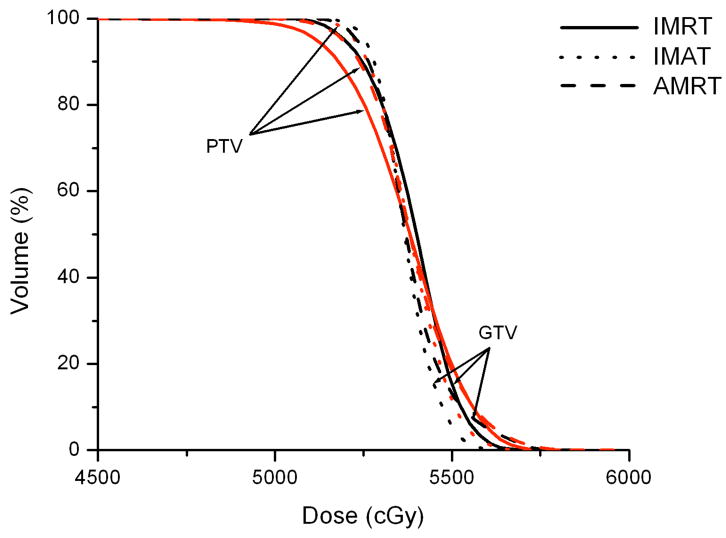
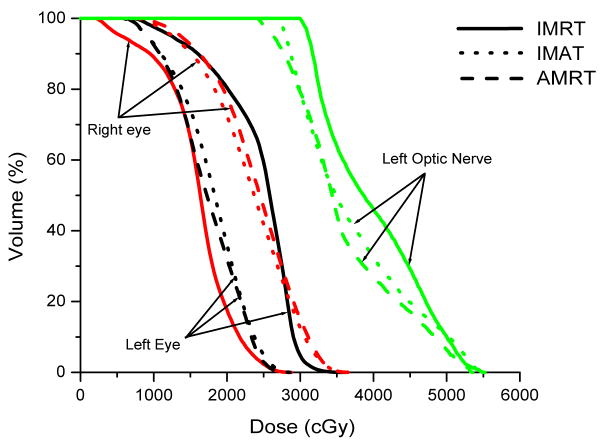
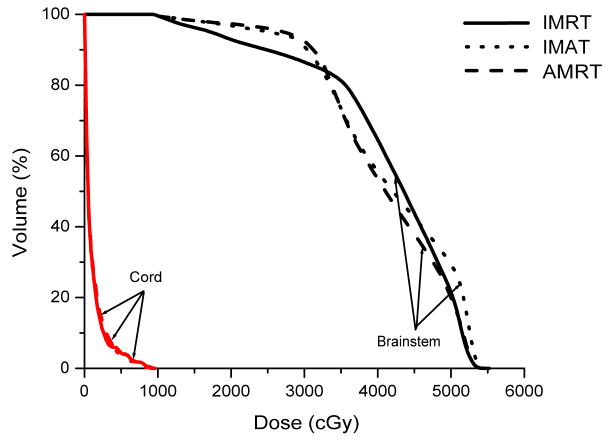
In case 4, IMAT delivered a V95% of 99.8 %, while it was only 94.2% in IMRT and 98.3% in AMRT. Part of the brainstem and a significant portion of the right optic nerve overlapped with the PTV such that these OARs were compromised. The left optic nerve does not overlap but abuts the PTV, resulting in a maximum dose that is slightly higher than the maximum constraint. The 7-beam arrangement in IMRT avoided direct irradiation to the brainstem but the maximum dose was not minimized as depicted in Figure 4.
Figure 4.
Comparison of IMRT, IMAT and AMRT for brain case 4 for
(a) the targets,
(b) the right and left eyes, and
(c) the brainstem.
For case 5, IMAT provided the most superior target coverage of 97.0% with 12 arcs. IMRT and AMRT achieved similar V95% of 95.0% and 95.7%, respectively. The dose to OARs was similar between all three plans, with a slightly higher maximum dose to the optic chiasm and left optic nerve in AMRT (53.5 Gy and 58.3 Gy, respectively), as they were in the proximity of the CTV.
Case 6 covered a large portion of the skull but the optic apparatus was more distant than in cases 4 and 5. IMAT and AMRT achieved V95% of 99.2% and 99.8%, respectively, compared to 98.8% in IMRT. However, the 5-beam IMRT plan obtained the lowest dose to most of the critical organs while the maximum dose to both of the optic nerves was increased, especially in AMRT as shown in table 2.
Table 2.
Summary of dose indices of the brain case studies.
| ROI | Dose Index | IMRT | IMAT | AMRT | |
|---|---|---|---|---|---|
| Case 4 | PTV | * V95% | 94.2% | 99.8% | 98.3% |
| Brainstem | 0.5 cc | 53.0 Gy | 53.5 Gy | 52.7 Gy | |
| Left Optic Nerve | Max Dose | 55.2 Gy | 54.6 Gy | 53.3 Gy | |
| Left Eye | Max Dose | 36.0 Gy | 28.8 Gy | 28.5 Gy | |
| Right Eye | Max Dose | 28.8 Gy | 36.6 Gy | 36.8 Gy | |
|
| |||||
| Case 5 | CTV | * V95% | 95.0% | 97.0% | 95.7% |
| Brainstem | 0.5 cc | 58.5 Gy | 55.8 Gy | 59.5 Gy | |
| Optic Chiasm | Max Dose | 51.9 Gy | 51.6 Gy | 53.5 Gy | |
| Left Optic Nerve | Max Dose | 57.4 Gy | 56.9 Gy | 58.3 Gy | |
| Right Optic Nerve | Max Dose | 39.0 Gy | 39.8 Gy | 38.1 Gy | |
|
| |||||
| Case 6 | PTV | * V95% | 98.8% | 99.2% | 99.8% |
| Brainstem | 0.5 cc | 54.6 Gy | 53.9 Gy | 53.5 Gy | |
| Left Optic Nerve | Max Dose | 43.6 Gy | 48.1 Gy | 50.2 Gy | |
| Right Optic Nerve | Max Dose | 42.8 Gy | 44.5 Gy | 49.1 Gy | |
| Left Eye | Max Dose | 39.1 Gy | 38.2 Gy | 41.2 Gy | |
| Right Eye | Max Dose | 46.1 Gy | 40.9 Gy | 39.4 Gy | |
V95% is the volume of ROI receiving 95% of the prescription dose.
Lung cases 7 – 9
Case 7 was a recurrent lung cancer in the right lung treated to 70.2 Gy that was centrally located but did not need nodal coverage. Case 8 was a T2N0 right upper lobe NSCLC treated to 72 Gy that was peripheral in the lung and did not need nodal coverage. Case 9 was a T3N3 NSCLC treated to 66.6 Gy that needed central nodal coverage and contralateral lung sparing. For lung cases, all three techniques provided similar plan quality but IMAT and AMRT tended to deliver lower dose to the ipsilateral lung volumes while maintaining similar target coverage to IMRT as shown in table 3 and Figure 5.
Table 3.
Summary of dose indices of the lung case studies.
| ROI | Dose Index | IMRT | IMAT | AMRT | |
|---|---|---|---|---|---|
| Case 7 | PTV | * V95% | 98.5% | 99.3% | 97.5% |
| Left Lung | V20 | 0.2% | 0.0% | 5.3% | |
| Right Lung | V20 | 20.3% | 26.2% | 24.5% | |
| Total Lungs | V20 | 12.0% | 15.3% | 16.5% | |
|
| |||||
| Case 8 | PTV | * V95% | 97.8% | 95.8% | 96.2% |
| Left Lung | V20 | 0.3% | 7.9% | 10.9% | |
| Right Lung | V20 | 34.7% | 27.7% | 29.1% | |
| Total Lungs | V20 | 13.1% | 15.3% | 17.7% | |
| Spinal Cord | 0.5 cc | 13.9 Gy | 34.1 Gy | 31.6 Gy | |
|
| |||||
| Case 9 | PTV | * V95% | 95.0% | 99.8% | 99.2% |
| Left Lung | V20 | 43.1% | 36.1% | 37.1% | |
| Right Lung | V20 | 24.0% | 18.2% | 19.0% | |
| Total Lungs | V20 | 32.7% | 26.3% | 27.2% | |
| Spinal Cord | 0.5 cc | 50.4 Gy | 48.8 Gy | 55.5 Gy | |
V95% is the volume of ROI receiving 95% of the prescription dose.
Figure 5.
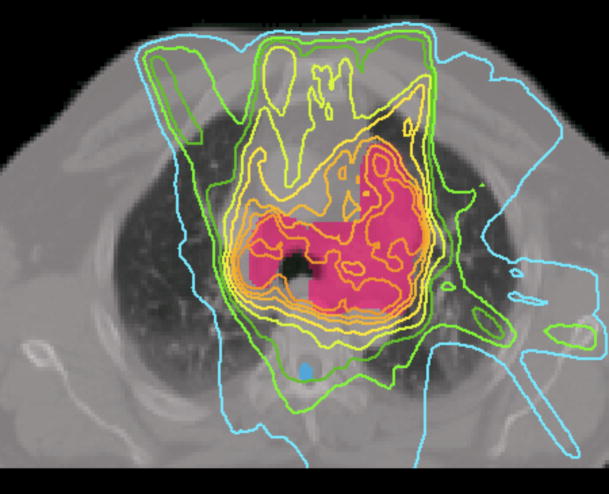
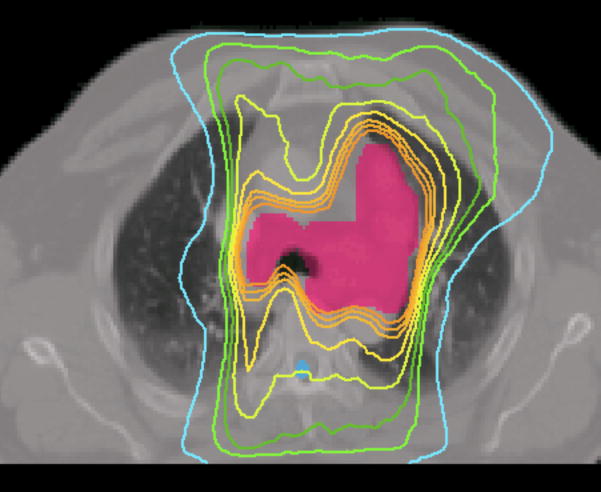
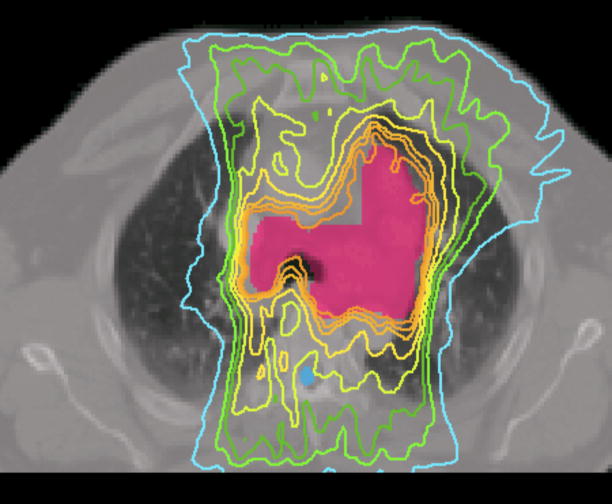
Prescription isodose lines for lung case 9 using
(a) IMRT,
(b) IMAT,
and (c) AMRT.
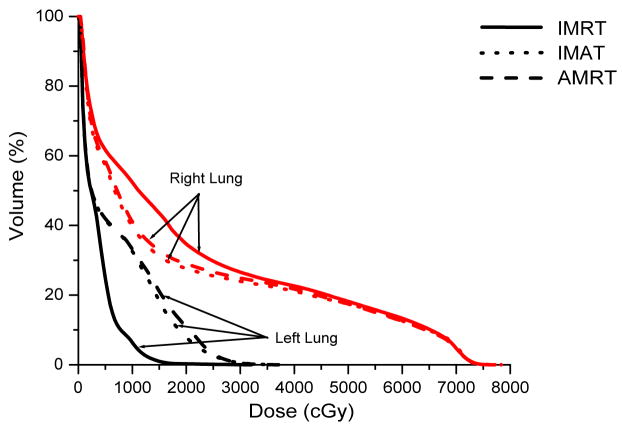
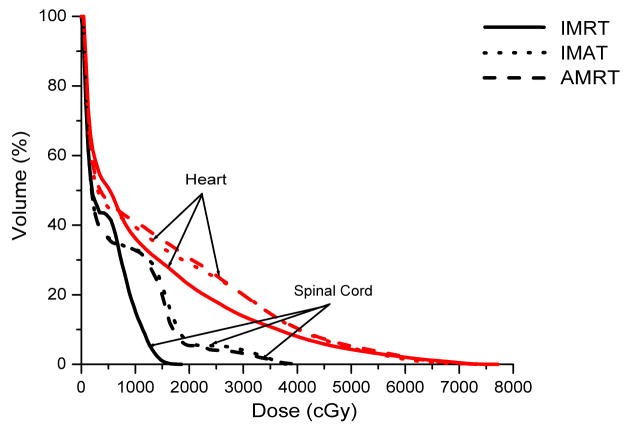
The multiple static-beams in IMRT are favored in cases that would benefit from biased beam arrangement. In both cases 7 and 8, the 7 beams used in the IMRT plans were arranged such that minimal irradiation was introduced to the contralateral healthy lung. IMAT and AMRT utilized full 360-degree arcs and increased the contralateral lung dose without exceeding the limits as shown in Figure 6. The V20 of the contralateral lung in case 7 was 0.2%, 0.0%, and 5.3% in IMRT, IMAT, and AMRT, respectively; while in case 8, it was 0.3%, 7.9%, and 10.9% in IMRT, IMAT, and AMRT, respectively. In addition, the V20 of total lungs were not largely different between the three sets of plans.
Figure 6.
Comparison of IMRT, IMAT and AMRT for lung case 8 for
(a) the targets,
(b) the right and left lungs, and
(c) the heart and the spinal cord.
For case 9, the 7-beam IMRT plan obtained the lowest V95% of 95.0% while delivering a V20 of 43.1% to the left lung. The 12-arc IMAT and 432-segment AMRT plans however, provided coverage of > 99.0% to the target while V20 of the left lung was kept under 36.1% and 37.1%, respectively. For AMRT, the excellent target coverage was obtained with the cost of high spinal cord dose as displayed in table 3.
Prostate cases 10–12
The 7-beam IMRT, 5-arc IMAT, and 180-segment AMRT plans were very similar with 78 Gy prescribed to the PTV (prostate only) for all three low-risk prostate cases. IMAT obtained 100% target coverage in all cases while IMRT and AMRT achieved similar target dose distributions (see table 4).
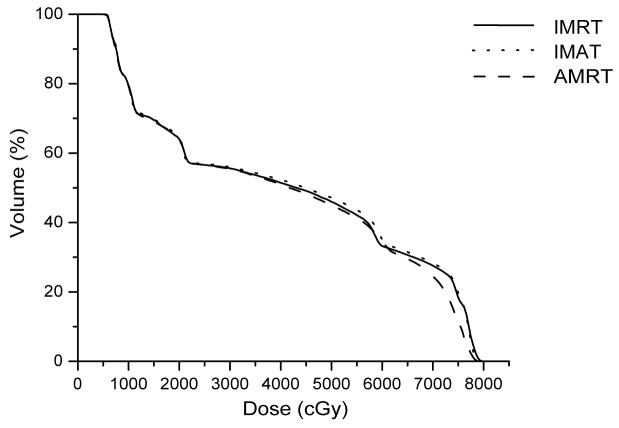
Bladder and rectum toxicities were comparable for all three techniques although AMRT is slightly more effective in tissue sparing. For example, in case 10, V75 for bladder was 18.4% in IMRT, 19.8% in IMAT and only 11.6% in AMRT. The total bladder dose was similar between the plans but AMRT was able to further reduce the total rectal dose. Nonetheless, the better normal tissue sparing of AMRT resulted in less uniform target coverage as depicted in Figure 7.
Figure 7.
Comparison of IMRT, IMAT and AMRT for prostate case 10 for
(a) the targets,
(b) the bladder, and
(c) the rectum.
Discussion
Overall, IMAT provided the most optimal plan quality compared to IMRT and AMRT but each technique has its advantages and shortcomings in different types of cases. In the HN and brain cases, all three techniques produced comparable dose distributions but AMRT had a delivery time ≥ 4 minutes, compared to 10 – 15 minutes for the other two techniques. Although this advantage of treatment efficiency can be sustained for the lung cases, AMRT slightly increased the normal tissue dose due to the full rotational arc configuration. For IMRT, the limited number of beams allowed a biased beam arrangement such that minimal dose is delivered to the contralateral lung as seen in lung cases 8 and 9. Partial arcs may be used in IMAT and AMRT to reduce the low dose volume, but full rotational arcs can lower the dose to the ipsilateral lung.
The limited number of beams in IMRT may be useful in some cases but the optimal beam angles can be missed, which may prevent the plan from producing the optimal dose distributions. IMAT considers all beam angles during optimization and therefore it is more likely to achieve a better plan than IMRT. For AMRT, although the number of beams used in optimization and the total number of segments are the same as in IMAT, the segments are tightly packed in AMRT, thus the MLC displacement constraint becomes more stringent than in IMAT. As a result, the flexibility of the aperture shape to vary between the planning beam angles is lowered. With only one single arc, a potential conflict may occur between the need to deliver the closest possible intensity maps to the ideal sets and the connectivity of the MLC segments. When such conflicts occur, the deliverability will take preference and the plan quality is compromised. However, because the delivery time of a single arc is potentially much shorter than IMAT, a second single arc can be added to compensate any residual dose coverage. This could be a potential solution for the cases with large and complex targets.
The fast delivery time of AMRT and high plan quality of IMAT may not be as distinctive in simple cases, such as prostate. IMRT is sufficient to produce a conformal dose distribution that can rival IMAT with a delivery time that is comparable to AMRT. With an approximate delivery time of 2.5 minutes for AMRT and 4 minutes for IMRT, the majority of the total treatment time would still be spent in the initial setup and image guidance procedures. However, for complex cases such as HN, AMRT is capable of delivering a comparable dose distribution to IMRT in < 4 minutes, while IMRT may require 8 – 15 minutes. IMAT is able to produce the most conformal dose distribution but it is just as slow as IMRT.
Other single-arc techniques such as the Varian RapidArc™ may offer a shorter delivery time of < 2 minutes. The difference between AMRT and RapidArc is in the method of optimization - intensity-map based optimization and direct aperture optimization (DAO), respectively. The intensity-map based optimization is a 2-step approach where a set of ideal intensity maps is first generated, followed by a leaf sequencing process. DAO is a one-step process where the dose distribution is simultaneously optimized with MLC leaf positions and weights (12). While IMAT can use either approach, the current form of AMRT uses the 2-step method which results in more segments than a DAO-based RapidArc plan. The fewer segments in RapidArc render a shorter delivery time, therefore 2 single arcs may be used to achieve similar target coverage to that in IMAT while maintaining delivery efficiency, as an additional arc may provide supplementary aperture shape variation for a complex dose distribution.
Conclusions
The plan quality of conventional multiple static-field IMRT, multi-arc IMAT, and single-arc AMRT was compared in this study. IMAT obtained the best target coverage in most of the cases and the lowest toxicity in some of the cases. AMRT was able to achieve similar dose distributions to IMAT and IMRT, but in a few cases, AMRT showed greater reduction in normal tissue dose at the cost of less uniform target coverage. With a delivery time of 2 – 4 minutes for the single-arc technique, a second single-arc can be added to create a comparable plan quality to IMAT while preserving high delivery efficiency.
Acknowledgments
This work is supported in part by a grant from Varian Medical Systems.
Footnotes
Conflict of interest: none
Publisher's Disclaimer: This is a PDF file of an unedited manuscript that has been accepted for publication. As a service to our customers we are providing this early version of the manuscript. The manuscript will undergo copyediting, typesetting, and review of the resulting proof before it is published in its final citable form. Please note that during the production process errors may be discovered which could affect the content, and all legal disclaimers that apply to the journal pertain.
References
- 1.Mackie TR, Holmes TW, Swerdloff S, et al. Tomotherapy: A new concept for the delivery of dynamic conformal radiotherapy. Med Phys. 1993;20:1709–1719. doi: 10.1118/1.596958. [DOI] [PubMed] [Google Scholar]
- 2.Yu CX. Intensity-modulated arc therapy with dynamic multileaf collimation: an alternative to tomotherapy. Phys Med Biol. 1995;40:1435–1449. doi: 10.1088/0031-9155/40/9/004. [DOI] [PubMed] [Google Scholar]
- 3.Cameron C. Sweeping-window arc therapy: an implementation of rotational IMRT with automatic beam-weight calculation. Phys Med Biol. 2005;50:4317–4336. doi: 10.1088/0031-9155/50/18/006. [DOI] [PubMed] [Google Scholar]
- 4.Ulrich S, Nill S, Oelfke U. Development of an optimization concept for arc-modulated cone beam therapy. Phys Med Biol. 2007;52:4099–4119. doi: 10.1088/0031-9155/52/14/006. [DOI] [PubMed] [Google Scholar]
- 5.Otto K. Volumetric modulated arc therapy: IMRT in a single gantry arc. Med Phys. 2007;35:310–317. doi: 10.1118/1.2818738. [DOI] [PubMed] [Google Scholar]
- 6.Wang C, Luan S, Tang G, et al. Arc-Modulated Radiation Therapy (AMRT): A single-arc form of intensity-modulated arc therapy. Phys Med Biol. 2008;53:6291–6303. doi: 10.1088/0031-9155/53/22/002. [DOI] [PubMed] [Google Scholar]
- 7.Cao D, Holmes TW, Afghan MKN, et al. Comparison of plan quality provided by intensity-modulated arc therapy and helical tomotherapy. Int J Rad Oncol Biol Phys. 2007;69:240–250. doi: 10.1016/j.ijrobp.2007.04.073. [DOI] [PubMed] [Google Scholar]
- 8.Tang G, Earl MA, Luan S, et al. Converting Multiple-arc Intensity-Modulated Arc Therapy Into a Single Arc for Efficient Delivery. Int J Radiat Oncol Biol Phys. 2007;69:S673. [Google Scholar]
- 9.Naqvi SA, Earl MA, Shepard DM. Convolution/superposition using the Monte Carlo method. Phys Med Biol. 2003;48:2101–2121. doi: 10.1088/0031-9155/48/14/305. [DOI] [PubMed] [Google Scholar]
- 10.Luan S, Wang C, Cao D, et al. Leaf-sequencing for intensity-modulated arc therapy using graph algorithms. Med Phys. 2008;35:61–69. doi: 10.1118/1.2818731. [DOI] [PubMed] [Google Scholar]
- 11.Tang G, Earl MA, Luan S, et al. Stochastic versus deterministic kernel-based superposition approaches for dose calculation of intensity-modulated arcs. Phys Med Biol. 2008;53:4733–4746. doi: 10.1088/0031-9155/53/17/018. [DOI] [PubMed] [Google Scholar]
- 12.Shepard DM, Earl MA, Li XA, et al. Direct aperture optimization: A turnkey solution for step-and-shoot IMRT. Med Phys. 2002;29:1007–1018. doi: 10.1118/1.1477415. [DOI] [PubMed] [Google Scholar]


