Abstract
A disposable, low-cost colorimetric sensor array has been created by pin-printing onto a hydrophilic membrane 16 chemically responsive nanoporous pigments made from indicators immobilized in an organically modified silane (ormosil). The array has been used to detect and identify 14 different natural and artificial sweeteners at millimolar concentrations as well as commonly used individual serving sweetener packets. The array has shown excellent reproducibility and long shelf-life and has been optimized to work in the biological pH regime.
Keywords: artificial sweetener, colorimetric sensor array, sol-gel immobilized pH indicator, boronate ester formation
INTRODUCTION
Array based sensing has emerged as a powerful tool for the detection of chemically diverse analytes by producing specificity, not from any single sensor, but as a unique composite response for each analyte. Such cross-reactive sensor arrays mimic the mammalian olfactory and gustatory systems and are a widely used approach in electronic nose1 and tongue2 technologies. Conventional sensor arrays typically have been based on a variety of responses from individual sensors, including electric conductivity changes upon analyte absorption into conductive polymers or polymer composites3 or potentiometric changes from analyte adsorption onto metal oxide surfaces with oxidation or other electrochemical processes.4
We have developed an alternative optoelectronic approach using simple colorimetric sensor arrays for the detection and identification of a wide range of analytes.5, 6 Our previous printing formulations have been based on plasticized hydrophobic chemically responsive dyes that showed resistance to humidity while proving quite effective for the detection of gaseous analytes5 and hydrophobic organic analytes in aqueous solutions.6 For aqueous detection of hydrophilic analytes, however, the response time and sensitivity of our hydrophobic arrays proved to be problematic. To overcome this limitation, it is necessary that all chromogenic centers are accessible to the aqueous analytes while at the same time avoiding leaching or blooming of the colorant upon exposure to aqueous solutions. To that end, we have now made sensor arrays from nanoporous pigments made by the immobilization of soluble dyes into porous ormosils (organically modified silicates). Ormosils were chosen as the host materials because of their high chemical and mechanical stability and the wide range of available final properties of the resulting xerogel (e.g., porosity, hydrophilicity, range of pH response) with simple modifications to silane precursors, pH, and water content.7 We have recently reported the use of nanoporous pigment array for the discrimination of a number of carbohydrates, 8 and we report here the extension of this work to the detection, identification, and quantification of natural and artificial sweeteners.
Artificial sweeteners represent 62% of the commercial sweetener market and are found in a huge range of products, from carbonated beverages to pharmaceuticals. Since 1977, the Food and Drug Administration (FDA) has approved several nonnutritive sweeteners to be used in foods, including saccharin, aspartame, acesulfame-K, and sucralose, just to name a few. Cyclamate, an approved high-intensity sweetener in over 100 countries worldwide, was banned in the United States for its putative links to bladder cancer in rats. The increase in the production and use of artificial sweeteners is remarkable, with an estimated 600% increase between 1980 and 2005 in total high-intensity sweetener consumption9 and 37.7% and 14.2% increases between 1989 and 2004 in the amounts of artificial sweeteners ingested in beverages and foods, respectively.10 Global sugar alcohol production is rising at 2.2 percent per year with 2005 production estimated at nearly 900,000 tons.11 More recently, studies show that the global sweetener market is growing at an annual rate of 3.7%, with sucralose growing the fastest and aspartame-based sweeteners holding onto 50% of the global market, reaching roughly the $3 billion mark in 2008.12
While several analytical techniques are feasible for the analysis of natural and artificial sweeteners (including ion chromatography, HPLC, potentiometry, and fluorescence detection),13 such analysis can prove tedious and cumbersome due to the need for sensitive equipment and slow analysis times. As such, practical methods are badly needed for the detection and quantification of sweeteners to assist in routine, real-time food quality control in the field. Here we report a low-cost, simple colorimetric sensor array capable of facile discrimination among a number of commonly used natural and artificial sweeteners at biological pH and in the presence of “real-world” interferents, examine its use for quantification of sweetener concentration, and demonstrate excellent reproducibility and long shelf-life.
EXPERIMENTAL SECTION
All reagents were obtained from Sigma-Aldrich and used “as-received” unless otherwise specified. All pH measurements were performed using a FisherScientific Accumet® AP61 pH meter with an AP50 electrode. Preparation of the Buffer Solution: 3-nitrophenylboronic acid and sodium phosphate (dibasic) were dissolved in nano-pure water to afford a 1 mM phosphate buffer solution with 5 mM 3-nitrophenylboronic acid, which was adjusted to pH 7.45 using 0.5 M sodium hydroxide dissolved in the same solution. Preparation of Analyte Solutions: the analyte solutions were prepared by dissolving the sugars, sugar alcohols, and artificial sweeteners in pH 7.45, 5 mM 3-nitrophenylboronic acid / 1 mM phosphate buffer solutions (5:1, 3-NPBA:PO4) to produce 25 mM solutions of each. Preparation of Sweetener Packet Solutions: sweetener packet solutions were prepared by dissolving one serving packet (1 g for Sweet’N Low®, Stevita®, Equal®, and Splenda®, ~3.5 g and 4.2 g for Domino® sugar and Sugar in the Raw®, respectively; for ingredients, cf. Supporting Information (SI) Table S1) in 120 mL (~ 4 oz) of the above-mentioned 5:1, 3-NPBA:PO4 buffer solution. Preparation of Tea Samples: tea was purchased from a local coffee shop (“White-Peony” from Espresso Royale Café®, Urbana, IL). Approximately 3 g of tea leaves were placed in a tea-bag and steeped in boiling water for 4 minutes. The tea was allowed to cool to room temperature and filtered to remove any particulates. One packet of each sweetener was added to 120 mL of the blank tea solution and stirred until the analyte dissolved completely.
Preparation of the Colorimetric Sensor Array (CSA) and Experimental Setup
A solution of tetramethylorthosilicate (TMOS), methyltrimethoxysilane (MTMS), methanol, and water was prepared in the molar ratio of 1:1:11:5. After stirring for two hours, the sol-gel solution was added to the selected indicators (SI Table S2). The resulting solutions were loaded into a 1 × 1 × 1/2 in Teflon block containing 16 pre-drilled, individual cylindrical wells, each 3/8′′ deep. Using 16 slotted pins (VNP Scientific) capable of delivering approximately 100 nL of the pigment containing formulation, the array was printed on a nitrocellulose acetate membrane (Millipore, Catalog No. SSWP14250). Printed membrane sheets were placed in a 60 °C oven for 24 hours after which the oven temperature was lowered to 35 °C and the arrays left for an additional 24 hours. The arrays were then stored under nitrogen until use.
For a typical analysis, the array was sonicated in a 5:1, 3-NPBA:PO4 buffer solution for ~1 minute to remove any excess indicator and fully wet the membrane. The array was then placed into a polycarbonate cartridge, and ~1.7 mL of the buffer solution was injected to fill the cartridge. The cartridge was placed on an Epson® Perfection V200 scanner. A “before” image was obtained and the blank solution was replaced with analyte solution. Although equilibration generally takes less than 2 minutes, an “after” image was obtained after 5 min. to ensure complete equilibration of most weakly responding analytes.
Digital Imaging and Data Analysis
Difference maps were obtained by taking the difference of the red, green, and blue (RGB) values from the center of every dye spot (~300 pixels) from the “before” and “after” images as shown in Figure 1. Averaging of the centers of the spots avoids artifacts from non-uniformity of the dye spots, especially at their edges. The use of an 8-bit imaging scanner produces red, green, and blue values ranging from 0-255, such that an RGB value of (0, 0, 0) would be black, while values of (255, 255, 255) would be white. Expressing each spot in this manner allows for reproducible differentiation from “before” to “after” images by simple subtraction of each RGB component. As a result, each analysis is represented digitally by a 48-dimentional vector (16 red, green, and blue color difference values) with a total possible range of −255 to +255. These difference maps are then used to create a digital database, which is used for all statistical and quantitative analysis. For ease of visualization only, the color palette of the difference map can be enhanced by expanding the color range: e.g., if the color range from 4-35 was expanded to 0-255 (5 bit expanded to 8 bit), any RGB change less than 4 would be treated as background noise and ignored, while changes greater than 35 would map to 255.
Figure 1.
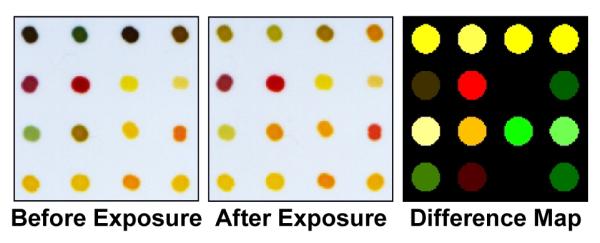
Digital images of the colorimetric sensor array before and after 5 min. exposure to 25 mM D-fructose. Subtraction of the two images (red minus red, green minus green, blue minus blue) yields a difference vector (right) in 48 dimensions. For display purposes only, the color range of the difference map has been expanded from 5 to 8 bits (i.e., an RGB range of 4-35 is shown expanded to 0-255).
RESULTS AND DISCUSSION
For our colorimetric sensor arrays, molecular recognition of an analyte is a function of intermolecular interactions between the analyte (or its byproducts) and the chromogenic center. Our previously reported colorimetric sensing platforms have consisted of arrays of chemically diverse, cross-responsive dyes that include metal-ion containing dyes, Brønsted acidic or basic dyes (i.e., pH indicators), and dyes with large permanent dipoles (i.e., solvatochromic dyes). These hydrophobic colorants were printed on a hydrophobic membrane to minimize the humidity effect. This technique was quite effective in the detection and quantification of volatile organic gases, but for water soluble analytes, this hydrophobic sensing platform is problematic. To overcome this limitation, we have now made sensor arrays from nanoporous pigments made by the immobilization of various colorants (cf. SI Table S2) into porous ormosils printed on a hydrophilic membrane. This technique has resulted in an array that is both highly sensitive and rapidly responsive to aqueous analytes.
Methods of Detection
The selective association of boronic acids with diols has been extensively studied.14 By taking advantage of this reactivity, several groups have developed effective methods to discriminate among different sugars. Selectivity relies in part on differences in association constants of boronic acids with diols,15 which results in changes in solution pH (Scheme 1). Arylboronic acids, in particular, have shown the greatest affinity for sugars, in fact new arylboronic acid compounds have been developed specifically to detect specific sugars at various pHs.16 In addition, these boronic acid compounds can be combined with color-changing pH indicators or be functionalized to report a color change upon complexation with diols.17;18
Scheme 1.
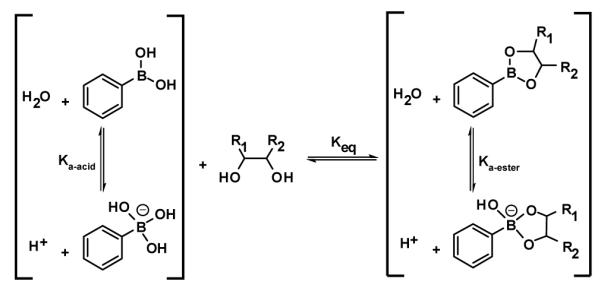
Diol adducts of phenylboronic acid
For sugars, our sensing assembly relies in part on a selective association of boronic acid and a diol, which generally lowers the solution pH upon complexation (Scheme 1). Other observable interactions of these complexes, however, can also be useful toward the detection of diol-containing compounds, including the inherent pKa values associated with the boronic acid-diol complexes themselves. In addition, the inherent pKa values of artificial sweeteners assist in their discrimination by lowering (e.g., saccharin and aspartame) or increasing (e.g., sodium cyclamate and potassium acesulfame) the solution pH as well as participating in other non-pH related analyte-dye interactions (i.e., Lewis acid-base, dipolar, π-π, etc.).
Since our detection method partially depends on the changing pH, we have chosen to weakly buffer our system to protect against small changes in pH associated with absorption of CO2 or other gases that can act to lower or raise the baseline pH (7.45). A similar technique has been employed by Chang and co-workers, who have reported the successful detection and discrimination in solution multi-well plates of a number of saccharides using two boronic acids reacting with analyte concentrations of 100 mM.18
By controlling the hydrophilicity and pore size of the sol-gel matrix, in conjunction with printing onto a hydrophilic membrane, we have achieved rapid response times for most analytes. To study the overall response times of our array, we have conducted several experiments that allowed us to track the total Euclidean distance change (the square root of the sum of the squares of each color change of 16 pigments) as a function of time. In nearly all cases > 90% of the total color change was completed at or before the 3 minute scans (most even by 2 minutes). The overall responses versus time to a series of analytes commonly used as sweeteners (i.e. sorbitol, mannitol, xylitol), as well as artificial sweeteners commonly added to foods (i.e. saccharin, aspartame) are shown in SI Figures S1-S2.
Discrimination of Natural and Artificial Sweeteners
In order to demonstrate the abilities of the current colorimetric sensor array, 14 naturally occurring and artificially produced sweeteners were tested. These compounds can be separated into three categories (cf. SI Table S3 for chemical structures): (1) natural sugars (i.e., D-glucose, D-fructose, etc.), (2) sugar alcohols (i.e., xylitol, sorbitol, etc.), and (3) artificial sweeteners (i.e., aspartame, saccharin, etc.). The last category, artificial sweeteners, consists of sweeteners with a variety of functionalities (e.g., sulfonates, sulfonylamides, and sulfonamides), none of which contain diol functionality. The last artificial sweetener in the group, aspartame, is a methyl ester of the dipeptide of the amino acids aspartic acid and phenylalanine. Each analyte was dissolved in a weakly buffered (1 mM) phosphate buffer at pH 7.45 with 5 mM 3-nitrophenylboronic acid to afford a 25 mM analyte solution (additional analysis of analytes with varying concentrations is discussed later). The array was allowed to equilibrate with a blank phosphate/boronic acid solution for 1 minute to allow for a “before” image to be obtained. Immediately upon scanning, the blank was exchanged with the analyte solution; scans were taken every minute for 5 minutes to ensure full equilibration, and the 5 minute scan used as the “after” image.
The representative difference maps for the 14 different natural and artificial sweeteners can be seen in Figure 2. In nearly all cases, the pH of the analyte solution was depressed in relation to the blank solution pH of 7.45. The two exceptions, sodium cyclamate and potassium acesulfame, neither of which can participate in boronic acid-diol complexation, are salts of relatively weak acids and raise the solution pH to ~8. One drawback to using difference maps alone to discriminate among several analytes is that inherently the difference map only shows the magnitude of the color change, but does not show the direction of that change. Therefore, two analytes that are quite different can show very similar difference maps. Therefore, the high dispersion of the colorimetric sensor array data requires a classification algorithm that takes advantage of the full dimensionality of the data.
Figure 2.
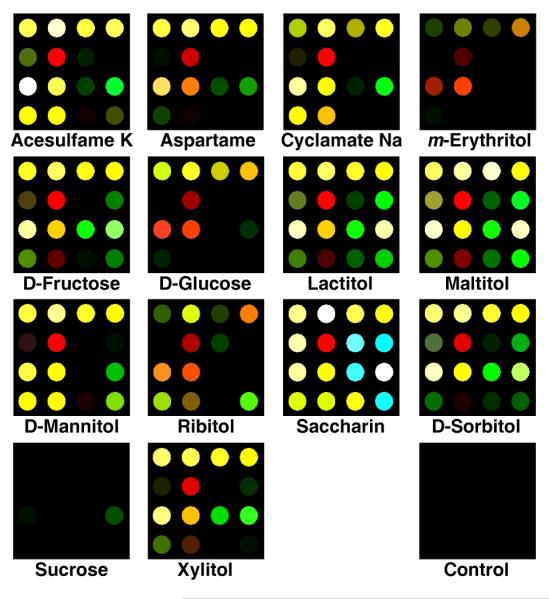
Color difference maps of 14 natural and artificial sweeteners and one control after equilibration at 25 mM concentration (except sucrose at 75 mM). For display purposes, the color range is expanded from 4 to 8 bits per color (RGB range of 3-18 expanded to 0-255).
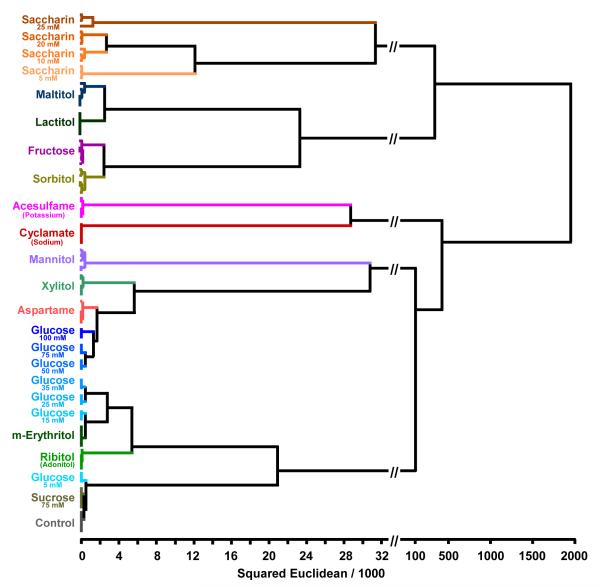
A simple and model-free approach is hierarchical cluster analysis (HCA).19 The HCA forms dendrograms based on clustering of the array response data in the 48-dimentional ΔRGB color space. Hierarchical clustering analysis for the 14 separate natural and artificial sweetener analytes plus one control can be seen in Figure 3. To support the aforementioned hypothesis that two test solutions that differ only in concentration can, in fact, be treated as separate analytes, multiple concentrations of two sweeteners, D-glucose and saccharin, were analyzed. Each analyte name represents quintuplicate trials with the exception of those analytes that were run at variable concentrations which represent triplicate trials. Amazingly, for the 100 total cases, there were no errors and zero misclassifications (full digital data bases of the observed changes in RGB values are given in SI Table S4).
Figure 3.
Hierarchical cluster analysis for 14 separate analytes (including triplicate runs of two representative analytes of varying concentrations) and one control. With the exception of D-glucose and saccharin, each analyte name represents quintuplicate runs. There were no errors and zero misclassifications in 100 total trials.
Discrimination of Individual Serving Sweetener Packets
To further test the array’s capabilities, a number of commonly accessible, single-serving sweetener packets were tested. The sweeteners included: Sweet’N Low®, Equal®, Splenda®, Stevita®, Domino® sugar, and Sugar in the Raw®. One packet of each analyte was added to 4 oz. (~120 mL) of weakly buffered boronic acid solution (see previous section for details). In the cases of Sweet’N Low®, Equal®, Splenda®, and Stevita®, one packet contains one net g of product, while Domino® sugar and Sugar in the Raw® contain ~3.5 g and ~4.2 g, respectively. The sweeteners were used as received, and allowed to stir for >1 hour to ensure dissolution.
As before, difference maps were obtained for the sweetner packets using the full digital database (SI Table S5), as shown in Figure 4. Once again, the color range has been expanded for the purposes of visualization. The methods for discrimination among this set of analytes are three-fold: (1) the inherent pKa values of the active “sweetening” agent (i.e., aspartame in Equal®), (2) differing amounts of dextrose (D-glucose), or sucrose included in each packet that can bind to the boronic acid, and (3) different bulking and anti-caking agents added to each packet that can themselves act as buffers. To further show the discriminating power of our array, a hierarchical dendrogram of the triplicate runs of the aforementioned six analytes and one control can be seen in Figure 5.
Figure 4.
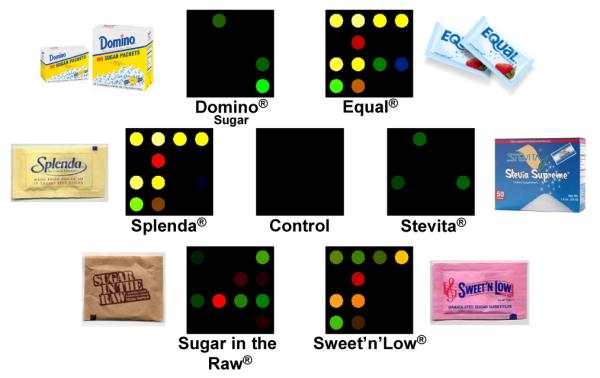
Color difference maps for 6 commonly used natural and artificial sweetener packets and one control. One packet of each analyte was dissolved in 4 oz. of weakly buffered 5 mM 3-nitrophenylboronic acid solution (pH 7.45) and scanned for 5 minutes after exposure. The color range is expanded from 3 to 8 bits per color (RGB range of 3-10 expanded to 0-255).
Figure 5.
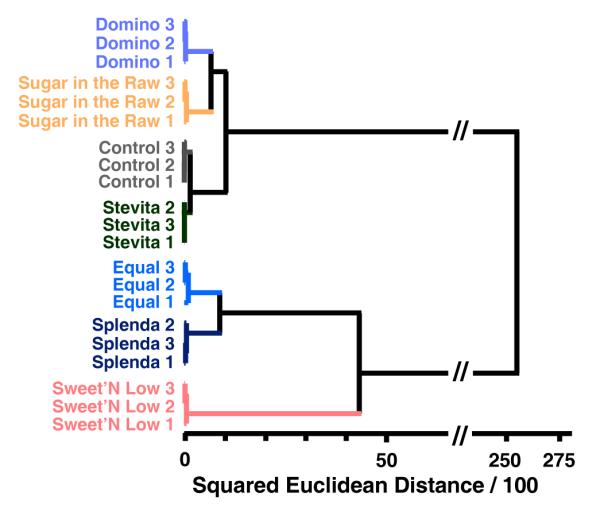
Hierarchical cluster analysis dendrogram for 6 commonly used natural and artificial sweetener packets (1 packet per 4 oz. weakly buffered pH 7.45 3-nitrophenylboronic acid solution). Experiments were run in triplicate (after the sugar name, the trial number is given).
As a additional exercise, we compared the arrays response to two aqueous samples, each containing 36 mg. of saccharin. The solutions were made using one packet of Sweet’N Low® brand sweetener and saccharin purchased from Aldrich. It can be easily seen by eye (Figure 6) that our array responds differently to the two samples with the lower overall response being to the packeted sweetener, presumably due to the added ingredients.
Figure 6.
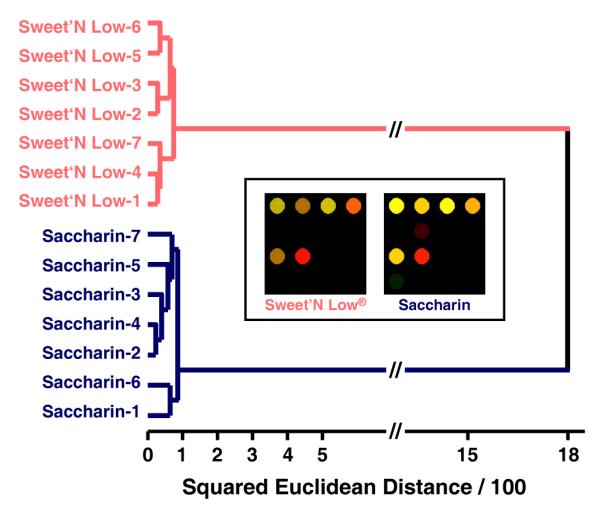
Hierarchical cluster analysis and color difference maps (inset shows averages) of septuplicate trials of two saccharin solutions, one made using Sweet’N Low® brand sweetener (1 individual serving packet) and the other using the same amount (36 mg) of pure saccharin from Aldrich. Each was dissolved in 4 oz of weakly buffered 5 mM 3-nitrophenylboronic acid solution (pH 7.45) and scanned after 5 minutes. The color range is expanded from 4 to 8 bits per color (RGB range of 3-18 expanded to 0-255).
Sweetener Infused Tea
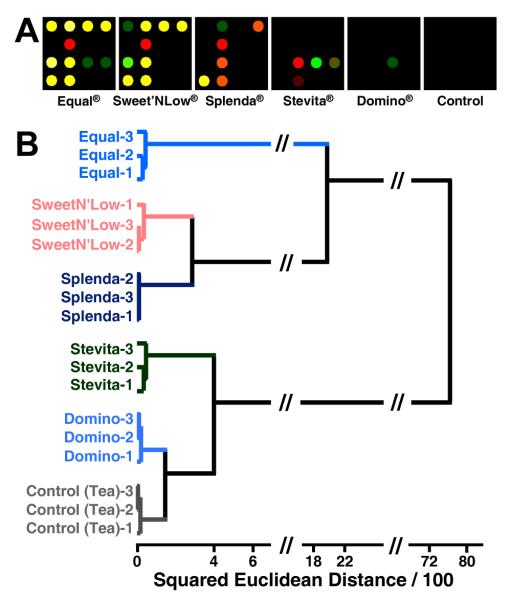
In an attempt to simultaneously test the array against possible interferents as well as bring in “real-world” applications, we sought to discriminate among store-bought teas that had been sweetened using a common individual serving packets of various sweeteners. Each experiment was conducted by dissolving a sweetener in hot tea and allowing the tea-sweetener mixture to cool to room temperature; unsweetened tea was used as the blank (control). An HCA dendrogram along with difference maps which show the average response of triplicate runs of each sweetener are shown in Figure 7. As expected, Domino® sugar showed very little response due to the absence of strong boronic acid-diol interactions with the dominant ingredient (sucrose). The sweetener, Equal®, once again showed the greatest response, likely due to the lack of anti-caking agents such as calcium-silicate or cream of tartar (potassium bitartrate) that can themselves act as buffers, thereby slowing or preventing the color-change of many pH indicators. The HCA shows excellent discrimination among each of the analytes (note that Sugar in the Raw® was left out as response was too close to noise level to be reliable).
Figure 7.
A. Color difference maps (RGB range of 4-7 expanded to 0-255) and B. Hierarchical cluster analysis for 4 oz. (~120 mL) tea infused with 1 packet of each sweetener, plus one control. As always, the difference between the “before” and 5 minutes “after” data scans are measured.
Principal Components Analysis
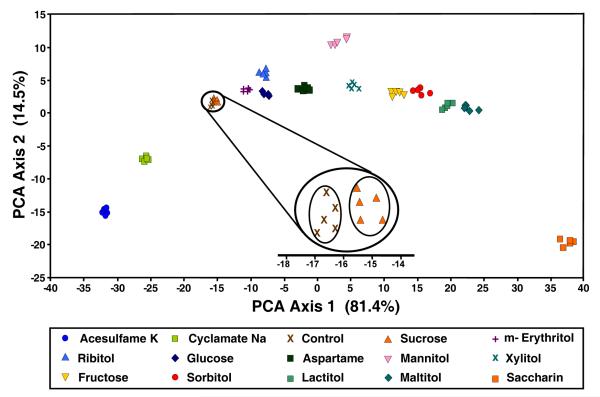
Principal components analysis19 (PCA) can be used to extract variance among entries in a set of data via mathematical transformations. In this case, data points in the form of changes in RGB values for all analytes are considered and a set of orthogonal eigenvectors (i.e., principal components) are generated so as to maximize the variance in as few dimensions as possible. The maximum number of principal components is equal to 3N-1, where N is the number of dyes in the array. The PCA scores help to define the dimensionality of a given array. One can often use just the first two or three most important principal components to produce a PCA score plot to show clustering of similar analytes. Examples of two-dimensional score plots are shown in Figures 8 and 9 and display impressive discrimination among the sweeteners.
Figure 8.
PCA score plot using the two most important principal components. Each cluster represents one of 14 sweeteners or one control. Quintuplicate trials were run for each analyte.
Figure 9.
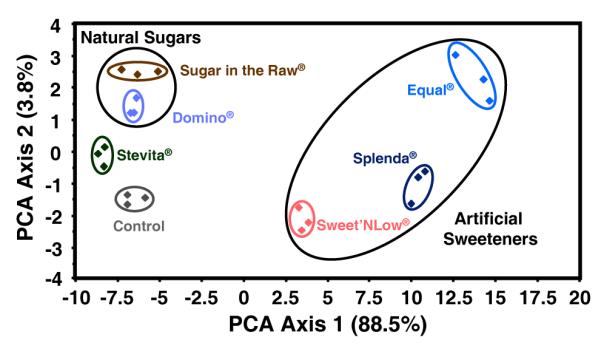
Principal components analysis score plot for 6 commonly used natural and artificial sweeteners. Interestingly, two obvious patterns emerge: (1) the close relationship among natural sugars, and (2) the proximity of all three “artificially produced” sweeteners. Experiments were run in triplicate.
The variance localized in each principal component can be graphed to produce a “scree” plot to assess the arrays overall dimensionality (c.f. SI Figures S3-S4). The scree plot from a principal components analysis for the detection and identification of fourteen natural and artificial sweeteners required four dimensions to define 99% of the total variance and for the individual serving packets of six different sweeteners eight dimensions were required for 99% of the total variance. Linear discriminant analysis (LDA) gave general agreement with the PCA with respect to the array’s overall dimensionality (SI Figures S5-S6). By examining the classification error rates for LDA as a function of increasing numbers of principal components (using a “leave-one-out” cross validation), the error rate becomes zero at seven dimensions for the fourteen natural and artificial sweeteners and at four dimensions for the individual serving packets.
Reproducibility and Shelf-Life
To demonstrate the array’s reproducibility, an example of each class of analyte was chosen. Five trials were run using arrays from several batches, printed on different days. In order to show the reproducibility regardless of analyte strength, a weakly responding analyte, Stevita® (a pre-packeted sweetener), a moderately responding analyte, aspartame (an artificial sweetener used in soft-drinks as well as Equal® brand sweetener), and a relatively strong responding sugar-alcohol, mannitol, were selected. Figure 10 shows the difference maps of each of the five trials run for each analyte. It is obvious, even by eye, that the trials for each sweetener are considerably similar to one another, and significantly different from analyte to analyte.
Figure 10.
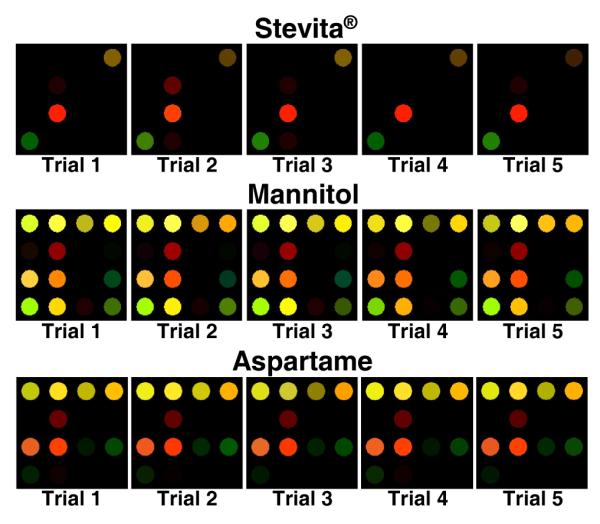
Color difference maps showing quintuplicate trials of each of three classes of sweeteners,. Each was performed using arrays from different print batches. The color range is expanded from 4 to 8 bits per color (RGB range of 3-18 expanded to 0-255).
It has been previously shown that the arrays show little or no difference from batch to batch; just as important is the reproducibility of the array from day to day. Therefore, we conducted a series of experiments to specifically test the array’s response over the course of several weeks. Arrays were printed in the manner discussed earlier and allowed to cure for three days. Triplicate runs for each of three analytes (chosen randomly) were conducted every 48 hours for 21 days; excellent reproducibility was observed, as shown in Figure 11. A more quantitative comparison was done using HCA and extremely close clustering was observed among septuplicate trials of each analyte with a very large relative separation among the different analytes, as shown in the HCA dendrogram in Figure 12.
Figure 11.
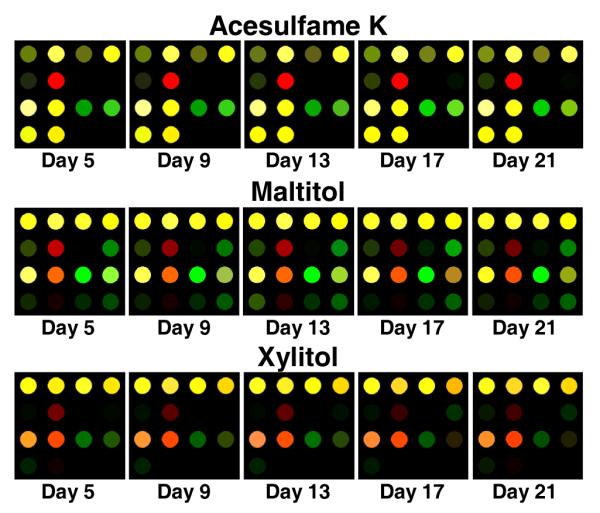
Color difference maps displaying the shelf-life of the array. The caption under each image shows the number of days after which the arrays were printed that each trial was performed. The color range is expanded from 4 to 8 bits. To the eye, the arrays appear stable for > 3 weeks. Further tests to ensure longer-term stability are underway.
Figure 12.
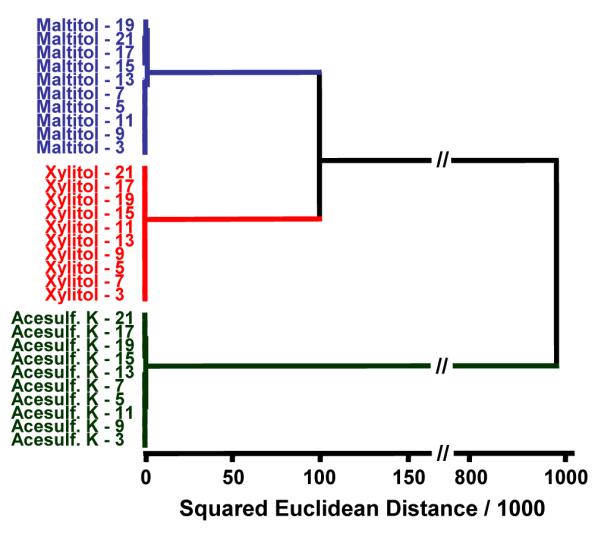
Hierarchical cluster analysis dendrogram showing overall array shelf-life (up to 3 weeks). Next to each analyte is a number representing the number of days of aging that were allowed prior to testing. Very little variance within each analyte cluster is observed.
CONCLUSION
We have designed a disposable colorimetric sensor array capable of the detection and discrimination of a large number of commonly used natural and artificial sweeteners. The array is composed of a series of ormosil encapsulated pigments immobilized on a hydrophilic, porous membrane. This entrapment technique allows for rapid interactions between aqueous analytes (or their byproducts) and the hydrophilic indicators, while allowing virtually no leaching, thereby affording fast and reproducible responses. The array performs well in the presence of aqueous interferents and has shown excellent stability, even over several weeks. In addition, the array has shown the capability of analyzing real-world samples at real-world concentrations.
Supplementary Material
ACKNOWLEDGMENTS
This work was supported through the NIH Genes, Environment and Health Initiative through award U01ES016011.
Footnotes
SUPPORTING INFORMATION AVAILABLE Array response and chemometric data as well as lists of indicators and analyte structures are available free of charge via the Internet at http://pubs.acs.org.
REFERENCES
- (1) (a).Albert KJ, Lewis NS, Schauer CL, Sotzing GA, Stitzel SE, Vaid TP, Walt DR. Chem. Rev. 2000;100:2595–2626. doi: 10.1021/cr980102w. [DOI] [PubMed] [Google Scholar]; (b) Anslyn EV. J. Org. Chem. 2007;72:687–699. doi: 10.1021/jo0617971. [DOI] [PubMed] [Google Scholar]; (c) Gardner JW, Bartlett PN. Electronic Noses: Principles and Applications. Oxford University Press; New York: 1999. [Google Scholar]; (d) Johnson BA, Leon M. J. Comp. Neurol. 2007;503:1–34. doi: 10.1002/cne.21396. [DOI] [PMC free article] [PubMed] [Google Scholar]; (e) Lewis NS. Acc . Chem. Res. 2004;37:663–672. doi: 10.1021/ar030120m. [DOI] [PubMed] [Google Scholar]
- (2) (a).Anand V, Kataria M, Kukkar V, Saharan V, Choudhury PK. Drug Discovery Today. 2007;12:257–265. doi: 10.1016/j.drudis.2007.01.010. [DOI] [PubMed] [Google Scholar]; (b) Toko K. Biomimetic Sensor Technology. Cambridge University Press; Cambridge, UK: 2000. [Google Scholar]
- (3).Lange U, Roznyatovskaya NV, Mirsky VM. Anal. Chim. Acta. 2008;614:1–26. doi: 10.1016/j.aca.2008.02.068. [DOI] [PubMed] [Google Scholar]
- (4).Wolfrum EJ, Meglen RM, Peterson D, Sluiter J. Sens. Actuators, B. 2006;B115:322–329. [Google Scholar]
- (5) (a).Janzen MC, Ponder JB, Bailey DP, Ingison CK, Suslick KS. Anal. Chem. 2006;78:3591–3600. doi: 10.1021/ac052111s. [DOI] [PubMed] [Google Scholar]; (b) Rakow NA, Sen A, Janzen MC, Ponder JB, Suslick KS. Angew. Chem. Int. Ed. 2005;44:4528–4532. doi: 10.1002/anie.200500939. [DOI] [PubMed] [Google Scholar]; (c) Suslick KS. MRS Bulletin. 2004;29:720–725. doi: 10.1557/mrs2004.209. [DOI] [PubMed] [Google Scholar]; (d) Rakow NA, Suslick KS. Nature. 2000;406:710–713. doi: 10.1038/35021028. [DOI] [PubMed] [Google Scholar]; (e) Suslick KS, Bailey DP, Ingison CK, Janzen M, Kosal MA, McNamara WB, III, Rakow NA, Sen A, Weaver JJ, Wilson JB, Zhang C, Nakagaki S. Quimica Nova. 2007;30:677–681. [Google Scholar]; (f) Suslick KS, Rakow NA, Sen A. Tetrahedron. 2004;60:11133–11138. [Google Scholar]
- (6) (a).Zhang C, Bailey DP, Suslick KS. J. Agric. Food Chem. 2006;54:4925–4931. doi: 10.1021/jf060110a. [DOI] [PubMed] [Google Scholar]; (b) Zhang C, Suslick KS. J. Agric. Food Chem. 2007;55:237–242. doi: 10.1021/jf0624695. [DOI] [PubMed] [Google Scholar]; (c) Zhang C, Suslick KS. J. Am. Chem. Soc. 2005;127:11548–11549. doi: 10.1021/ja052606z. [DOI] [PubMed] [Google Scholar]
- (7) (a).Klotz M, Ayral A, Guizard C, Cot L. Bull. Korean Chem. Soc. 1999;20:879–884. [Google Scholar]; (b) Mac Craith BD, Mc Donagh C, McEvoy AK, Butler T, O’Keeffe G, Murphy V. J. Sol-Gel Sci. Technol. 1997;8:1053–1061. [Google Scholar]; (c) McDonagh C, MacCraith BD, McEvoy AK. Anal. Chem. 1998;70:45–50. doi: 10.1021/ac970461b. [DOI] [PubMed] [Google Scholar]; (d) Sanchez-Barragan I, Costa-Fernandez JM, Sanz-Medel A. Sens. Actuators, B. 2005;B107:69–76. [Google Scholar]
- (8).Lim SH, Musto CJ, Park E, Zhong W, Suslick KS. Org. Lett. 2008;10:4405–4408. doi: 10.1021/ol801459k. [DOI] [PMC free article] [PubMed] [Google Scholar]
- (9).Ruprecht W. J. Evol. Econ. 2005;15:247–272. [Google Scholar]
- (10).Mattes RD, Popkin BM. American Journal of Clinical Nutrition. 2009;89:1–14. doi: 10.3945/ajcn.2008.26792. [DOI] [PMC free article] [PubMed] [Google Scholar]
- (11).Heller L. [accessed 04/25/2009];Sugar demand rising at expense of sweeteners, claims sugar industry. 2005 Nov 16; http://www.foodnavigator-usa.com/Financial-Industry/Sugar-demand-rising-at-expense-of-sweeteners-claims-sugar-industry.
- (12).Prance L. [accessed 4/28/2009];Obesity concerns drive artificial sweetener market. 2007 Jul 26; http://www.foodnavigator-usa.com/Financial-Industry/Obesity-concerns-drive-artificial-sweetener-market.
- (13) (a).Buchgraber M, Wasik A. Journal of AOAC International. 2009;92:208–222. [PubMed] [Google Scholar]; (b) Filho J. Carloni, Santini AO, Nasser ALM, Pezza HR, de Oliveira J. Eduardo, Melios CB, Pezza L. Food Chem. 2003;83:297–301. [Google Scholar]; (c) Chen Q.-c., Mou S.-f., Liu K.-n., Yang Z.-y., Ni Z.-m. J. Chromatogr. A. 1997;771:135–143. [Google Scholar]; (d) Chen Q-C, Wang J. J. Chromatogr. A. 2001;937:57–64. doi: 10.1016/s0021-9673(01)01306-1. [DOI] [PubMed] [Google Scholar]; (e) Galletti GC, Bocchini P, Gioacchini AM, Roda A. Rapid Commun. Mass Spectrom. 1996;10:1153–1155. [Google Scholar]; (f) James TD, Shinmori H, Shinkai S. Chem. Commun. 1997:71–72. [Google Scholar]; (g) Qu F, Qi Z-H, Liu K-N, Mou S-F. J. Chromatogr. A. 1999;850:277–281. doi: 10.1016/s0021-9673(99)00624-x. [DOI] [PubMed] [Google Scholar]; (h) Wasik A, McCourt J, Buchgraber M. J. Chromatogr. A. 2007;1157:187–196. doi: 10.1016/j.chroma.2007.04.068. [DOI] [PubMed] [Google Scholar]; (i) Zhao J, James TD. J. Mater. Chem. 2005;15:2896–2901. [Google Scholar]; (j) Zhu Y, Guo Y, Ye M, James FS. J. Chromatogr. A. 2005;1085:143–146. doi: 10.1016/j.chroma.2004.12.042. [DOI] [PubMed] [Google Scholar]; (k) Yang D.-j., Chen B. Journal of Agricultural and Food Chemistry. 2009;57:3022–3027. doi: 10.1021/jf803988u. [DOI] [PubMed] [Google Scholar]
- (14) (a).James TD, Sandanayake KRAS, Shinkai S. Angew. Chem. Int. Ed. 1996;35:1911–1922. [Google Scholar]; (b) Wang W, Gao X, Wang B. Curr. Org. Chem. 2002;6:1285–1317. [Google Scholar]
- (15) (a).Springsteen G, Wang B. Tetrahedron. 2002;58:5291–5300. [Google Scholar]; (b) Yan J, Springsteen G, Deeter S, Wang B. Tetrahedron. 2004;60:11205–11209. [Google Scholar]
- (16) (a).Dowlut M, Hall DG. J. Am. Chem. Soc. 2006;128:4226–4227. doi: 10.1021/ja057798c. [DOI] [PubMed] [Google Scholar]; (b) Mulla HR, Agard NJ, Basu A. Bioorg. Med. Chem. Lett. 2004;14:25–27. doi: 10.1016/j.bmcl.2003.10.017. [DOI] [PubMed] [Google Scholar]; (c) Ni W, Fang H, Springsteen G, Wang B. J. Org. Chem. 2004;69:1999–2007. doi: 10.1021/jo0350357. [DOI] [PubMed] [Google Scholar]
- (17) (a).Boduroglu S, El Khoury JM, Reddy DV, Rinaldi PL, Hu J. Bioorg. Med. Chem. Lett. 2005;15:3974–3977. doi: 10.1016/j.bmcl.2005.05.075. [DOI] [PubMed] [Google Scholar]; (b) Edwards NY, Sager TW, McDevitt JT, Anslyn EV. J. Am. Chem. Soc. 2007;129:13575–13583. doi: 10.1021/ja073939u. [DOI] [PubMed] [Google Scholar]; (c) Kim YH,SA, Weissleder R, Tung C-H. Chem. Commun. 2007:2299–2301. doi: 10.1039/b700741h. [DOI] [PubMed] [Google Scholar]; (d) Schiller A, Wessling RA, Singaram B. Angew. Chem. Int. Ed. 2007;46:6457–6459. doi: 10.1002/anie.200701888. [DOI] [PubMed] [Google Scholar]; (e) Zhang T, Anslyn EV. Org. Lett. 2006;8:1649–1652. doi: 10.1021/ol060279+. [DOI] [PubMed] [Google Scholar]
- (18).Lee JW, Lee J-S, Chang Y-T. Angew. Chem. Int. Ed. 2006;45:6485–6487. doi: 10.1002/anie.200602055. [DOI] [PubMed] [Google Scholar]
- (19) (a).Hair JF, Black B, Babin B, Anderson RE, Tatham RL. Multivariate Data Analysis. 6th ed Prentice Hall; New York: 2005. [Google Scholar]; (b) Hasswell S. Practical Guide To Chemometrics. Dekker; New York: 1992. [Google Scholar]; (c) Johnson RA, Wichern DW. Applied Multivariate Statistical Analysis. 6th ed Prentice Hall; New York: 2007. [Google Scholar]; (d) Scott SM, James D, Ali Z. Microchim. Acta. 2007;156:183–207. [Google Scholar]
Associated Data
This section collects any data citations, data availability statements, or supplementary materials included in this article.


