

Abstract
Most tumors of patients with Lynch syndrome and a fraction of sporadic colorectal cancers (CRCs) exhibit high levels of microsatellite instability (MSI) at mono- and dinucleotide repeat loci. A different type of instability, elevated microsatellite alterations at selected tetranucleotide repeats (EMAST) has been found in non-colonic cancers. Our previous study demonstrated that EMAST is common in sporadic CRC. Here, we focused on the relationships between EMAST and other genomic instability parameters or clinicopathological features in an unselected series of 88 sporadic CRCs. Of the tumors in the sample, 4 (4.5%) were MSI-high (MSI-H), 9 (10.2%) were MSI-low (MSI-L) and 75 (85.2%) were microsatellite stable. EMAST status was determined using 7 EMAST markers. Fifty-three (60.2%) tumors without MSI-H showed instability at ≥1 EMAST loci. All 4 MSI-H tumors showed instability at several EMAST loci. Instability profiles of MSI-H tumors at EMAST loci were more complex than those of non-MSI-H tumors. A tendency of positive association was observed between MSI-L and EMAST (P=0.023). The frequency of loss of heterozygosity (LOH) for the 14 loci in EMAST-positive tumors was significantly higher than negative tumors (P=0.048). Among the clinicopathological parameters, only tumor location at the distal colon was associated with EMAST-negative tumors (P=0.0084, one-tailed). A relatively higher frequency of well-differentiated adenocarcinomas was observed in EMAST tumors as opposed to non-EMAST tumors, though the survival rate was similar. These results suggest that overlapping mechanisms that cause MSI-L, EMAST and LOH in CRCs may exist.
Keywords: elevated microsatellite alterations at selected tetranucleotide repeats, microsatellite instability, chromosomal instability, loss of heterozygosity, colorectal cancer
Introduction
Microsatellite instability (MSI) is a hallmark of mismatch repair deficiency. A high degree of MSI (MSI-H) is found in tumors of patients with Lynch syndrome and in a fraction of sporadic CRCs (1-3). Susceptibility to CRC in the majority of Lynch syndrome patients results from the germline mutation in one of the MMR genes, hMSH2 or hMLH1 (4). A somatic inactivation of hMSH2 or hMLH1 in a tumor progenitor cell disables DNA mismatch repair and causes genetic instability. A panel of 5 markers recommended by the National Cancer Institute (NCI) (Bethesda) guidelines has been widely used to efficiently detect CRCs with MMR-deficiency (3). MSI-H, defined as having instability in ≥2 loci (≥2/5 or ≥30% when >5 markers were used), is well associated with inactivation of hMSH2 or hMLH1. Around 15% of sporadic CRC exhibit MSI-H due to silencing of the hMLH1 locus by promoter hypermethylation (5). The rest of CRCs (non-MSI-H) exhibits low levels of MSI (MSI-L) or microsatellite-stable (MSS). Some MSI-L CRCs can be explained by loss of hMSH6 (6). However, the molecular basis and biological significance of a majority of MSI-L are not known.
A distinct form of MSI was observed in several types of cancers and designated as EMAST for ‘elevated microsatellite alterations at selected tetranucleotide repeats’ (7). Though instability at tetranucleotide repeat loci is observed either independently or in combination with instability at mono- and dinucleotide repeat loci, the term EMAST indicates a phenomenon independent of MSI-H. EMAST has been reported with varying frequency in a variety of cancers including non-small cell lung cancer (NSCLC) (7,8), cancers of the head and neck (8), bladder (8-10), kidney (8), non-melanoma skin (9), prostate (11) and serous ovarian (12). However, the incidence of EMAST and its biological significance in CRC are not clear. In our previous study mainly using a CRC cohort collected from the US population, we demonstrated that EMAST is common in sporadic CRC and EMAST and MSI-L associated with EMAST are due to deficiency in MSH3 in cell lines (13). Furthermore, EMAST and MSI-L are significantly associated with down-regulation of MSH3 in CRC tissues. In this study, we expanded our sample using CRC from a Japanese population to determine whether EMAST is common in another genetic background and to identify the molecular and clinicopathological parameters associated with EMAST.
Materials and methods
DNA samples
Genomic DNA was extracted from the paired fresh-frozen tumor and normal mucosa of 88 Japanese patients with sporadic CRC at the Department of Surgery, Toho University Ohmori Hospital from 1993 to 2001 using a phenol-chloroform method with proteinase K digestion (14). The tumors, 87 primary and 1 recurrent, were classified by the Amsterdam criteria for hereditary non-polyposis colorectal cancer (HNPCC) (15,16). Clinicopathological data of patients were collected from medical records using the Japanese classification of colorectal carcinoma (17). The patients constituted an unselected population for any clinicopathological feature, personal or familial history of cancer, or genetic feature. DNA from 61 patients with 59 primary and 2 recurrent CRCs in another cohort was used for further study of the relationship between MSI-L and EMAST. For DNA samples used here informed consent was obtained from the patients.
MSI, EMAST and LOH analyses
The 17 sets of primers used and details such as the reference for sequences are shown in Table I (2,8,18,19). Polymerase chain reaction (PCR) was performed as described previously for the TP53Alu marker (20) with the following modifications: 10 mM Tris-HCl (pH 8.3); 0.625 U Taq DNA polymerase; and 25 ng of genomic DNA in a total volume of 25 μl and 30 thermal cycles. For BAT25, D2S123 and D17S250, the N,N,N′,N′-tetramethyl-6-carboxyrhodamine (TAMURA)-labeled forward-primer was used instead of the HEX-labeled one. For the TBP and CSF1R markers, 0.1 and 0.3 μM each primer were used to improve the specificity of amplification.
Table I.
Characteristics of the locus markers.
| Marker (another name) | Primary repeat sequencea | Chromosomal locationa | Genetic alteration determined | Reference for primer sequences | PCR annealing temperature | Approximately size, bp | Heterozygosityb |
|---|---|---|---|---|---|---|---|
| Mononucleotide | |||||||
| BAT25 | (A)25 | 4q12 | MSI | GDB | 58°C | 125 | N/A |
| BAT26 | (A)26 | 2p16 | MSI | GDB | 58°C | 121 | N/A |
| Dinucleotide | |||||||
| D2S123 (AFM093xh3) | (CA)21 | 2p16 | MSI, LOH | GDB | 60°C | 211 | 0.86 |
| D5S346 (APC) | (CA)26 | 5q21-22 | MSI, LOH | (2) | 55°C | 110 | 0.45 |
| D17S250 (Mfd15) | (CA)24 | 17q11.2-12 | MSI, LOH | GDB | 53°C | 159 | 0.74 |
| D18S64c (AFM212xg5) | (CA)16 | 18q21.32 | MSI, LOH | GDB | 58°C | 192 | 0.76 |
| D18S69 (AFM248yf1) | (CA)14 | 18q21.1-21.31 | MSI, LOH | (2) | 58°C | 124 | 0.67 |
| Trinucleotide | |||||||
| D7S1794 (CHLC.CTT8) | (AAG)16 | 5q14 | Instability, LOH | GDB | 55°C | 207 | 0.82 |
| TBP | (CAG)38 | 6q27 | Instability, LOH | This study | 60°C | 202 | 0.53 |
| Tetranucleotide | |||||||
| MYCL1d(MYCL1.PCR2) | (AAAG)14 | 1p32 | Instability, LOH | (2) | 55°C | 182 | 0.78 |
| L17686 (UT5085) | (AAAG)29 | 7q31 | Instability, LOH | (8) | 58°C | 366 | 0.94 |
| UT5320 (241A/241B) | (AAAG)21 | 8q24.13-24.3 | Instability, LOH | (8) | 60°C | 265 | 0.90 |
| D9S242 (UT914) | (AAAG)18 | 9q32-33 | Instability, LOH | GDB | 56°C | 178 | 0.90 |
| D11S488e(8D1-F/8D1-R) | (AAAG)15 | 11q24.1-25 | Instability, LOH | GDB | 55°C | 258 | 0.90 |
| D20S82 (RM267) | (AAAG)10 | 20p | Instability, LOH | GDB | 60°C | 227 | 0.78 |
| CSF1R (CSF1R.PCR4) | (ATAG)12 | 5q33.3-34 | Instability, LOH | GDB | 58°C | 192 | 0.66 |
| Pentanucleotide | |||||||
| TP53Alu | (AAAAT)8 | 17p13.1 | Instability, LOH | (18) | 58°C | 404 | 0.51 |
N/A, not applicable.
Based on previous studies (2,8,18,19). The databases as follows: the GDB Human Genome Database at http://www.gdb.org; and the Entrez databases such as Nucleotide, SNP and UniSTS in the National Center for Biotechnology Information (NCBI) at http://www.ncbi.nlm.nih.gov.
Determined in the normal DNA of 88 Japanese patients with sporadic colorectal cancer.
The primer set consisting of AFM212xg5a and AFM212xg5m was used.
MYCL1 also contains an (A)8 mononucleotide repeat-tract.
D11S488 also contains (AAGG)n repeats.
The two-fluorescein method was performed as described previously (20). Briefly, the PCR product derived from tumor DNA using the 6-FAM-labeled forward-primer was mixed with that derived from normal DNA using the HEX- or TAMURA-labeled forward-primer (typically 1:3, v/v). The mixed PCR products were analyzed in the presence of the GeneScan 400HD ROX Size Standard on the ABI PRISM 373S DNA Sequencer (Applied Biosystems, Foster City, CA) with the 672 GeneScan Analysis Software or on the Applied Biosystems 3130xl Genetic analyzer with the GeneMapper Software as recommended by the manufacturer. When any aberrant peak(s) was seen in the electropherogram of tumor DNA as compared to that of the paired normal DNA, the locus was counted as exhibiting instability. For each locus with instability resulting in the status of MSI-L, PCR was repeated to confirm the result, because such instability was generally subtle. When the relative intensity of one allele in tumor DNA showed at least a 50% reduction as compared to the paired normal DNA, the locus was counted as exhibiting LOH. The locus with instability was excluded from the evaluation of LOH; in other words, such locus was counted as ‘not informative’ due to the presence of instability irrespective of the extent.
The MSI status of a tumor was determined using 7 markers including 5 markers from the reference panel (BAT25, BAT26, D2S123, D5S346 and D17S250) and 2 alternatives (D18S64 and D18S69) as outlined in the NCI (Bethesda) guidelines (3) and classified by the number of loci showing instability: ≥3/7, MSI-H; 1/7 or 2/7, MSI-L; and 0/7, microsatellite stable (MSS).
Seven EMAST markers consisting of 6 (AAAG)n-repeat types and one (ATAG)n-repeat type were used (Table I). Six markers (L17686, UT5320, D9S242, D11S488, D20S82 and CSF1R) were selected for their high frequencies of instability among 61 tetranucleotide repeat markers in NSCLC (8). MYCL1 is an (AAAG)n-repeat type marker used in upper urinary tract tumors (10). Concomitant tumors with the MSI-H phenotype were excluded from the EMAST classification.
LOH was determined for 14 loci using the 15 markers (D2S123, D5S346, D17S250, D18S64, D18S69, D7S1794, TBP, MYCL1, L17686, UT5320, D9S242, D11S488, D20S82, CSF1R and TP53Alu) (Table I). Of these, 4 markers are located in the vicinity of genes responsible for carcinogenesis: D5S346 near the adenomatous polyposis coli (APC) gene locus (5q21-22); TP53Alu in the p53 gene locus (17p13.1); and D18S69 and D18S64, of which region includes the DCC, SMAD2 and SMAD4 genes (18q21). The 18q21 region spanning D18S69 to D18S64 was regarded as one locus. The incidence of LOH in each population of tumors, designated as the ‘LOH frequency’, was calculated as follows: the number of loci showing LOH was divided by the number of informative loci. The frequency of LOH within each tumor, i.e. the ‘fractional allelic loss (FAL)’ value (21), was calculated for each tumor in the same manner as the LOH frequency. Since CRCs without the MSI-H phenotype lose an average of at least 25% of randomly chosen alleles (22), the FAL value was classified as follows: >0.25, FAL-high (H); >0 to ≤0.25, FAL-low (L); and 0, FAL-zero.
Statistical analysis
Analyses including calculations of standard deviations (SD), F tests, t tests and χ2 tests (for 2 × k contingency tables) were performed using the computer program Microsoft Excel X (Microsoft, Redmond, WA). Fisher's exact probability tests (for all 2×2 contingency tables) were performed with the computer program that was created and posted on the website (http://www.langsrud.com/fisher.htm) by Dr Øyvind Langsrud. The survival curves from the operation date for the primary tumor were estimated by using the Kaplan Meier method and compared by the log-rank tests. These analyses were performed with the Ekuseru-Toukei 2008 (Excel-Statistics 2008; Social Survey Research Information Co., Ltd., Tokyo). When n of each group was >50, P<0.05 was considered significant; and P<0.01 was taken for the case that n of each group was ≤50. All P-values were two-tailed unless otherwise stated.
Results and Discussion
EMAST in sporadic CRC
To determine whether EMAST exists in sporadic CRC in the Japanese population and to determine its relationship to MSI defined by markers with mono- and dinucleotide repeats, the MSI status of 88 tumors collected at Toho University Ohmori Hospital was first examined using 7 markers including 5 consensus MSI markers recommended by the NCI (Bethesda) guidelines (3). The results showed that the number of tumors showing MSI-H, MSI-L and MSS were 4 (4.5%), 9 (10.2%) and 75 (85.2%), respectively (Tables II, III and IV). These tumors were successively analyzed for instability at the 7 EMAST loci. The tetranucleotide instability was detected in 57 (64.8%) tumors. This includes all 4 MSI-H, 9 of the MSI-L tumors and 44 of the MSS tumors (Table II).
Table II.
EMAST status of 84 CRCs with MSI-L or MSS.
| Total | MSI-L | MSS | ||
|---|---|---|---|---|
| n | 84 | 9 | 75 | |
| EMAST | ||||
| Positive | Total | 53 (63.1)a | 9b (100) | 44b (58.7) (100) |
| ≥3 | 7 (8.3) | 2 (22.2) | 5 (6.7) (11.4) | |
| 2 | 12 (14.3) | 3 (33.3) | 9 (12.0) (20.5) | |
| 1 | 34 (40.5) | 4 (44.4) | 30 (40.0) (68.2) | |
| Negative | 0 | 31 (36.9) | 0b (0) | 31b (41.3) |
Percentages are shown in parentheses.
The P-value between MSI-L and MSS for EMAST-positive vs. negative was 0.023.
Table III.
Frequency of instability detected at each locus containing mono-, di-, tri-, tetra- and pentanucleotide repeats.
| EMAST-positive | ||||||||||||
|---|---|---|---|---|---|---|---|---|---|---|---|---|
| Repeat sequence | Marker | Total | MSI-H ≥3/7 | MSI-L 1/7 or 2/7 | MSS 0/7 | MSI-L &MSS | MSI-L ratio | total ≥l/7 | ≥3 loci ≥3/7 | 2 loci 2/7 | 1 locus 1/7 | EMAST negative 0/7 |
| n | 88 | 4 | 9 | 75 | 84 | 53 | 7 | 12 | 34 | 31 | ||
| Mononucleotide | ||||||||||||
| (A)n | BAT25 | 4 (4.5)b | 4 (100) | 0 | 0 | 0 | N/A | 0 | 0 | 0 | 0 | 0 |
| BAT26 | 4 (4.5) | 4 (100) | 0 | 0 | 0 | N/A | 0 | 0 | 0 | 0 | 0 | |
| Dinucleotide | ||||||||||||
| (CA)n | D2S123 | 9 (10.2) | 4 (100) | 5 (55.6) | 0 | 5 (6.0) | N/A | 5 (9.4) | 2 (28.6) | 1 (8.3) | 2 (5.9) | 0 |
| D5S346 | 3 (3.4) | 3 (75) | 0 | 0 | 0 | N/A | 0 | 0 | 0 | 0 | 0 | |
| D17S250 | 8 (9.1) | 3 (75) | 5 (55.6) | 0 | 5 (6.0) | N/A | 5 (9.4) | 1 (14.3) | 2 (16.7) | 2 (5.9) | 0 | |
| D18S64 | 3 (3.4) | 3 (75) | 0 | 0 | 0 | N/A | 0 | 0 | 0 | 0 | 0 | |
| D18S69 | 3 (3.4) | 2 (50) | 1 (11.1) | 0 | 1 (1.2) | N/A | 1 (1.9) | 0 | 1 (8.3) | 0 | 0 | |
| Trinucleotide | ||||||||||||
| (AAG)n | D7S1794 | 13 (14.8) | 4 (100) | 1(11.1) | 8 (10.7) | 9 (10.7) | N/A | 7 (13.2) | 1 (14.3) | 2(16.7) | 4(11.8) | 2 (6.5) |
| (CAG)n | TBP | 3 (3.4) | 2(50) | 0 | 1(1.3) | 1(1.2) | N/A | 0 | 0 | 0 | 0 | 1 (3.2) |
| Tetranucleotide | ||||||||||||
| (AAAG)n | MYCL1 | 8 (9.1) | 3 (75) | 4 (44.4) | 1 (1.3) | 5 (6.0) | 0.80 | 5 (9.4) | 2 (28.6) | 2 (16.7) | 1 (2.9) | 0 |
| LI7686 | 24 (27.3) | 4 (100) | 6 (66.7) | 14 (18.7) | 20 (23.8) | 0.30 | 20 (37.7) | 4 (57.1) | 5 (41.7) | 11 (32.4) | 0 | |
| UT5320 | 19 (21.6) | 3 (75) | 3 (33.3) | 13 (17.3) | 16 (19.0) | 0.19 | 16 (30.2) | 4 (57.1) | 6 (50.0) | 6 (17.6) | 0 | |
| D9S242 | 13 (14.8) | 3 (75) | 2 (22.2) | 8 (10.7) | 10 (11.9) | 0.20 | 10 (18.9) | 2 (28.6) | 2 (16.7) | 6 (17.6) | 0 | |
| D11S488 | 11 (12.5) | 2 (50) | 1(11.1) | 8 (10.7) | 9 (10.7) | 0.11 | 9 (17.0) | 3 (42.9) | 2(16.7) | 4(11.8) | 0 | |
| D20S82 | 20 (22.7) | 3 (75) | 2 (22.2) | 15 (20.0) | 17 (20.2) | 0.12 | 17 (32.1) | 6 (85.7) | 6 (50.0) | 5 (14.7) | 0 | |
| (ATAG)n | CSF1R | 6 (6.8) | 1 (25) | 1 (11.1) | 4 (5.3) | 5 (6.0) | 0.20 | 5 (9.4) | 3 (42.9) | 1 (8.3) | 1 (2.9) | 0 |
| Pentanucleotide | ||||||||||||
| (AAAAT)n | TP53Alu | 1 (1.1) | 1 (25) | 0 | 0 | 0 | N/A | 0 | 0 | 0 | 0 | 0 |
N/A, not applicable.
Calculated by dividing the number of unstable loci in the MSI-L population by that in the MSI-L and MSS population.
Percentages are shown in parentheses.
Table IV.
Patterns of microsatellite instability and fractional allelic loss in CRCs with MSI-H, MSI-L and/or EMAST (≥2/7).
| MSIa | EMAST | FAL | |||||||
|---|---|---|---|---|---|---|---|---|---|
| Patient ID | Status | Mono-nt ref | Di-nt ref | Di-nt ref | Tri-nt | No. of unstable locus | Tetra-nt locus with instability | Status | Valueb |
| CR023 | MSI-H | B25, B26 | D2S, D5S | D64 | AAG | 6 | MYC, L17, UT53, D9S, D11S, D20S | FAL-zero | 0/3 |
| CR051 | MSI-H | B25, B26 | D2S, D5S, D17S | D64, D69 | AAG, TBP | 5 | MYC, L17, UT53, D9S, D20S | FAL-H | 2/2 |
| CR055 | MSI-H | B25, B26 | D2S, D17S | - | AAG | 2 | L17, UT53 | FAL-zero | 0/6 |
| CR079 | MSI-H | B25, B26 | D2S, D5S, D17S | D64, D69 | AAG, TBP | 6 | MYC, L17, D9S, D11S, D20S, CSF | FAL-H | 1/1 |
| CR001 | MSI-L | - | D17S | - | - | 1 | MYC | FAL-L | 1/7 |
| CR012 | MSI-L | - | D17S | D69 | - | 2 | L17, UT53 | FAL-L | 1/9 |
| CR020 | MSI-L | - | D2S | - | - | 1 | L17 | FAL-L | 2/9 |
| CR025 | MSI-L | - | D2S, D17S | - | - | 6 | MYC, L17, UT53, D11S, D20S, CSF | FAL-L | 1/5 |
| CR026 | MSI-L | - | D2S | - | - | 3 | MYC, D9S, D20S | FAL-H | 3/9 |
| CR053 | MSI-L | - | D17S | - | AAG | 1 | L17 | FAL-L | 2/10 |
| CR074 | MSI-L | - | D2S | - | - | 1 | D9S | FAL-L | 2/9 |
| CR208 | MSI-L | - | D2S | - | - | 2 | L17, UT53 | FAL-H | 4/8 |
| CR338 | MSI-L | - | D17S | - | - | 2 | MYC, L17 | FAL-H | 9/10 |
| CR007 | MSS | - | - | - | AAG | 2 | UT53, D20S | FAL-H | 3/9 |
| CR013 | MSS | - | - | - | - | 2 | L17, UT53 | FAL-H | 3/10 |
| CR014 | MSS | - | - | - | - | 3 | D9S, D20S, CSF | FAL-H | 3/10 |
| CR040 | MSS | - | - | - | - | 2 | D11S, D20S | FAL-L | 1/10 |
| CR057 | MSS | - | - | - | - | 2 | D11S, D20S | FAL-H | 2/6 |
| CR069 | MSS | - | - | - | AAG | 3 | UT53, D11S, D20S | FAL-L | 2/8 |
| CR077c | MSS | - | - | - | - | 2 | UT53, CSF | FAL-H | 2/7 |
| CR087 | MSS | - | - | - | - | 3 | L17, D20S, CSF | FAL-zero | 0/9 |
| CR207 | MSS | - | - | - | - | 3 | L17, UT53, D20S | FAL-H | 3/6 |
| CR212 | MSS | - | - | - | - | 2 | L17, D9S | FAL-H | 2/6 |
| CR213 | MSS | - | - | - | - | 2 | UT53, D20S | FAL-L | 1/9 |
| CR335 | MSS | - | - | - | AAG | 2 | MYC, D20S | FAL-H | 5/11 |
| CR340 | MSS | - | - | - | - | 3 | L17, UT53, D11S | FAL-L | 1/7 |
| CR341 | MSS | - | - | - | - | 2 | D9S, D20S | FAL-L | 1/6 |
nt, nucleotide; minus sign, stable at the locus; B25, BAT25; B26, BAT26; D2S, D2S123; D5S, D5S346; D17S, D17S250; D64, D18S64; D69, D18S69; AAG, D7S1794; MYC, MYCL1; L17, L17686; UT53, UT5320; D9S, D9S242; D11S, D11S488; D20S, D20S82; CSF, CSF1R.
‘Ref’ refers to markers as recommended in the NCI guidelines - 5 loci in the reference panel; ‘Alt’ refers to alternative loci.
Indicates the number of loci showing LOH per the number of informative loci from data for 14 loci.
This tumor has been reported as an MSI phenotype (20), but the results were not reproducible.
All of the MSI-H tumors showed instability at ≥2 EMAST loci (Tables III, IV and V). Typical profiles found in MSI-H cases are shown in Fig. 1. Deletions of multiple 4-bp repeat units were observed in a majority of MSI-H cases (Fig. 1A), whereas non-MSI-H cases typically showed a single insertion of one 4-bp repeat unit (Figs. 1B-D). Four MSI-H tumors exhibited 19 alterations in the all 7 EMAST loci tested (Table V). Nine of the 19 (47.4%) alterations involved generation of 3 or 4 new alleles within a given locus. Of the 41 new alleles, 23 (56.1%) exhibited insertion or deletion of a single repeat unit whereas the rest (43.9%) exhibited insertion or deletion of >1 repeat unit (Table V). Most alterations (74.3%) were a deletion of repeats (Table V). However, 53 non-MSI-H tumors exhibited 82 altered EMAST loci. Instability profiles of EMAST tumors at 1 locus, 2 loci, or ≥3 loci were similar each other (Fig. 1). A large percentage of these alterations (84.1%) involved generation of a single new allele (Table V). In contrast to MSI-H tumors, no non-MSI-H tumors exhibited altered EMAST loci with ≥3 new alleles. Furthermore, most of the new alleles (91.6%) exhibited insertions or deletions of a single repeat unit. The difference in instability profiles at EMAST loci between MSI-H and non-MSI-H tumors was statistically significant (P<0.01) (Table V). These results suggest that there may be a continuous presence of a mutator phenotype in MSI-H tumors which results in multiple alterations in a given EMAST locus. Of the 4 MSI-H cases, 3 showed altered hMSH2 or hMLH1 expression. One MSI-H tumor (CR079) was found to carry a germline mutation (G40S) in the hMSH2 gene and its tumor had additional somatic mutations, G203R and 697delA in the (A)7 tract in the hMSH2 gene (20). A second (CR051) showed reduced hMSH2 protein expression (our unpublished results). The third (CR023) showed loss of hMLH1 protein expression (23) due to hypermethylation. In the remaining one case (CR055), the molecular bases for MSI-H has not been determined. In contrast to MSI-H cases, a large portion of EMAST found in non-MSI-H may be the result of a single event which may occur in a progenitor tumor cell before its expansion or may be due to lower levels of mutator phenotype exhibited by these tumors.
Table V.
Comparison of instability patterns at tetranucleotide-repeat loci between EMAST and MSI-H tumors.
| MSI-H | EMAST | P-value | |
|---|---|---|---|
| n | 4 | 53 | |
| Unstable allele number per locus | 19 (100)a | 82 (100) | 3.7×10⁻¹⁰ |
| 1 | 7 (36.8) | 69 (84.1) | |
| 2 | 3 (15.8) | 13 (15.9) | |
| 3 or 4 | 9 (47.4) | 0 (0) | |
| Alterations of repeat-unitsb | 41 (100) | 95 (100) | 4.8×10⁻⁶ |
| Single | 23 (56.1) | 87 (91.6) | |
| Multiple | 18 (43.9) | 8 (8.4) | |
| Insertion or deletionc | 35 (100) | 80 (100) | 0.00054 |
| Insertion | 9 (25.7) | 49 (61.3) | |
| Deletion | 26 (74.3) | 31 (38.8) |
Percentages are shown in parentheses.
Unstable alleles with ≥2 repeat-unit alterations from both original alleles were classified as multiple.
Determined for all unstable alleles, except for unclear cases and cases where the altered alleles were inside of two original alleles with two or three repeat-unit difference.
Figure 1.
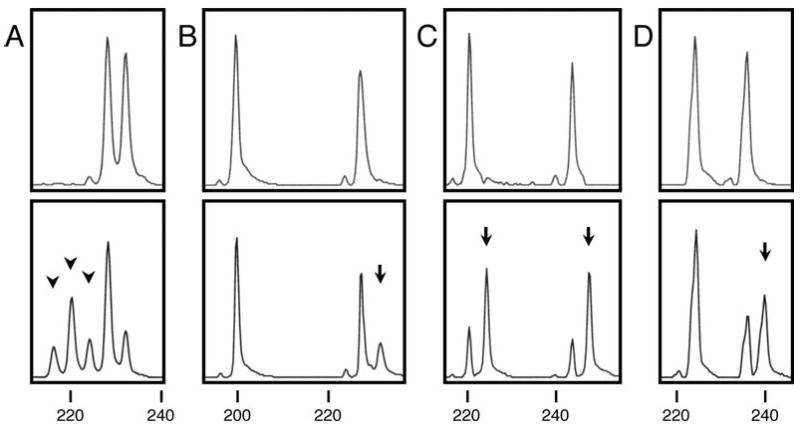
Representative examples of tetranucleotide instability. Electropherograms of PCR products that were derived from normal DNA (HEX labeled, upper panels) and tumor DNA (6-FAM labeled, lower panels) of the patients are shown for the D20S82 locus with (AAAG)n repeats. Numbers under the paired electropherograms indicate bp of the size standard. (A) CR051 (MSI-H). Three arrowheads indicate unstable alleles caused by deletion of at least one, two, or three repeat-units. (B) CR026 (MSI-L and EMAST at three loci). An arrow indicates an unstable allele probably caused by insertion of one repeat-unit into the longer original allele. (C) CR057 (MSS and EMAST at two loci). Two arrows indicate the unstable alleles probably caused by insertion of one repeat-unit into each of the two original alleles. (D) CR052 (MSS and EMAST at one locus). An arrow indicates the unstable allele probably caused by insertion of one repeat-unit into the longer original allele.
Because all MSI-L tumors (19 cases) detected in a previous study (13) and all 9 MSI-L cases in this study exhibited EMAST, it seemed that MSI-L tumors may be EMAST. To test this hypothesis, we examined 9 additional MSI-L tumors from another cohort, consisting of 61 CRCs, for EMAST. The results showed that 5 out of 9 tumors did not show instability at any of 7 EMAST loci (Table VI), suggesting that MSI-L tumors may not always exhibit EMAST. Our previous study demonstrated that MSH3-deficiency induces very low levels of instability at (CA)n loci and high levels of instability at (AAAG)n loci in tissue cultured cell lines (13). These results suggested that EMAST associated with MSI-L in CRC tissues may be due to MSH3-deficiency (13). In fact, it was found that down-regulation of MSH3 protein was associated with MSI-L/EMAST in CRC tissues (13). Our present study identified MSI-L tumor without EMAST, suggesting that another mechanism may exist for MSI-L. For example, 1 MSI-L tumor showed instability at only mononucleotide repeat locus (BAT25) but not at the dinucleotide locus tested (Table VI), whereas MSI at mononucleotide locus was never found in MSH3-deficient cells (13).
Table VI.
Patterns of microsatellite instability and fractional allelic loss in CRCs with MSI-L from another cohort.
| MSI | EMAST | FAL | |||||||
|---|---|---|---|---|---|---|---|---|---|
| Patient ID | Status | Mono-nt ref | Di-nt ref | Di-nt alt | Tri-nt | No. of unstable locus | Tetra-nt locus with instability | Status | Value |
| CR335-2a | MSI-L | - | - | D64 | - | 1 | L17 | FAL-H | 4/12 |
| CR379 | MSI-L | - | D2S | - | - | 0 | FAL-zero | 0/8 | |
| CR395 | MSI-L | - | D2S | - | - | 0 | FAL-H | 4/7 | |
| CR396 | MSI-L | - | - | D69 | - | 2 | L17, UT53 | FAL-zero | 0/8 |
| CR408 | MSI-L | - | D2S | - | AAG | 0 | FAL-H | 4/8 | |
| CR411 | MSI-L | - | D2S | - | - | 2 | UT53, D9S | FAL-H | 4/7 |
| CR418 | MSI-L | B25b | - | - | - | 0 | FAL-L | 2/12 | |
| CR440 | MSI-L | - | D2S | - | - | 1 | D20S | FAL-H | 3/8 |
| CR441 | MSI-L | - | D17S | - | - | 0 | FAL-H | 4/9 | |
In contrast to our results, a previous study by Samowitz et al reported that the frequency of tetranucleotide instability without concomitant MSI-H in CRC was very low (1.3%) (24). They analyzed 457 CRC cases for instability using a panel of 10 markers with tetranucleotide repeats including 5 AAAG repeat markers and 5 non-AAAG markers (25). The discrepancy between the data of Samowitz et al and the present study could be explained by the differing criteria by which MSI-positive tumors were defined and difference in the markers used. Samowitz et al (24) used more stringent criteria for defining MSI-positive tumors. They defined tumors as MSI-positive when ≥3 of 10 tetranucleotide repeats were unstable (24), whereas we defined a tumor as EMAST when it showed instability at ≥1 markers among 7 markers. In addition, the 10 tetranucleotide repeat markers used by Samowitz et al may not have been sensitive enough to detect EMAST whereas the markers used in this study were proved to be sensitive in detecting EMAST in non-CRC cancers (8,10). Using our criteria for EMAST tumors and the chosen EMAST markers, we were able to show that EMAST is a common event in sporadic CRC and that some but not all MSI-L tumors are associated with EMAST.
A panel of EMAST markers for categorizing CRC
The frequency of affected EMAST loci for MSI-L tumors (19/63; 0.30) was significantly higher than that of MSS (63/525; 0.12) (P=0.0012) and lower than MSI-H (19/28; 0.68) (P=0.00035) in the present cohort (Tables III and IV), indicating that the severity of instability at the NCI markers, especially dinucleotide repeat types, is associated with the severity of tetranucleotide instability. The same results were obtained in our previous study in the US population (13). As shown here and in our previous study, loss of MSH2 or MLH1 is associated with high levels of instability at the EMAST loci and down-regulation of MSH3 is associated with low levels of MSI at the EMAST loci. These results suggest that EMAST markers should be added to NCI markers for categorization of CRCs. The assay using EMAST markers may predict not only the status of hMSH2 and hMLH1 but also that of hMSH3. In order to increase the probability of detecting EMAST tumors, it is important to use sensitive markers. In our previous study, a high frequency of EMAST (∼60% of sporadic CRC) was detected using a set of 7 EMAST markers including the MYCL1, D20S82, D20S85, L17835, D8S321, D9S242 and D19S394 loci (13). All these markers mutated at frequency of between 14 and 30% in the US cohort. In this study, we used MYCL1 (10) and the 6 EMAST markers (L17686, UT5320, D9S242, D11S488, D20S82 and CSF1R) which have been tested for their high detection frequency in NSCLC (8). Using these markers, we detected EMAST tumors in 60.2% (53/88) of Japanese sporadic CRC. Three markers, L17686, D20S82 and UT5320, showed relatively higher frequency (19-24%) in the non-MSI-H population. MYCL1 and CSF1R exhibited the lowest frequency (5/84, 6.0%), but a high frequency in tumors showing instability at ≥2 EMAST loci. For further investigation we propose to use a panel of 10 EMAST markers to detect EMAST in sporadic CRCs. These markers will include L17686, UT5320, D9S242, D11S488, D20S82, MYCL1, D20S85, L17835, D8S321 and D19S394. Categorization of CRC by a combination of EMAST-based MSI assays using the panel of EMAST markers proposed here and immunohistochemical staining of CRC tissues with anti-MSH2, anti-MLH1 and anti-MSH3 antibodies may be useful for diagnostic and prognostic purposes.
EMAST status, LOH frequency and MSI at trinucleotide repeats
The majority of CRCs exhibits a chromosomal instability (CIN) phenotype identified by the LOH status (26). In addition, the presence of sporadic colorectal tumors exhibiting both MSI-H and LOH has been reported, indicating that the two types of genomic instability are not always mutually exclusive (27). During the course of this study, we scored each of 88 tumors for LOH at the microsatellite loci. We then determined whether any association exists between EMAST and LOH. LOH was found in 72 (81.8%) tumors including 2 MSI-H cases with the average frequency of 0.25 (Table VII). The percentage of EMAST-positive tumors showing LOH (48/53, 90.6%) was higher than that of EMAST-negative tumor (22/31, 71.0%), though there was no significant difference (P=0.032). The frequency of LOH events in EMAST tumors (136/490; 0.28) was significantly higher than in EMAST-negative tumors (70/326; 0.21; P=0.048). These results suggest that EMAST may share the same molecular basis for LOH. Although association of EMAST and mutation in the p53 gene has been demonstrated in NSCLC and bladder carcinomas (7,9), there was no significant association between EMAST and LOH at the p53 locus in our samples (Table VII). However, our preliminary data indicated that the somatic p53 mutation was weakly correlated with EMAST positivity (unpublished results).
Table VII.
Comparison of LOH frequencies between MSI-L and MSS, or EMAST-positive and negative tumors.
| Parameter | Total | MSI-H | MSI-L | MSS | P-valuea | MSI-L & MSS | EMAST positive | EMAST negative | P-value |
|---|---|---|---|---|---|---|---|---|---|
| n | 88 | 4 | 9 | 75 | 84 | 53 | 31 | ||
| LOH at any 14 locib | |||||||||
| Present | 209/828 (25.2)c |
3/12 (25.0) |
25/76 (32.9) |
181/740 (24.5) |
0.13 | 206/816 (25.2) |
136/490 (27.8) |
70/326 (21.5) |
0.048 |
| Absent | 619/828 (74.8) |
9/12 (75.0) |
51/76 67.1) |
559/740 (75.5) |
610/816 (74.8) |
354/490 (72.2) |
256/326 (78.5) |
||
| LOH near APC locus | |||||||||
| Present | 12/39 (30.8) |
NI | 1/4 (25.0) |
11/35 (31.4) |
1.0 | 12/39 (30.8) |
7/23 (30.4) |
5/16 (31.3) |
1.0 |
| Absent | 27/39 (69.2) |
NI | 3/4 (75.0) |
24/35 (68.6) |
27/39 (69.2) |
16/23 (69.6) |
11/16 (68.8) |
||
| LOH at p53 locusb | |||||||||
| Present | 29/49 (59.2) |
0/1 (0) |
1/4 (25.0) |
28/44 (63.6) |
0.29 | 29/48 (60.4) |
19/32 (59.4) |
10/16 (59.4) |
1.0 |
| Absent | 20/49 (40.8) |
1/1 (100) |
3/4 (75.0) |
16/44 (36.4) |
19/48 (39.6) |
13/32 (40.6) |
6/16 (37.5) |
||
| LOH at 18q21 | |||||||||
| Present | 44/76 (57.9) |
0/2 (0) |
4/8 (50.0) |
40/66 (60.6) |
0.71 | 44/74 (59.5) |
32/48 (66.7) |
12/26 (46.2) |
0.14 |
| Absent | 32/76 (42.1) |
2/2 (100) |
4/8 (50.0) |
26/66 (39.4) |
30/74 (40.5) |
16/48 (33.3) |
14/26 (53.8) |
||
| FAL valueb | |||||||||
| H (>0.25) | 41 (46.6) |
2 (50.0) |
3 (33.3) |
36 (48.0) |
0.11 | 39 (46.4) |
26 (49.1) |
13 (41.9) |
0.062 |
| L (>0 to ≤0.25) | 31 (35.2) |
0 (0) |
6 (66.7) |
25 (33.3) |
31 (36.9) |
22 (41.5) |
9 (29.0) |
||
| Zero | 16 (18.2) |
2 (50.0) |
0 (0) |
14 (18.7) |
14 (16.7) |
5 (9.4) |
9 (29.0) |
Fractions indicate LOH frequencies, i.e. the number of loci showing LOH per the number of informative loci. The LOH frequency of another MSI-L group (n=9) derived from 61 CRCs was 25/79 (31.6%) for any 14 loci. NI, Not informative.
Between MSI-L and MSS.
Including 4 informative data from nucleotide 215 G/C in the p53 gene.
Percentages are shown in parentheses.
In ovarian cancers, MSI in loci containing trinucleotide repeats has been associated with loss of MSH3 (28). Our previous study demonstrated that loss of MSH3 causes EMAST and low levels of instability at the loci with (CA)n repeats (13). These results suggest that EMAST tumors may also frequently exhibit MSI at the loci with trinucleotide repeats. To determine whether this is the case, we analyzed our samples for MSI at the D7S1794 locus containing an (AAG)n repeat and at the TBP locus containing a (CAG)n repeat. The results showed that all 4 MSI-H, 1 MSI-L and 8 MSS tumors exhibited instability at the D7S1794 locus. Importantly, 77.8% (7/9) of non-MSI-H tumors exhibiting MSI at this locus were EMAST-positive, though this is not statistically significant (P=0.47). The frequency of MSI at the TBP locus was low. The reason for the difference in MSI frequency between D7S1794 and TBP is not clear.
Correlation between the EMAST status and clinicopathological features
Clinicopathological features of patients were classified according to the EMAST status (Table VIII). EMAST-positive tumors were found at both distal (∼70%) and proximal (∼30%) sites. Most EMAST-negative tumors (29/31; 93.5%) located at distal sites and the significant association was found between EMAST-positive and negative tumors for tumor location (P=0.0084, one-tailed). EMAST-negative tumors were rarely found in proximal sites. The results predict that a majority of non-MSI-H tumors located at proximal colon may exhibit EMAST. There was no significant correlation between EMAST status and other clinicopathological parameters such as age, gender, histological type, stage, Dukes' stage or 5-year survival rate (P>0.01). A relatively higher frequency of well-differentiated adenocarcinomas was observed in EMAST-positive tumors as opposed to negative tumors (P=0.13) (Table VIII). Five-year data were available for 60 of the 88 cases included in this study. Among that cohort, the 5-year overall survival rate was 60.0%. The 5-year survival rate for the EMAST-positive group (20/34, 58.8%) was similar to that of the EMAST-negative group (13/23, 56.5%). For the MSI-L and MSS groups, the 5-year survival rates were 40.0% (2/5) and 59.6% (31/52), respectively. Five-year data were available for 3 of the 4 MSI-H cases and all of these cases survived for >5 years. This finding is consistent with a previous study that among HNPCC patients, a group in which most tumors exhibit MSI-H, the crude 5-year cumulative survival is better than that of patients with sporadic CRC (29). Analysis of the data related to postoperative survival showed no significant difference between EMAST-positive (n=44) and -negative (n=28) groups (P=0.74 by the log-rank test; Fig. 2A). EMAST associated with LOH forecasts a poorer prognosis, but the survival curves showed similar prognoses. When the EMAST-positive subgroups, at ≥2 loci (n=17) and at 1 locus (n=27), were compared, there was no significant difference (P=0.68) and there was a tendency toward a better prognosis for the former group (Fig. 2B).
Table VIII.
Clinicopathological features of 88 patients with sporadic CRCs.
| EMAST | |||||||
|---|---|---|---|---|---|---|---|
| Parameters | Total number | MSI-H | MSI-L | MSS | positive | negative | P-value |
| n | 88 | 4 | 9 | 75 | 53 | 31 | |
| Age, years | |||||||
| Mean ± SD | 61.4±12.7 | 57.3±12.4 | 56.8±14.8 | 62.2±12.5 | 60.7±13.2 | 63.1±12.1 | 0.40 |
| Range | 27-86 | 46-72 | 27-76 | 29-86 | 27-86 | 42-80 | |
| <50 | 16 (18.2)a | 2 (50.0) | 2 (22.2) | 12 (16.0) | 8 (15.1) | 6 (19.4) | 0.58 |
| 50-65 | 37 (42.0) | 1 (25.0) | 5 (55.6) | 31 (41.3) | 25 (47.2) | 11 (35.5) | |
| >65 | 35 (39.8) | 1 (25.0) | 2 (22.2) | 32 (42.7) | 20 (37.7) | 14 (45.2) | |
| Gender | |||||||
| Male | 60 (68.2) | 2 (50.0) | 9 (100.0) | 49 (65.3) | 35 (66.0) | 23 (74.2) | 0.47 |
| Female | 28 (31.8) | 2 (50.0) | 0 | 26 (34.7) | 18 (34.0) | 8 (25.8) | |
| Tumor locationb | |||||||
| Proximal | 19 (21.6) | 1 (25.0) | 3 (33.3) | 15 (20.0) | 16 (30.2) | 2 (6.5) | 0.012c |
| Distal | 69 (78.4) | 3 (75.0) | 6 (66.7) | 60 (80.0) | 37 (69.8) | 29 (93.5) | |
| Histological type | |||||||
| Well | 26 (29.5) | 1 (25.0) | 2 (22.2) | 23 (30.7) | 19 (35.8) | 6 (19.4) | 1.0d |
| Mode | 57 (64.8) | 2 (50.0) | 7 (77.8) | 48 (64.0) | 31 (58.5) | 24 (77.4) | |
| Poor | 3 (3.4) | 1 (25.0) | 0 | 2 (2.7) | 1 (1.9) | 1 (3.2) | |
| Mucinous | 2 (2.3) | 0 | 0 | 2 (2.7) | 2 (3.8) | 0 | |
| Stage | |||||||
| I | 10 (11.4) | 1 (25.0) | 1 (11.1) | 8 (10.7) | 5 (9.4) | 4 (12.9) | 1.0e |
| II | 30 (34.1) | 3 (75.0) | 3 (33.3) | 24 (32.0) | 18 (34.0) | 9 (29.0) | |
| IIIa | 18 (20.5) | 0 | 2 (22.2) | 16 (21.3) | 11 (20.8) | 7 (22.6) | |
| IIIb | 17 (19.3) | 0 | 2 (22.2) | 15 (20.0) | 14 (26.4) | 3 (9.7) | |
| IV | 13 (14.8) | 0 | 1 (11.1) | 12 (16.0) | 5 (9.4) | 8 (25.8) | |
| Dukes' stage | |||||||
| A | 10 (11.4) | 1 (25.0) | 1 (11.1) | 8 (10.7) | 5 (9.4) | 4 (12.9) | 1.0f |
| B | 33 (37.5) | 3 (75.0) | 3 (33.3) | 27 (36.0) | 20 (37.7) | 10 (32.3) | |
| C | 33 (37.5) | 0 | 4 (44.4) | 29 (38.7) | 23 (43.4) | 10 (32.3) | |
| D | 12 (13.6) | 0 | 1 (11.1) | 11 (14.7) | 5 (9.4) | 7 (22.6) | |
| 5-Year survivalg | |||||||
| >5 years | 36 (60.0) | 3 (100) | 2 (40.0) | 31 (59.6) | 20 (58.8) | 13 (56.5) | 1.0 |
| ≤5 years | 24 (40.0) | 0 | 3 (60.0) | 21 (40.4) | 14 (41.2) | 10 (43.5) | |
| Unavailable | 28 | 1 | 4 | 23 | 19 | 8 | |
Percentages are shown in parentheses.
The Proximal includes cecum, ascending colon and transverse colon; the Distal includes descending colon, sigmoid colon and rectum.
The one-tailed P-value for positive association between EMAST-positive and Proximal was 0.0084.
Well + Mode vs. Poor + Mucinous. The P-value for Well vs. Mode was 0.13.
I + II vs. IIIa + IIIb + IV.
A + B vs. C + D, corresponding to the lymph node metastasis negative vs. positive.
The percentages and P-value are expressed for cases whose 5-year data were available.
Figure 2.
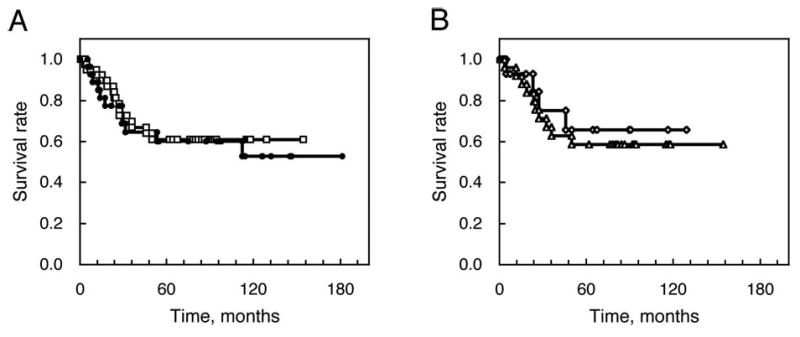
The postoperative survival curves classified by the EMAST status of colorectal tumors. (A) EMAST-positive (n=44, open squares) and -negative (n=28, filled circles). (B) EMAST-positive at ≥2 loci (n=17, open diamonds) and 1 locus (n=27, open triangles).
EMAST and CRC
What is the biological or pathological significance of EMAST for CRC carcinogenesis? Our previous study demonstrated that down-regulation of MSH3 causes EMAST and low levels of MSI at loci containing (CA)n repeats in tissue cultured cell lines. Furthermore, EMAST and MSI-L CRC tissues associated with EMAST exhibit down-regulation of MSH3. These results strongly support the idea that EMAST and MSI-L associated with EMAST are caused by down-regulation of MSH3. In fact, 21 EMAST tumors examined in this study were found to contain a larger percentage of MSH3-negative cells (20-50% of the total population) when compared with 6 non-EMAST tumors containing MSH3-negative cells (2-13% of the total population) (13). One of the expected consequences of MSH3-deficiency is mutation of genes containing tetranucleotide repeats at coding or regulatory regions. However, a study by Kloor et al showed that genes with tetranucleotide repeats are rare in the human genome and found no evidence of mutations in such genes in EMAST-positive bladder cancers (30). As shown here, MSI at the D7S1794 containing an (AAG)n repeat was found in ∼15% of our CRC samples. Furthermore, most tumors (77.8%) with MSI at the D7S1794 were EMAST tumors. These results suggest that loss of MSH3 may not only cause EMAST but also cause MSI at loci with trinucleotide repeats. To support this hypothesis, instability in AAT repeats has been associated with MSH3-deficiency in a sub-group of ovarian cancers (28). High levels of instability have been found in CAG repeats at the AR locus (31) and the RIS1 locus (32) in MSI-L tumors. Because genes with trinucleotide repeats are abundant in the human genome, these results suggest that certain genes with triplet repeats could be mutational targets of MSH3-deficiency and their mutations might contribute to CRC carcinogenesis. To test this hypothesis, the MSI status at loci containing trinucleotide repeats in CRC tissues is under investigation in our laboratory. Our preliminary data using tissue cultured cell lines indicated that MSH3-negative cells (EMAST-positive) are more sensitive to cisplatin when compared with MSH3-positive (EMAST-negative) cells (13). Because the present study showed that a majority of non-MSI-H CRC located at the proximal colon and about a half of those located at the distal colon are EMAST-positive tumors (Table VIII), these tumors might respond well to cisplatin-based therapy. We also identified some characteristics of EMAST-negative tumors. Those EMAST-negative tumors predominantly locate at the distal portion of colon and exhibit less degree of LOH compared with EMAST-positive tumors. These tumors might be more resistant to cisplatin-based therapy than EMAST-positive tumors. Further study is necessary to test this possibility. Another important finding in this study is that LOH and EMAST seem to co-exist. Because EMAST has been proven to be caused by down-regulation of MSH3 (13), it would be interesting to determine whether loss or down-regulation of MSH3 also contribute to abnormal recombination (33) which may result in LOH. In summary, taking this study together with our previous study, we have demonstrated that ∼60% of sporadic CRCs in both the Japanese and the US samples examined exhibited EMAST.
Acknowledgments
The authors thank Nobuko Kawamura for her excellent technical assistance. This study was supported by a Grant-in-Aid for Scientific Research from the Japan Society for the Promotion of Science (16591358 and 21591736).
Abbreviations
- CIN
chromosomal instability
- CRC
colorectal cancer
- EMAST
elevated microsatellite alterations at selected tetranucleotide repeats
- FAL
fractional allelic loss
- HNPCC
hereditary nonpolyposis colorectal cancer
- LOH
loss of heterozygosity
- MMR
mismatch repair
- MSI
microsatellite instability
- MSI-H
MSI-high
- MSI-L
MSI-low
- MSS
microsatellite stable
References
- 1.Aaltonen LA, Peltomäki P, Leach FS, et al. Clues to the pathogenesis of familial colorectal cancer. Science. 1993;260:812–816. doi: 10.1126/science.8484121. [DOI] [PubMed] [Google Scholar]
- 2.Dietmaier W, Wallinger S, Bocker T, et al. Diagnostic micro-satellite instability: definition and correlation with mismatch repair protein expression. Cancer Res. 1997;57:4749–4756. [PubMed] [Google Scholar]
- 3.Boland CR, Thibodeau SN, Hamilton SR, et al. A National Cancer Institute Workshop on Microsatellite Instability for cancer detection and familial predisposition: development of international criteria for the determination of microsatellite instability in colorectal cancer. Cancer Res. 1998;58:5248–5257. [PubMed] [Google Scholar]
- 4.Liu B, Parsons R, Papadopoulos N, et al. Analysis of mismatch repair genes in hereditary non-polyposis colorectal cancer patients. Nat Med. 1996;2:169–174. doi: 10.1038/nm0296-169. [DOI] [PubMed] [Google Scholar]
- 5.Herman JG, Umar A, Polyak K, et al. Incidence and functional consequences of hMLH1 promoter hypermethylation in colorectal carcinoma. Proc Natl Acad Sci USA. 1998;95:6870–6875. doi: 10.1073/pnas.95.12.6870. [DOI] [PMC free article] [PubMed] [Google Scholar]
- 6.Parc YR, Halling KC, Wang L, et al. hMSH6 alterations in patients with microsatellite instability-low colorectal cancer. Cancer Res. 2000;60:2225–2231. [PubMed] [Google Scholar]
- 7.Ahrendt SA, Decker PA, Doffek K, et al. Microsatellite instability at selected tetranucleotide repeats is associated with p53 mutations in non-small cell lung cancer. Cancer Res. 2000;60:2488–2491. [PubMed] [Google Scholar]
- 8.Xu L, Chow J, Bonacum J, Eisenberger C, et al. Microsatellite instability at AAAG repeat sequences in respiratory tract cancers. Int J Cancer. 2001;91:200–204. doi: 10.1002/1097-0215(200002)9999:9999<::aid-ijc1031>3.0.co;2-0. [DOI] [PubMed] [Google Scholar]
- 9.Danaee H, Nelson HH, Karagas MR, et al. Microsatellite instability at tetranucleotide repeats in skin and bladder cancer. Oncogene. 2002;21:4894–4899. doi: 10.1038/sj.onc.1205619. [DOI] [PubMed] [Google Scholar]
- 10.Catto JW, Azzouzi AR, Amira N, et al. Distinct patterns of microsatellite instability are seen in tumours of the urinary tract. Oncogene. 2003;22:8699–8706. doi: 10.1038/sj.onc.1206964. [DOI] [PubMed] [Google Scholar]
- 11.Burger M, Denzinger S, Hammerschmied CG, et al. Elevated microsatellite alterations at selected tetranucleotides (EMAST) and mismatch repair gene expression in prostate cancer. J Mol Med. 2006;84:833–841. doi: 10.1007/s00109-006-0074-0. [DOI] [PubMed] [Google Scholar]
- 12.Singer G, Kallinowski T, Hartmann A, et al. Different types of microsatellite instability in ovarian carcinoma. Int J Cancer. 2004;112:643–646. doi: 10.1002/ijc.20455. [DOI] [PubMed] [Google Scholar]
- 13.Haugen AC, Goel A, Yamada K, et al. Genetic instability caused by loss of MutS homologue 3 in human colorectal cancer. Cancer Res. 2008;68:8465–8472. doi: 10.1158/0008-5472.CAN-08-0002. [DOI] [PMC free article] [PubMed] [Google Scholar]
- 14.Strauss WM. Preparation of genomic DNA from mammalian tissue. In: Ausubel FM, Brent R, Kingston RE, Moore DD, Seidman JG, Smith JA, Struhl K, editors. Current Protocols In Molecular Biology. John Wiley & Sons; New York: 1998. pp. 2.2.1–2.2.3. [Google Scholar]
- 15.Vasen HF, Mecklin JP, Khan PM, Lynch HT. The International Collaborative Group on Hereditary Non-Polyposis Colorectal Cancer (ICG-HNPCC) Dis Colon Rectum. 1991;34:424–425. doi: 10.1007/BF02053699. [DOI] [PubMed] [Google Scholar]
- 16.Vasen HF, Watson P, Mecklin JP, Lynch HT. New clinical criteria for hereditary nonpolyposis colorectal cancer (HNPCC, Lynch syndrome) proposed by the International Collaborative group on HNPCC. Gastroenterology. 1999;116:1453–1456. doi: 10.1016/s0016-5085(99)70510-x. [DOI] [PubMed] [Google Scholar]
- 17.Yasutomi M, Baba S, Hojo K, et al., editors. Japanese Classification of Colorectal Carcinoma. Kanehara & Co., Ltd.; Tokyo: 1997. [Google Scholar]
- 18.Futreal PA, Barrett JC, Wiseman RW. An Alu polymorphism intragenic to the TP53 gene. Nucleic Acids Res. 1991;19:6977. doi: 10.1093/nar/19.24.6977. [DOI] [PMC free article] [PubMed] [Google Scholar]
- 19.Deloukas P, Matthews LH, Ashurst J, et al. The DNA sequence and comparative analysis of human chromosome 20. Nature. 2001;414:865–871. doi: 10.1038/414865a. [DOI] [PubMed] [Google Scholar]
- 20.Yamada K, Zhong X, Kanazawa S, Koike J, Tsujita K, Hemmi H. Oncogenic pathway of sporadic colorectal cancer with novel germline missense mutations in the hMSH2 gene. Oncol Rep. 2003;10:859–866. [PubMed] [Google Scholar]
- 21.Nunn J, Scholes AG, Liloglou T, et al. Fractional allele loss indicates distinct genetic populations in the development of squamous cell carcinoma of the head and neck (SCCHN) Carcinogenesis. 1999;20:2219–2228. doi: 10.1093/carcin/20.12.2219. [DOI] [PubMed] [Google Scholar]
- 22.Kinzler KW, Vogelstein B. Lessons from hereditary colorectal cancer. Cell. 1996;87:159–170. doi: 10.1016/s0092-8674(00)81333-1. [DOI] [PubMed] [Google Scholar]
- 23.Koike J, Yamada K, Takano S, et al. Undetectable expression of hMLH1 protein in sporadic colorectal cancer with replication error phenotype. Dis Colon Rectum. 1997;40:S23–S28. doi: 10.1007/BF02062016. [DOI] [PubMed] [Google Scholar]
- 24.Samowitz WS, Holden JA, Curtin K, et al. Inverse relationship between microsatellite instability and K-ras and p53 gene alterations in colon cancer. Am J Pathol. 2001;158:1517–1524. doi: 10.1016/S0002-9440(10)64102-8. [DOI] [PMC free article] [PubMed] [Google Scholar]
- 25.Samowitz WS, Slattery ML, Kerber RA. Microsatellite instability in human colonic cancer is not a useful clinical indicator of familial colorectal cancer. Gastroenterology. 1995;109:1765–1771. doi: 10.1016/0016-5085(95)90742-4. [DOI] [PubMed] [Google Scholar]
- 26.Lengauer C, Kinzler KW, Vogelstein B. Genetic instabilities in human cancers. Nature. 1998;396:643–649. doi: 10.1038/25292. [DOI] [PubMed] [Google Scholar]
- 27.Goel A, Arnold CN, Niedzwiecki D, et al. Characterization of sporadic colon cancer by patterns of genomic instability. Cancer Res. 2003;63:1608–1614. [PubMed] [Google Scholar]
- 28.Ueda H, Watanabe Y, Nakai H, Hemmi H, Koi M, Hoshiai H. Microsatellite status and immunohistochemical features of ovarian clear-cell carcinoma. Anticancer Res. 2005;25:2785–2788. [PubMed] [Google Scholar]
- 29.Stigliano V, Assisi D, Cosimelli M, et al. Survival of hereditary non-polyposis colorectal cancer patients compared with sporadic colorectal cancer patients. J Exp Clin Cancer Res. 2008;27:39. doi: 10.1186/1756-9966-27-39. [DOI] [PMC free article] [PubMed] [Google Scholar]
- 30.Kloor M, Schwitalle Y, von Knebel Doeberitz M, Wentzensen N. Tetranucleotide repeats in coding regions: no evidence for involvement in EMAST carcinogenesis. J Mol Med. 2006;84:329–333. doi: 10.1007/s00109-005-0012-6. [DOI] [PubMed] [Google Scholar]
- 31.Yamashita K, Arimura Y, Kurokawa S, et al. Microsatellite instability in patients with multiple primary cancers of the gastrointestinal tract. Gut. 2000;46:790–794. doi: 10.1136/gut.46.6.790. [DOI] [PMC free article] [PubMed] [Google Scholar]
- 32.Iglesias D, Fernández-Peralta AM, Nejda N, Daimiel L, Azcoita MM, Oliart S, González-Aguilera JJ. RIS1, a gene with trinucleotide repeats, is a target in the mutator pathway of colorectal carcinogenesis. Cancer Genet Cytogenet. 2006;167:138–144. doi: 10.1016/j.cancergencyto.2005.12.002. [DOI] [PubMed] [Google Scholar]
- 33.Datta A, Adjiri A, New L, Crouse GF, Jinks-Robertson S. Mitotic crossovers between diverged sequences are regulated by mismatch repair proteins in Saccharomyces cerevisiae. Mol Cell Biol. 1996;16:1085–1093. doi: 10.1128/mcb.16.3.1085. [DOI] [PMC free article] [PubMed] [Google Scholar]