

Abstract
We investigated the effects of disease progression on brain regional neurochemistry in a mutant mouse model of familial amyotrophic lateral sclerosis (FALS; the G93A model) using in vivo and in vitro magnetic resonance spectroscopy (MRS). There were numerous changes in the brain spectra that were brain region dependent. At early time points starting around 80 days of age there were increases in brain glutamate. At later time points there were more extensive changes including decreased NAA, decreased glutamate and increased glutamine, taurine and myo-inositol. The effects of the disease were most severe in spinal cord followed by medulla and then sensorimotor cortex. There were no changes noted in cerebellum as a control region. The effects of creatine supplementation in the diet (2%) were measured in wild-type and FALS animals in medulla, cerebellum and cortex. The increase in brain creatine was largest in cerebellum (25%) followed by medulla (11%) and then cortex (4%) reflecting the ordering of creatine kinase activity. There was a protective effect of creatine on NAA loss in the medulla at late stages. Creatine supplementation had a positive effect on weight retention leading to a 13% increase in weight between 120-130 days. MRS shows promise in monitoring multiple facets of neuroprotective strategies in ALS and ALS models.
Keywords: Amyotrophic lateral sclerosis, glutamate, motor neuron disease, amino acids, N-acetyl aspartate
Introduction
Amyotrophic lateral sclerosis (ALS) is a progressive neurodegenerative disorder that is characterized by the selective loss of upper and lower motor neurons. The mechanisms leading to the degeneration of motor neuron are still unknown. However there are several hypotheses underlying the disease process including oxidative stress, glutamate excitotoxicity, impaired mitochondrial function, and aberrant protein folding (Turner & Talbot, 2008). There have been various approaches to design treatments based on those hypotheses. For instance, riluzole, which is a NMDA receptor antagonist, delays onset of symptoms by 12 days in transgenic mouse model of familial ALS (FALS) with G93A human SOD1 mutation (Snow et al., 2003). Creatine, based upon its ability to stabilize the mitochondrial transition pore, is postulated to improve mitochondrial energy metabolism (Adhihetty & Beal, 2008). Creatine dietary supplementation in G93A SOD1 mice extended the survival by 13 and 26 days in a dose dependent manner (1% and 2% respectively) in mice treated before symptoms appeared (Klivenyi et al., 1999; Andreassen et al., 2001). Creatine supplementation in humans studied over short time periods (6-9months) showed little beneficial effects on various motor and behavioral outcome measures (Groeneveld et al., 2003; Shefner et al., 2004). A recent double blind placebo controlled trial in ALS patients did note a positive, though non-significant, effect on survival (Rosenfeld et al., 2008). Unfortunately, none of the three human trials were designed to examine survival as an end-point.
Our goals in this study were to examine alterations in regional brain metabolism using magnetic resonance spectroscopy (MRS) as well as to examine the potential beneficial effects of dietary creatine supplementation. We utilized in vivo and in vitro 1H MRS to follow the efficacy of 2% creatine-supplemented diet on hSOD1 G93A FALS mouse model. In vivo 1H MRS is a non-invasive and sensitive way of measuring brain metabolites and has been used to assess the progression of neurodegeneration in mouse models of diseases including Alzheimer's disease, Huntington's disease and ALS (Jenkins et al., 2000; Andreassen et al., 2001;Choi et al., 2003a; Dedeoglu et al., 2004; Jenkins et al., 2005; Marjanska et al., 2005; Choi et al., 2007; Niessen et al., 2007). There are a number of chemicals that can be measured from in vivo spectra. N-acetyl aspartate (NAA), a known marker of neuronal health and function has been observed to decrease in motor cortex and then increase with riluzole therapy (Kalra & Arnold, 2004). Also, longitudinal study shows a decline of NAA in motor cortex but not other cortical regions of ALS. Increases in glutamate/glutamine (glx) have also been observed in ALS medulla (Pioro et al., 1999) and we have observed increased glx in the FALS mice (Andreassen et al., 2001). Other molecules such as myo-inositol and taurine, that are related to both osmotic regulation as well as glial cell proliferation can be measured in vivo. MRS also has the advantage of being able to measure the brain increase in creatine with dietary supplementation (Andreassen et al., 2001; Hersch et al., 2006). We utilized in vivo and in vitro 1H MRS to monitor the progression of the disease, similar to a recent paper by Niessen et al. (Niessen et al., 2007) and, as a secondary goal to examine the effects of 2% creatine diet on the brain metabolite profile.
Materials and Methods
1. Mice
Breeding and genotyping
Male transgenic mice carrying a high copy number of a mutant allele human superoxide dismutase 1 (SOD1) [B6SJL-TgN(SOD1-G93A)1Gur, Stock #: 002726] were purchased and bred locally with female B6SJL mice (Jackson Laboratory, Bar Harbor, ME). The offsprings were genotyped by tail DNA polymerase chain reaction (PCR).
We performed four studies. First, to evaluate metabolic effects in the very earliest phase of the disease we studied nine wild-type and nine FALS mice in sensorimotor cortex using high resolution MRS. Next we evaluated a group of mice at various time points between 110-160 days of age using both in vitro and vivo MRS. After genotyping, mice were divided into 4 groups; (+)/WT (n=8), (+)/TG (n=20), (−)/WT (n=5), and (−)/TG (n=18) [(+); 2% creatine diet, (−); normal diet, WT; wild type, and TG; transgenic]. A subset of mice were examined using in vivo MRS at stages corresponding to no symptoms (n=5); partial hind limb paralysis (n=7) or all limbs showing some paralysis (n=5). These same animals were euthanized after in vivo MRS for the in vitro MRS. Otherwise the mice were euthanized when they exhibited paralysis of three limbs. We also examined the spinal cord in animals at the early symptomatic stages (n=5) as well as 5 WT controls. Finally, the animals above were all a subset of a larger group of animals in whom we measured the effects of creatine supplementation on weight loss as follows (+)/WT (n=19), (+)/TG (n=32), (−)/WT (n=12), and (−)/TG (n=25) [(+); 2% creatine diet, (−); normal diet, WT; wild type, and TG; transgenic].
Chemical extraction of brain and spinal cord metabolites for in vitroMRS
Mice were decapitated into liquid N2 to minimize metabolism of chemicals such as lactate. Sensorimotor cortex, cerebellum, and medulla of frozen brain were dissected out on dry ice. The areas dissected are shown in Fig. 1. The approximate cortical tissue size was 36μL. Tissue was placed into pre-weighed Eppendorf tube and weighed again for tissue weight and stored at -80°C until chemical extraction with a time delay before extraction of 1-2 months. We also collected data from the spinal cords were rapidly flushed into phosphate buffered saline (PBS) using a syringe filled with ice cold PBS. Cervical and thoracic cords were dissected out on a glass plate on dry ice. Tissue was stored in -80°C until the chemical extraction. All tissue samples were sonicated in 250 μL of 0.1 M perchloric acid (PCA) and centrifuged for 10 min and supernatant containing brain chemicals was separated and pH was adjusted to 7.2 by adding NaOH in PBS.
Figure 1.
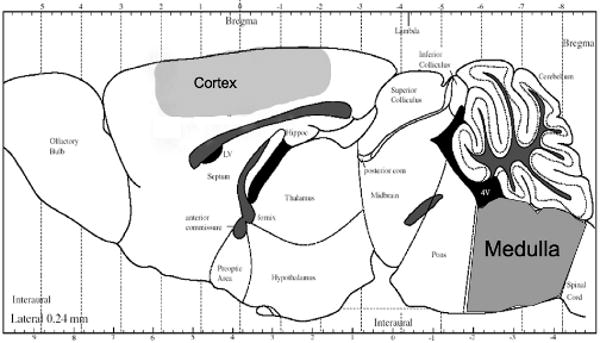
Sagittal rendering of the mouse brain with the regions extracted for the in vitro MRS shown. We extracted the full medulla and cerebellum. Frozen sensorimotor cortex was dissected with the approximate boundaries as shown in the shading.
2. In vivo and in vitro MRS
In vivo MRS of Sensorimotor Cortex
Mice were anesthetized under 1.5% halothane with N2O/O2 mixture and maintained at 38°C using circulating water blanket. In vivo MRS was performed on 9.4T (Bruker, Billerica MA) with home built elliptical surface coil. Localized proton spectroscopy of motor and cingulate cortex was collected using a voxel of 6.5×1.35×2.5mm was run using a PRESS sequence with TR/TE of 2.2s/144ms with a sweep width of 4kHz and 2k points. Six to seven hundred averages were taken for each spectrum. Data were analyzed using NUTS (Acorn NMR Inc, Livermore, CA) with fits to the metabolite profiles generated at the appropriate TE. Quantitative data is reported as a ratio to creatine which the in vitro data showed not to be significantly different between the FALS and WT animals at any time point.
In vitro MRS
pH adjusted tissue extracts were lyophilized overnight and dissolved in 0.7 mL of 99.9% D2O (Aldrich, Milwaukee, WI) containing 0.2 mM of 3-(Trimethylsilyl)-propionic acid (TSP, Aldrich, Milwaukee, WI) or 0.2 mM formate (Sigma, St. Louis, MA) as an internal reference for quantification. All samples were run on 14T (600MHz, Bruker, Billerica, MA) at 25°C with a spinning rate of 20 Hz except for initial extracts from sensorimotor cortex at 84 days of age which were run at 500MHz (Bruker, Billerica, MA) due to the fact that the 14T (600 MHz) spectrometer only came on line after the initial 500MHz studies were run. We also utilized the tissue protein content as the normalization factor in the initial sensorimotor cortex studies all the other studies were normalized to tissue wet weight. The spectra were acquired using a simple one pulse sequence with two hundred averages with a pulse width of 12 μs, 32k data points, 7.1 kHz spectral width, and a repetition time of 12 s. The data was analyzed with NUTS (Acorn NMR Inc, Livermore, CA).
Statistical Analysis
Comparisons between FALS and WT animals or creatine-treated and creatine-untreated animals were made using one-way ANOVA with a Tukey HSD for correction of multiple comparisons. Comparisons of weight changes with creatine supplementation were run using repeated measures ANOVA with a Tukey HSD post-hoc comparison. Linear discriminant analysis was run using the stated metabolites with hold-out analysis for inter-group comparisons.
All studies were approved by the Subcommittee on Research Animal Care at Massachusetts General Hosptial keeping with the ethical guidelines of the Association for Assesment and Accreditation of Laboratory Animal Care International.
Results
In vitro 1H MRS of FALS mice compared to WT
We ran tissue extracts from sensorimotor cortex, cerebellum, medulla, and spinal cord of the hSOD1 G93A FALS mice. We also ran spectra at multiple time points on cortex, medulla and cerebellum extracts. With in vitro spectra well over 20 chemicals can be observed from the extracts. We present a subset of these results to show the power of this approach for regional and temporal assessment of the natural history of metabolic abnormalities in FALS mice. Shown in Fig. 2 are the in vitro spectra of sensorimotor cortex from FALS mouse and wild-type (WT) control at 84 days of age. There is an increase in the glutamate peak in the FALS mouse compared to the WT control. The creatine and N-acetylaspartate (NAA) concentrations are quite similar in these mice at this age.
Figure 2.
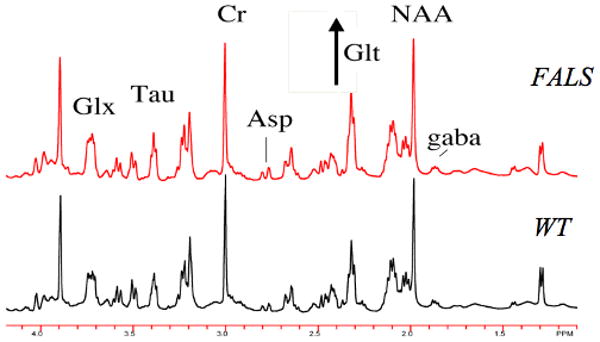
500 MHz 1H spectrum from sensorimotor cortex in a FALS mouse and a wild-type mouse. The mice were 84 days old. There is an increase in the glutamate peak labeled Glt (see also Table 1). For illustration a few other peaks are labeled : Asp – aspartate; tau – taurine.
The spectral fingerprints of cortex, medulla, cerebellum, and spinal cord all allow differentiation between the various brain regions. In Fig. 3 data are shown from a WT mouse and a FALS mouse at 112 days of age from cortex, cerebellum and medulla. The intensity of creatine peak was adjusted to be equal on all spectra for easier comparison between different regions of the brain as well as WT and FALS animals. As seen in the spectra the neurochemical patterns are different in each region, and these patterns allow for ready separation between regions. For instance, cerebellum has the highest creatine values, while cortex has more NAA than either cerebellum or medulla. There were no significant differences between WT mice and FALS mice in any chemicals in cerebellum, consistent with the known pathology of ALS and thereby suggesting it serves as a useful control region.
Figure 3.
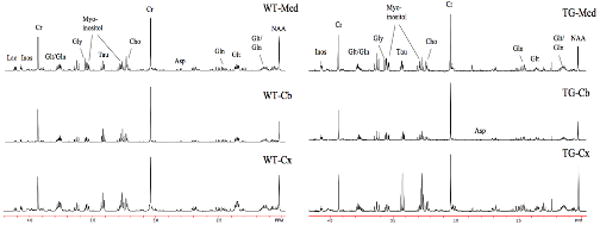
Comparisons of high resolution spectra (600 MHz) of brain extracts from medulla, sensorimotor cortex and cerebellum in a WT mouse and a FALS mouse. All three regional spectra are from the same mouse. There are numerous characteristic metabolic patterns that allow for separation between the different brain regions, and as well, numerous metabolic abnormalities that characterize the FALS mice.
Shown in Fig. 4 are data from spinal cord extracts. Since the disease starts in the spinal cord one would predict that it would manifest the largest abnormalities, and this is indeed the case. There is a decrease in N-acetylaspartylglutamate (NAAG) and NAA in spinal cord as well as increases in glutamate, taurine and inositols. Interestingly, the total concentrations of most metabolites are higher in spinal cord than brain. The ordering of metabolic abnormalities, as characterized by both the magnitude and total number of significant differences, at 110 days of age was spinal cord > medulla > cortex.
Figure 4.
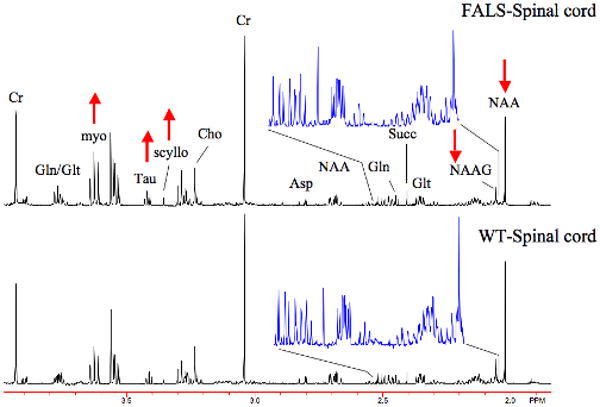
Spectra (600MHz) from spinal cord extracts of a FALS mouse and a WT mouse at 110 days of age. There are numerous abnormalities in the spinal cord of FALS mice (shown in Table 3). These include decreased NAA and NAAG as shown in the figure and in the expanded region between 2.04-2.5 ppm. These extracts are from cervical and thoracic spine.
Tables 1 through 3 show the summaries of some of the most salient findings. In Table 1 comparisons between WT and FALS animals at 84 days of age, close to the onset of symptoms, are shown from sensorimotor cortex. There is an increase in glutamate, and a trend towards increased aspartate and changes in other neurochemicals, but no change in NAA. We also studied animals at 114 and 142 days of age. The most significant change in cortex in the FALS mice at 141 days of age was an increase in glutamine (from 2.79±.16 to 3.88±.45 umol/g tissue).
Table 1.
Concentrations of selected MRS visible chemicals for FALS and wild type mice at 84 days of age from in vitro MRS of brain extracts of sensorimotor cortex.
| Chemical | Control (n=9) | FALS (n=9) | Change (%) | P values |
|---|---|---|---|---|
| GABA | 34.2 ± 12.9 | 36.9 ± 5.4 | ns | |
| NAA | 60.3 ± 14.6 | 57.3 ± 10.9 | -5 | ns; p < 0.2 |
| Glutamate | 86.1 ± 20.8 | 111.6 ± 18.6 | +30 | < 0.05 |
| Glutamine | 31.5 ± 13.8 | 34.8 ± 4.7 | +10 | ns; p < 0.2 |
| Aspartate | 20.6 ± 11.3 | 27.5 ± 5.6 | +33 | ns; p < 0.2 |
| Creatine* | 60.6 ± 13.8* | 64.8 ± 16.4* | ns |
Concentrations are expressed as μmol/g protein. Errors reported are standard deviations. P values derive from unpaired t-tests; ns means not significant.
Creatine levels were determined from HPLC analysis of the same samples.
Table 3.
Concentrations of selected MRS visible chemicals for FALS and wild type mice at 110 days of age from in vitro MRS of spinal cord extracts.
| Chemical | WT (n=5) | FALS (n=5) | Change (%) | P values |
|---|---|---|---|---|
| Myo-inositol | 4.55 ± 0.45 | 8.12 ± 1.07 | +78.5 | 0.011 |
| Scyllo-inositol | 0.14 ± 0.07 | 0.37 ± 0.45 | +162.6 | 0.046 |
| Taurine | 4.14 ± 0.19 | 7.46 ± 0.86 | +80.3 | 0.006 |
| Creatine | 16.94 ± 3.03 | 17.55 ± 1.76 | - | 0.72 |
| Glutamate | 8.53 ± 0.79 | 11.16 ± 1.98 | +30.8 | 0.033 |
| NAAG | 2.46 ± 0.11 | 1.56 ± 0.35 | -36.8 | 0.014 |
| NAA | 12.17 ± 0.99 | 9.70 ± 1.06 | -20.4 | 0.01 |
Concentrations are expressed as μmol/g wet weight. Errors reported are standard deviations.
Importantly, there is no change in creatine between the FALS and WT animals, thereby suggesting it serves as a useful control for in vivo studies where it can be used for measurement of ratios to other neurochemicals.
The effects of aging were more profound in medulla than in cortex. These results are shown in Table 2. At 114 days there is an increase in glutamate and glutamine, as well as an increase in glycine and taurine. Again, there was no significant change in NAA. At 142 days of age, when the animals exhibit partial paralysis, there is a decrease in NAA (F1,17=10.65, p=0.004), and glutamate has gone back down, consistent with what we observed from in vivo. Further, taurine continues to increase (F1,17 = 4.92, p=0.04), while glycine returns to normal. These data are consistent with a pattern of increased metabolic activity in the early stages, and then decreased neuronal health at the later disease stages. As in cortex, there were no significant changes in creatine, although there was a slight trend towards a small increase. Regression analysis shows significant effects of age on the metabolites shown in Table 2 (except for creatine).
Table 2.
Concentrations of selected MRS visible chemicals for medulla in FALS mice as a function of age.
| Chemical | WT (n=6) | FALS 114 Days (n=9) | FALS 142 Days (n=9) |
|---|---|---|---|
| Glycine | 0.82 ± 0.31 | 1.38 ± 0.51 (+68%) | 0.87 ± 0.16 |
| Taurine | 1.21 ± 0.38 | 1.85 ± 0.35 (+53%) | 2.13 ± 0.82 (+76%) |
| Creatine | 4.34 ± 1.25 | 4.98 ± 1.19 | 4.92 ± 0.98 |
| Glutamine | 1.01 ± 0.27 | 1.65 ± 0.58 (+63%) | 1.74 ± 0.51 (+72%) |
| Glutamate | 2.26 ± 0.31 | 2.93 ± 0.75 (+30%) | 1.89 ± 0.83 |
| NAA | 2.81 ± 0.66 | 3.16± 1.12 | 2..41 ± 0.14 (-14%) |
Concentrations are expressed as μmol/g wet weight. Errors reported are standard deviations. Values in parentheses indicate changes from the WT values that were significant at p<0.05. Note the concentrations are normalized to wet weight as opposed to protein in Table 1.
Finally, in Table 3 we show the metabolic changes in spinal cord at 112 days of age. There are numerous changes including increased glutamate, inositols and taurine, as well as decreased NAA and NAAG. The increase in glutamate at this age parallels the increases seen in cortex and medulla. The decrease in NAA and NAAG happens earlier than in medulla consistent with the origin of pathology in spinal cord. The decreased NAAG is consistent with reports of increased activity of N-acetylated-alpha-linked-amino dipeptidase (NAALADase), an enzyme that cleaves NAAG into NAA and glutamate in spinal cord.
In Vivo MRS of FALS Mice
We also scanned the FALS mice using in vivo MRS. These data showed a pronounced effect of symptoms on the spectra in a voxel centered on motor cortex. Instead of segregation of the animals by age, we analyzed the animals according to motor symptoms. We divided the mice into three groups either unaffected, paralysis of hind limbs only, or paralysis of hind limbs and partial paralysis of front limbs. Analysis of these variables using a one-way ANOVA showed that there was a significant decrease of NAA in mice with four limbs affected versus those with no limbs affected – irrespective of age (the effect of motor status vs. age was not significant F2,13 = 0.62; p = 0.56). These data are shown in Fig. 5. Performing the same analysis for the in vitro cortical MRS data we found that the four limb affected animals compared to the hind limb only and the asymptomatic animals had a decrease in cortical NAA/Cr from 0.75±.03 to 0.64±.04 to 0.58±.05 (F2,17 = 12.0; p= 0.001). We also compared the spectra of the terminal stage mice who were scanned with their extract data to evaluate the relation between the two modalities. The correlation was highly significant, notwithstanding the different voxel sizes (the in vivo MRS comes from a smaller voxel encompassing only motor cortex whereas the in vitro data was all of sensorimotor cortex), although the correlation appears to be driven by the extrema.
Figure 5.

A) T2-weighted image of a FALS mouse with the location and size of the cortical voxel shown (the voxel was 6.5×1.35×2.5mm). B) Representative in vivo spectrum from a FALS mouse with three paralyzed limbs at 140 days of age and an age-matched control. There is a decrease in NAA in the FALS mouse compared to the WT. C) Bar graph showing the effects of motor limb status on the metabolite levels measured at 9.4T (TR/TE 2200/144ms) in vivo in FALS mice from motor cortex. The voxels used here are smaller than those used for the in vitro tissue extraction data reported in Table 1.
* - Denotes significantly different from the animals with no limb paralysis (None). None of the other measured metabolites (Choline or myo-inositol) were significantly different between the groups. There were between 5-7 animals per group. D) Plot of the average NAA values determined in vivo versus those determined in vitro for the same mice. The correlation was highly significant (P < 0.001).
Effects of Creatine Supplementation on Brain Metabolites
We treated animals with 2% creatine in the diet starting from 76-80 days of age. Although we did not test the effects of creatine on survival, we did find that creatine had a net positive effect on retention of body weight starting at 120 days of age compared to the littermate mice fed a normal diet (see Fig. 6A). The effect was significant between 120-130 days of age. We examined the effects of creatine supplementation on brain creatine levels in cerebellum, medulla and cortex in both transgene and WT animals. There was no significant difference in the creatine increase between transgene and WT animals, however there was a significant effect of brain region with medulla and cerebellum showing significantly larger increases in brain creatine than cortex (Fig. 6B). At 141 days of age creatine protected NAA loss in medulla by bringing it back to the wild-type value (2.41±0.16 vs. 2.85±0.37 μmol/g tissue for no creatine vs. creatine treatment respectively). The creatine-treated NAA value was not significantly different from the WT creatine-treated animals (F1,26 = 1.41, p=0.25). Pooling all the data (WT and FALS) showed an increase in brain creatine in medulla of about 11% (F1,44 = 7.1; p = 0.01) and in cerebellum of about 25% (F1,46 = 6.5; p = 0.01). In cortex the increase in creatine was not significant (F1,47 = 0.33; p = 0.57)
Figure 6.
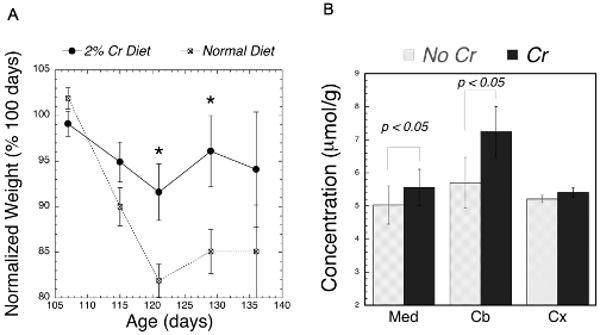
A) Plot of the average weight of FALS mice as a function of age normalized to the weight of the animal at 100 days (there were between 9-25 animals at each age). * Significant effect of 2% creatine supplementation in the FALS animals compared to the untreated animals using a repeated measures ANOVA (p<0.05). B) Effects of creatine supplementation on regional brain creatine concentrations. There were significant increases in cerebellum and medulla of the creatine.
We used linear discriminant analysis to characterize the groups (creatine or no creatine. medulla or cortex; n=15-19 per group) using absolute concentrations of metabolites from in vitro brain extracts identified as being significant in the omnibus ANOVA analysis (myo-inositol, taurine, glutamine, glutamate, GABA, NAA, choline and creatine). The results are shown in Fig. 6. These data indicate that we were able to attain overall greater than 75% correct classification (using holdout analysis – 90% without).
Discussion
There have been numerous studies to use in vivo MRS and MRI as a diagnostic and monitoring tool for the progression of neurodegenerative diseases. In this study, we utilized in vitro MRS for measuring brain metabolites from sensorimotor cortex, medulla, cerebellum, and spinal cord of FALS and WT mice at different stages of the disease. In general, the effects of the disease were most pronounced in the spinal cord as might be expected, since this brain region showed the most pronounced differences at 110 days of age. The medulla showed the next most profound effects. This pattern is consistent with the observations of Niessen et al. (Niessen et al., 2007) in the same mouse model. Our results, however, show some very different patterns from those observed in the Niessen et al. paper. For instance they observed a decrease in myo-inositol, glutamate, aspartate, GABA, glutamine, and NAA at 120 days of age in the spinal cord (they did not report NAAG values). In contrast we observed increases in myo- and scyllo-inositols and in glutamate. We observed a decrease in NAA and NAAG (with the latter decreasing the most). The activity of N-acetylated-alpha-linked-amino dipeptidase (NAALADase), an enzyme that cleaves NAAG into NAA and Glu, was significantly increased in a canine model of motor neuron disease (Tsai et al., 1993) and decreases in NAAG (concomitant with increased glutamate) have previously been found in ALS spinal cords (Tsai et al., 1991; Plaitakis & Constantakakis, 1993). Since NAAG may have neuroprotective properties (Neale et al., 2005) its decrease in mouse spinal cord may be important. The fact that NAA was not decreased in medulla at 114 days compared to later ages suggests that it is not an early marker for the disease progression, but may reflect later neuronal loss.
Unlike the Niessen et al. paper(Niessen et al., 2007) we found increases in the osmolar/glial markers inositols and taurine in spinal cord and in medulla between 110-142 days of age. Further, in brain stem we found increased glutamate and glutamine at 114 days of age and in the end stages (142 days of age) we found increased glutamine and a trend towards decreased glutamate. This pattern of increased glutamine and decreased glutamate seems to be characteristic for neuronal loss at the later stages of neurodegeneration and is seen in AD, HD and excitotoxic models (Jenkins et al., 2000; Tkac et al., 2001; Dedeoglu et al., 2004; Tsang et al., 2006; Choi et al., 2007; Tkac et al., 2007). Further, the pattern of increased inositols and taurine is also found in other mouse models of neurodegeneration including AD and HD mice (Jenkins et al., 2000; Tkac et al., 2001; Dedeoglu et al., 2004; Marjanska et al., 2005; Tsang et al., 2006; Choi et al., 2007; Tkac et al., 2007). The increased glutamate and glutamine observed at early disease stages in this study and in our previous paper (Andreassen et al., 2001), suggests increased metabolism that may be reflective of defects in glutamate uptake. A similar finding was also noted in medulla of ALS patients (Pioro et al., 1999). Abnormalities in GLT-1 in ALS are noted (Rothstein et al., 1995; Bruijn et al., 1997) and increased expression through beta-lactam antibiotics can delay motor neuron death in FALS mice (Rothstein et al., 2005). Since uptake of glutamate by astrocytes is dependent upon Na-K-ATPase decreased efficiency of uptake through GLT-1 may increase energy requirements due to the necessity of increased flux through other transporters. We showed evidence of increased TCA cycle metabolism in FALS mice at 85 days of age using 13C NMR spectroscopy (Choi et al., 2003b). At late stages, when neurons are dead or dying, energy metabolism is likely to decrease. At the later stages, however, in medulla, glutamate is decreased and glutamine is increased.
Creatine has shown some efficacy in FALS mice increasing survival by a relatively modest amount (about 26 days with 2% supplementation) (Klivenyi et al., 1999; Andreassen et al., 2001) and the effects of creatine supplementation in G93A mice was found to be similar to the effects of riluzole whereas a combination of the two was not better than either alone (Snow et al., 2003). A more recent study was unable to reproduce the positive effects of either creatine, minocycline or even riluzole (Scott et al., 2008) highlighting, primarily, the dangers of trials with limited numbers of animals. Creatine supplementation in humans studied over short time periods (6-9months) showed little beneficial effects on various motor and behavioral outcome measures (Groeneveld et al., 2003; Shefner et al., 2004). A recent double blind placebo controlled trial in ALS patients did note a positive, though non-significant, effect on survival (Rosenfeld et al., 2008). Unfortunately, none of the three human trials were designed to examine survival as an end-point and further, given the much higher metabolic rate of mice 2% creatine in their diet translates to a higher total creatine intake than would be attained in humans. Although we did not study survival we did find a significant improvement in weight retention between 120-130 days of age. Given the benign nature of creatine supplementation it may be worth pursuing, but only at even higher doses than have been tried. Our MRS results clearly show that creatine concentrations can be increased in the brain and do show a protective effect on NAA loss in medulla at the later stages of disease. Interestingly the increase in creatine was larger in cerebellum (≈25%) and medulla (≈11%) than in cortex. This likely reflects the activity of creatine kinase which is largest in cerebellum followed by medulla and cortex (3.74, 2.9 and 2.1 U/g for cerebellum, medulla and cortex respectively (Erakovic et al., 2001)). A paper studying creatine supplementation in human ALS patients claimed that creatine supplementation led to an increase in the diminished NAA values noted in motor cortex (Vielhaber et al., 2001). We similarly found a decrease in NAA in symptomatic ALS mototr cortex but it did not reach significance in protecting the NAA loss. Whether or not creatine proves to have any efficacy in ALS, it is clear that MRS can play a useful role in following the effects of such therapy longitudinally (Kalra et al., 1999). There is much evidence in other diseases, such as multiple sclerosis or Alzheimer's Disease, that MRI can provide quite a few markers that can be used to shrink population study sizes, decrease measurement times for following therapeutic interventions and increase statistical power in clinical trials (Miller, 2002; Dickerson & Sperling, 2005; Li et al., 2006; Cummings et al., 2007) though which combination of markers is most efficacious is still an open question. Our studies, therefore, by using multiple markers will add qualitative and quantitative value to these questions as they pertain to ALS since the models are good models of the human disease.
Figure 7.

Linear discriminant analysis of MRS data from FALS mice treated with 2% dietary creatine or normal diet showing good separation of both brain region (cortex or medulla) and/or treatment. The classification is shown below.
| Group | Cx | Med | CrCx | CrMed | Classified |
| Cx | 16 | 1 | 0 | 0 | 0.941 |
| Med | 1 | 10 | 0 | 7 | 0.556 |
| CrCx | 3 | 1 | 14 | 1 | 0.737 |
| CrMed | 0 | 3 | 0 | 12 | 0.800 |
| Overall | 0.754 | ||||
Better than 75% of the mice were correctly classified as shown in the numbers above. CrCx – creatine-fed cortex; CrMed – creatine-fed medulla.
Acknowledgments
This work supported by the ALS Association and by NIH/NINDS R21NS059644-01. We thank Caitlin Martin for technical assistance with the animal handling.
Abbreviations
- ALS
Amyotrophic lateral sclerosis
- Cb
cerebellum
- Cr
creatine
- Cx
cortex
- FALS
Familial amyotrophic lateral sclerosis
- GABA
gamma-aminobutyric acid
- Gln
glutamine
- Glt
glutamate
- GLT1
glutamate transporter 1 (excitatory amino acid transporter 2)
- Glx
glutamate+glutamine
- Med
medulla
- MRI
magnetic resonance imaging
- MRS
magnetic resonance spectroscopy
- NAA
N-acetylaspartate
- NAAG
N-acetylaspartylglutamate
- PCR
polymerase chain reaction
- SOD1
superoxide dismutase 1
- TG
transgene
- WT
wild type
References
- Adhihetty PJ, Beal MF. Creatine and its potential therapeutic value for targeting cellular energy impairment in neurodegenerative diseases. Neuromolecular Med. 2008;10:275–290. doi: 10.1007/s12017-008-8053-y. [DOI] [PMC free article] [PubMed] [Google Scholar]
- Andreassen OA, Jenkins BG, Dedeoglu A, Ferrante KL, Bogdanov MB, Kaddurah-Daouk R, Beal MF. Increases in cortical glutamate concentrations in transgenic amyotrophic lateral sclerosis mice are attenuated by creatine supplementation. J Neurochem. 2001;77:383–390. doi: 10.1046/j.1471-4159.2001.00188.x. [DOI] [PubMed] [Google Scholar]
- Bruijn LI, Becher MW, Lee MK, Anderson KL, Jenkins NA, Copeland NG, Sisodia SS, Rothstein JD, Borchelt DR, Price DL, Cleveland DW. ALS-linked SOD1 mutant G85R mediates damage to astrocytes and promotes rapidly progressive disease with SOD1-containing inclusions. Neuron. 1997;18:327–338. doi: 10.1016/s0896-6273(00)80272-x. [DOI] [PubMed] [Google Scholar]
- Choi IY, Lee SP, Guilfoyle DN, Helpern JA. In vivo NMR studies of neurodegenerative diseases in transgenic and rodent models. Neurochem Res. 2003a;28:987–1001. doi: 10.1023/a:1023370104289. [DOI] [PubMed] [Google Scholar]
- Choi JK, Kuestermann E, Andreassen OA, Beal MF, Jenkins BG. International Society of Magnetic Resonance in Medicine. Toronto, Canada: 2003b. A tale of two mice: impaired glial-neuronal cycling in mouse models of Huntington's disease and amyotrophic lateral sclerosis; p. 437. [Google Scholar]
- Choi JK, Dedeoglu A, Jenkins BG. Application of MRS to mouse models of neurodegenerative illness. NMR Biomed. 2007;20:216–237. doi: 10.1002/nbm.1145. [DOI] [PubMed] [Google Scholar]
- Cummings JL, Doody R, Clark C. Disease-modifying therapies for Alzheimer disease: challenges to early intervention. Neurology. 2007;69:1622–1634. doi: 10.1212/01.wnl.0000295996.54210.69. [DOI] [PubMed] [Google Scholar]
- Dedeoglu A, Choi JK, Cormier K, Kowall NW, Jenkins BG. Magnetic resonance spectroscopic analysis of Alzheimer's disease mouse brain that express mutant human APP shows altered neurochemical profile. Brain Res. 2004;1012:60–65. doi: 10.1016/j.brainres.2004.02.079. [DOI] [PubMed] [Google Scholar]
- Dickerson BC, Sperling RA. Neuroimaging biomarkers for clinical trials of disease-modifying therapies in Alzheimer's disease. NeuroRx. 2005;2:348–360. doi: 10.1602/neurorx.2.2.348. [DOI] [PMC free article] [PubMed] [Google Scholar]
- Erakovic V, Zupan G, Varljen J, Laginja J, Simonic A. Altered activities of rat brain metabolic enzymes in electroconvulsive shock-induced seizures. Epilepsia. 2001;42:181–189. doi: 10.1046/j.1528-1157.2001.30499.x. [DOI] [PubMed] [Google Scholar]
- Groeneveld GJ, Veldink JH, van der Tweel I, Kalmijn S, Beijer C, de Visser M, Wokke JH, Franssen H, van den Berg LH. A randomized sequential trial of creatine in amyotrophic lateral sclerosis. Ann Neurol. 2003;53:437–445. doi: 10.1002/ana.10554. [DOI] [PubMed] [Google Scholar]
- Hersch SM, Gevorkian S, Marder K, Moskowitz C, Feigin A, Cox M, Como P, Zimmerman C, Lin M, Zhang L, Ulug AM, Beal MF, Matson W, Bogdanov M, Ebbel E, Zaleta A, Kaneko Y, Jenkins B, Hevelone N, Zhang H, Yu H, Schoenfeld D, Ferrante R, Rosas HD. Creatine in Huntington disease is safe, tolerable, bioavailable in brain and reduces serum 8OH2′dG. Neurology. 2006;66:250–252. doi: 10.1212/01.wnl.0000194318.74946.b6. [DOI] [PubMed] [Google Scholar]
- Jenkins BG, Andreassen OA, Dedeoglu A, Leavitt B, Hayden M, Borchelt D, Ross CA, Ferrante RJ, Beal MF. Effects of CAG repeat length, HTT protein length and protein context on cerebral metabolism measured using magnetic resonance spectroscopy in transgenic mouse models of Huntington's disease. J Neurochem. 2005;95:553–562. doi: 10.1111/j.1471-4159.2005.03411.x. [DOI] [PubMed] [Google Scholar]
- Jenkins BG, Klivenyi P, Kustermann E, Andreassen OA, Ferrante RJ, Rosen BR, Beal MF. Nonlinear decrease over time in N-acetyl aspartate levels in the absence of neuronal loss and increases in glutamine and glucose in transgenic Huntington's disease mice. J Neurochem. 2000;74:2108–2119. doi: 10.1046/j.1471-4159.2000.0742108.x. [DOI] [PubMed] [Google Scholar]
- Kalra S, Arnold DL. ALS surrogate markers. MRS. Amyotroph Lateral Scler Other Motor Neuron Disord. 2004;5 1:111–114. doi: 10.1080/17434470410019861. [DOI] [PubMed] [Google Scholar]
- Kalra S, Arnold DL, Cashman NR. Biological markers in the diagnosis and treatment of ALS. J Neurol Sci. 1999;165 1:S27–32. doi: 10.1016/s0022-510x(99)00023-4. [DOI] [PubMed] [Google Scholar]
- Klivenyi P, Ferrante RJ, Matthews RT, Bogdanov MB, Klein AM, Andreassen OA, Mueller G, Wermer M, Kaddurah-Daouk R, Beal MF. Neuroprotective effects of creatine in a transgenic animal model of amyotrophic lateral sclerosis. Nat Med. 1999;5:347–350. doi: 10.1038/6568. [DOI] [PubMed] [Google Scholar]
- Li DK, Li MJ, Traboulsee A, Zhao G, Riddehough A, Paty D. The use of MRI as an outcome measure in clinical trials. Adv Neurol. 2006;98:203–226. [PubMed] [Google Scholar]
- Marjanska M, Curran GL, Wengenack TM, Henry PG, Bliss RL, Poduslo JF, Jack CR, Jr, Ugurbil K, Garwood M. Monitoring disease progression in transgenic mouse models of Alzheimer's disease with proton magnetic resonance spectroscopy. Proc Natl Acad Sci U S A. 2005;102:11906–11910. doi: 10.1073/pnas.0505513102. [DOI] [PMC free article] [PubMed] [Google Scholar]
- Miller DH. MRI monitoring of MS in clinical trials. Clin Neurol Neurosurg. 2002;104:236–243. doi: 10.1016/s0303-8467(02)00045-8. [DOI] [PubMed] [Google Scholar]
- Neale JH, Olszewski RT, Gehl LM, Wroblewska B, Bzdega T. The neurotransmitter N-acetylaspartylglutamate in models of pain, ALS, diabetic neuropathy, CNS injury and schizophrenia. Trends Pharmacol Sci. 2005;26:477–484. doi: 10.1016/j.tips.2005.07.004. [DOI] [PubMed] [Google Scholar]
- Niessen HG, Debska-Vielhaber G, Sander K, Angenstein F, Ludolph AC, Hilfert L, Willker W, Leibfritz D, Heinze HJ, Kunz WS, Vielhaber S. Metabolic progression markers of neurodegeneration in the transgenic G93A-SOD1 mouse model of amyotrophic lateral sclerosis. Eur J Neurosci. 2007;25:1669–1677. doi: 10.1111/j.1460-9568.2007.05415.x. [DOI] [PubMed] [Google Scholar]
- Pioro EP, Majors AW, Mitsumoto H, Nelson DR, Ng TC. 1H-MRS evidence of neurodegeneration and excess glutamate + glutamine in ALS medulla. Neurology. 1999;53:71–79. doi: 10.1212/wnl.53.1.71. [DOI] [PubMed] [Google Scholar]
- Plaitakis A, Constantakakis E. Altered metabolism of excitatory amino acids, N-acetyl-aspartate and N-acetyl-aspartyl-glutamate in amyotrophic lateral sclerosis. Brain Res Bull. 1993;30:381–386. doi: 10.1016/0361-9230(93)90269-h. [DOI] [PubMed] [Google Scholar]
- Rosenfeld J, King RM, Jackson CE, Bedlack RS, Barohn RJ, Dick A, Phillips LH, Chapin J, Gelinas DF, Lou JS. Creatine monohydrate in ALS: effects on strength, fatigue, respiratory status and ALSFRS. Amyotroph Lateral Scler. 2008;9:266–272. doi: 10.1080/17482960802028890. [DOI] [PMC free article] [PubMed] [Google Scholar]
- Rothstein JD, Patel S, Regan MR, Haenggeli C, Huang YH, Bergles DE, Jin L, Dykes Hoberg M, Vidensky S, Chung DS, Toan SV, Bruijn LI, Su ZZ, Gupta P, Fisher PB. Beta-lactam antibiotics offer neuroprotection by increasing glutamate transporter expression. Nature. 2005;433:73–77. doi: 10.1038/nature03180. [DOI] [PubMed] [Google Scholar]
- Rothstein JD, Van Kammen M, Levey AI, Martin LJ, Kuncl RW. Selective loss of glial glutamate transporter GLT-1 in amyotrophic lateral sclerosis. Ann Neurol. 1995;38:73–84. doi: 10.1002/ana.410380114. [DOI] [PubMed] [Google Scholar]
- Scott S, Kranz JE, Cole J, Lincecum JM, Thompson K, Kelly N, Bostrom A, Theodoss J, Al-Nakhala BM, Vieira FG, Ramasubbu J, Heywood JA. Design, power, and interpretation of studies in the standard murine model of ALS. Amyotroph Lateral Scler. 2008;9:4–15. doi: 10.1080/17482960701856300. [DOI] [PubMed] [Google Scholar]
- Shefner JM, Cudkowicz ME, Schoenfeld D, Conrad T, Taft J, Chilton M, Urbinelli L, Qureshi M, Zhang H, Pestronk A, Caress J, Donofrio P, Sorenson E, Bradley W, Lomen-Hoerth C, Pioro E, Rezania K, Ross M, Pascuzzi R, Heiman-Patterson T, Tandan R, Mitsumoto H, Rothstein J, Smith-Palmer T, MacDonald D, Burke D. A clinical trial of creatine in ALS. Neurology. 2004;63:1656–1661. doi: 10.1212/01.wnl.0000142992.81995.f0. [DOI] [PubMed] [Google Scholar]
- Snow RJ, Turnbull J, da Silva S, Jiang F, Tarnopolsky MA. Creatine supplementation and riluzole treatment provide similar beneficial effects in copper, zinc superoxide dismutase (G93A) transgenic mice. Neuroscience. 2003;119:661–667. doi: 10.1016/s0306-4522(03)00212-4. [DOI] [PubMed] [Google Scholar]
- Tkac I, Dubinsky JM, Keene CD, Gruetter R, Low WC. Neurochemical changes in Huntington R6/2 mouse striatum detected by in vivo 1H NMR spectroscopy. J Neurochem. 2007;100:1397–1406. doi: 10.1111/j.1471-4159.2006.04323.x. [DOI] [PMC free article] [PubMed] [Google Scholar]
- Tkac I, Keene CD, Pfeuffer J, Low WC, Gruetter R. Metabolic changes in quinolinic acid-lesioned rat striatum detected non-invasively by in vivo (1)H NMR spectroscopy. J Neurosci Res. 2001;66:891–898. doi: 10.1002/jnr.10112. [DOI] [PubMed] [Google Scholar]
- Tsai G, Cork LC, Slusher BS, Price D, Coyle JT. Abnormal acidic amino acids and N-acetylaspartylglutamate in hereditary canine motoneuron disease. Brain Res. 1993;629:305–309. doi: 10.1016/0006-8993(93)91335-p. [DOI] [PubMed] [Google Scholar]
- Tsai GC, Stauch-Slusher B, Sim L, Hedreen JC, Rothstein JD, Kuncl R, Coyle JT. Reductions in acidic amino acids and N-acetylaspartylglutamate in amyotrophic lateral sclerosis CNS. Brain Res. 1991;556:151–156. doi: 10.1016/0006-8993(91)90560-i. [DOI] [PubMed] [Google Scholar]
- Tsang TM, Woodman B, McLoughlin GA, Griffin JL, Tabrizi SJ, Bates GP, Holmes E. Metabolic characterization of the R6/2 transgenic mouse model of Huntington's disease by high-resolution MAS 1H NMR spectroscopy. J Proteome Res. 2006;5:483–492. doi: 10.1021/pr050244o. [DOI] [PubMed] [Google Scholar]
- Turner BJ, Talbot K. Transgenics, toxicity and therapeutics in rodent models of mutant SOD1-mediated familial ALS. Prog Neurobiol. 2008;85:94–134. doi: 10.1016/j.pneurobio.2008.01.001. [DOI] [PubMed] [Google Scholar]
- Vielhaber S, Kaufmann J, Kanowski M, Sailer M, Feistner H, Tempelmann C, Elger CE, Heinze HJ, Kunz WS. Effect of creatine supplementation on metabolite levels in ALS motor cortices. Exp Neurol. 2001;172:377–382. doi: 10.1006/exnr.2001.7797. [DOI] [PubMed] [Google Scholar]