Abstract
Differences in craniofacial anatomy among racial groups have been documented in a variety of structures but the oral and maxillofacial regions have been shown to be a particularly defining region of variability between different racial/ethnic groups. Such comparisons are informative, but they neither address developmental changes of the craniofacial anatomy, nor do they assess or take into account the natural variability within individual races that may account for similar reported, across-group variations. The purpose of this report was to compare – using medical imaging studies – the growth trend of select race sensitive craniofacial variables in the oral and pharyngeal regions when all races: White, Asian, Black, and Hispanic (AR) are included versus only a single race category: White (WR). Race effect was tested by comparing sex specific growth fits (4th degree polynomial model) for AR versus WR data. Findings indicate that the inclusion of all races versus a single race did not significantly alter the growth model fits. Thus, the inclusion of all races permits the advancement of general growth models; however, methodologically it is best to treat the race variable as a covariate in all future analysis to test for both potential all race effects or individual race effects, on general growth models.
Keywords: Race, Anthropometry, Craniofacial, Vocal Tract, Pharynx, Imaging, Development
Introduction
Anthropometric studies document differences in craniofacial features as well as in body characteristics among the different races (Farkas, 1994; Farkas et al., 2005). Differences in craniofacial anatomy among racial groups have been documented for a variety of structures throughout the head and neck through the use of direct measurements from radiography or in situ cephalometry (Enlow et al., 1982; Harris et al., 1977; Farkas et al., 2005). The oral and maxillofacial regions have been shown to be a particularly defining region of variability between racial groups. Enlow et al. (1982) reported mandible and maxillae measurement differences between Whites and Blacks. Similarly, Harris et al. (1977) reported significant differences in several craniofacial structures with Blacks having greater mandibular and ramal width, as well as larger alveolar height and length, as compared to Whites. Whereas many of the studies noting racial anatomic differences are based on adults, there are a limited number of studies on children indicating the presence of distinguishing anatomic differences in some craniofacial measurements. For example, Walker et al. (1975) reported that Black children have a flatter upper face profile and greater jaw protrusion than White children. In addition to the use of direct measurements from radiographic and cephalometric studies, a very limited number of studies have assessed racial differences of structures that are more difficult to measure – such as the nasal cavity or the oral-pharyngeal cavities i.e. the vocal tract (VT). These studies used indirect measurement techniques such as acoustic reflection (both acoustic rhinometry and acoustic pharyngometry) and speech acoustics since those cavities/regions can serve as an acoustic resonator. For example, Corey et al (1998), who used rhinometry, reported nasal cavity differences among Asians, Whites, and Blacks. Specifically, the nasal cavity volumes were consistently higher in Black subjects. Another study by Xue et al. (2006a, 2006b)), who used acoustic pharyngometry or acoustic reflection technique, reported that Asians have significantly larger oral volume and vocal tract volume than Whites and Blacks. Race differences in speech acoustics have also been documented, specifically differences in formant frequencies or the resonant frequencies of the vocal tract (Andrianopoulos et al., 2001; Mayo et al., 1996; Sapienza 1997; Walton and Orlikoff 1994). However, the overall findings have been inconclusive.
Assessment of racial differences in craniofacial structures, specifically the oral-pharyngeal anatomy, are predominantly from studies that used direct measurements from adults, focused on studying race as a dependent variable, and typically compared no more than two to three racial categories or racial groups. Such assessment of differences across racial groups are informative, however they do not address developmental changes of the craniofacial anatomy over the lifespan, such as whether differences are present at birth or whether differences emerge and increase during the course of development. Furthermore, they neither assess nor take into account the natural variability in craniofacial dimensions within individual races (within group variations). Thus, it is not clear how the documented differences across the different racial/ethnic groups relate to the natural variability or variations within the different racial/ethnic groups. These issues are further complicated by the fact that the natural inclusion of an adequate number of individuals representative of the racial groups of interest is often limited by the demographics of the available study population. Also, the retrospective study of race specific outcomes faces additional issues such as the self report of race/ethnic group during intake (as is the case with census reports), and the likelihood of not reporting race or selecting a combination of races (e.g. biracial). Indeed, the distinctiveness of the different racial and ethnic categories may be evolving as the number of interracial offspring and immigrants are increasing (Waters, 2000). This latter issue is also applicable to prospective studies. Thus, whereas it is becoming increasingly difficult to control for race to study race differences between racial/ethnic groups, it is nonetheless an important variable to have in research design even if the research focus is not exclusive to examining racial/ethnic group differences. So, instead of restricting a developmental study design to a particular racial group because the variables being examined are in a region where racial group differences have been reported, it could be more advantageous to include all races and document race as a variable to examine its effect. Such an approach in research design can help determine if study findings are universal or if study findings should be restricted to a specific racial group. To study such an inclusive approach in research design, we hypothesized that the natural variability that is present in craniofacial anatomic structures within the predominant race of a geographic region (within group variations) will encompass individual race variations across all the different races (across group variations) i.e. we hypothesized no race effect on growth. Findings that support such a hypothesis of no race effect would have implications for studies on the development of craniofacial structures where general, race independent, developmental models may be advanced while using racially diverse populations. To this end, we compared the sex specific growth trends of race sensitive craniofacial variables in the oral and pharyngeal regions in two groups. The first group included all races (AR; White, Asian, Black, and Hispanic), and the second included only a single/predominant race - Whites (WR). In this paper, we refer to this comparison as race effect.
Materials and Methods
Subjects
A predefined set of craniofacial measurements were taken retrospectively from 723 imaging studies (MRI and CT; 336 females and 387 males) of typically developing individuals ages birth to 19 years who were imaged for medical reasons – such as pain or infection in the head, neck, or facial regions – considered very unlikely to affect growth and development. The weights of the majority of the cases were at the 50th percentile reference growth curves for boys and girls, with all cases falling between the 25th and 95th percentile growth curves as per the National Center of Health Statistics growth charts (Centers for Disease Control and Prevention -CDC-, 2000). The race, as reported at intake in medical records, of the individuals whose imaging studies were measured included 667 Whites (359 Male, 308 Female), 22 Asians (10 Male, 12 Female), 18 Blacks (6 Males, 12 Females) and 16 Hispanics (12 Males, 4 Females). In all, the pool consisted of 92.3 % Whites, 3% Asians, 2.5 % Blacks, and 2.2 % Hispanics. No biracial categories were reported. According to the 2007 US Census Bureau census data (http://quickfacts.census.gov/qfd/states/55/55025.html), this racial distribution is representative of the demographics of the county (Dane County) where this study took place. Of note, the race/ethnic group categories on the intake form included the same groups or categories as those used by the National Institute of Health (NIH) for reporting study enrollment (http://www.grants.nih.gov/grants/funding/phs398/enrollment.pdf).
Image Acquisition
The medical imaging studies used for making measurements included both MRI and CT cases and are from an imaging database developed/acquired retrospectively, following Institutional Review Board (IRB) approval, for the purpose of characterizing the growth of the oral and pharyngeal cavities and thus all the structures in this region could be visualized. This imaging database is representative of the age range of development with an equivalent number of males and females per age/year, and as noted above, all imaging studies were from typically developing individuals who were imaged for medical reasons. Details for the methods of image acquisition and measurement have been described in detail in Vorperian et al. (1999; 2005) for MRI, and Vorperian et al. (2009) for CT. In brief, the head and neck imaging studies were performed with the subject’s head/face placed centrally in the scanner using the laser lights of the scanner with the neck in the neutral position. Also, as guided by the scout image, the head tilt was adjusted such that the Reid base line (reference line from infraorbital rim to external auditory canal) was perpendicular to the table top i.e. axial scans were acquired parallel to the Reid base line. The head was held in position by foam sponges placed between the head holder and the patient’s head, and all images were acquired during quiet respiration. Virtually all pediatric subjects, particularly those less than age 10 years, were sedated using either chloral hydrate 50 mg/kg administered orally, or DPT (Demerol, Phenergan, and Thorazine), or Propofol, Midazolam, Atropine, or Fentanyl administered intramuscularly (1 mg/kg), prior to imaging study.
The in-plane image resolution varied but based on calculations from the sagittal images used in this study - where image resolution equals the ratio of field of view (FOV) divided by the matrix - the calculated image resolution was in the range of .58 to 1.17 mm for MRI and 0.29 to 0.59 mm for CT. The MR images were obtained using either a General Electric or Resonex MR scanner with a head receiver coil. T1- and T2-weighted images were obtained using spin-echo and fast spin-echo pulse sequences in sagittal, axial, and coronal planes with slice thickness of 2.5–5.0 mm, FOV in the range of 15 to 30 cm, and square matrix size of 256 or 512. The CT studies were obtained using several different models of General Electrical multi-slice helical CT scanners. CT scans were directly acquired in the axial plane with a 1.25 mm slice thickness. The axial images were reconstructed with a matrix size of 512 × 512 using two different algorithms (standard, bone plus) to provide two image sets, one optimized for soft tissue detail (standard algorithm) and one optimized for bone detail (bone algorithm). The axial images were then used to generate multiplanar reformatted images in the sagittal and coronal planes with a 2–3 mm slice thickness from the thoracic inlet, inferiorly, to the top of the orbits, superiorly using a 15–30 cm FOV.
The images were initially stored on a McKesson Horizon Rad Station PACS system. Next, the images were set anonymous using a General Electric Advantage Windows workstation. Then, the entire study was saved in DICOM format for image analysis and data acquisition. The midsagittal slice was used for data acquisition/measurement of the variables as defined below. Midsagittal slice selection was based on the visualization of midline structures on the images. These included identification of distinct cerebral sulci extending to the corpus callosum, fourth ventricle, full length of the cerebral aqueduct of Sylvius, pineal gland, pituitary gland and stalk, sella turcica, crista galli, odontoid process, medial part of the optic chiasm, brainstem, and cervical spinal cord. The neutral neck position was verified via a control measurement of the cervical spine flexion or extension where the angle subtended by two lines, the first of which was drawn tangential to the posterior margins of C2 and C3, and the second drawn tangential to the posterior margins of C3 and C4 was in the range of 180 degrees. Colinearity of the posterior margins of the vertebral bodies of C2, C3 and C4 indicated a neutral neck position (Shorten et al., 1994).
Data Acquisition
Data acquisition entailed making measurements of the variables defined below from the selected midsagittal slice using the image measurement software SigmaScan Pro by SYSTAT (formerly SPSS and Jandel Scientific). The software was calibrated for each case/slice using the hash scale mark present on the original imaging study. Landmarks for making measurements were placed on the selected midsagittal slice (bone algorithm for CT) by 2 researchers independently. The two sets of landmarks were then compared, discrepancies resolved by a medical expert, and a final/master set of landmarks was used for making measurements. Given the developmental nature of this study, the use of this landmark placement protocol improved measurement accuracy between 82% and 100% (average 98%) as measured by reduction in error variability for the general 58 variables measured in our research study. The discrepancies or measurement differences (in cm units) between the two researchers for the five variables measured for this study were < 0.054 cm. The CT and MRI data were combined for increased statistical power after comparing the two sets of data from 16 cases that had both an MRI & CT study in less than a three month interval. The measurement discrepancy between CT and MRI for the variables used in this study was not significant as determined by paired t-tests (p-value > 0.5) with an absolute error in the range of .45 to 1.11 mm.
Variables
The variables (and their definitions) used to assess the anthropometric differences of race for our study were taken from areas in the oral and pharyngeal regions that have been reported to show distinct racial/ethnic differences and are as follows: Vocal Tract Length (VT Length; curvilinear distance from points B-to-C in Figure 1). The curvilinear distance along the midline of the tract starting at the glottis (level of true vocal folds) to the intersection with a line drawn tangentially to the lips. Vocal Tract Vertical (VT-Vertical; vertical distance from point A-to-J in Figure 1): The vertical distance from the glottis to the palatal plane (H-to-I plane) or the ANS-PNS plane that extends from the Anterior Nasal Spine to the Posterior Nasal Spine. Vocal Tract Horizontal (VT-Horizontal; horizontal distance C-to-G in Figure 1): The horizontal distance from a line tangential to lips to the posterior pharyngeal wall. Naso-oropharyngeal length (Nasopharynx; distance from point F-to-J in Figure 1): The distance along the VT-V plane between the palatal plane or ANS-PNS plane (H-to-I plane) and VT-H plane (Vocal Tract Horizontal; C-to-G plane). Oro-hypopharyngeal width (Oropharynx; distance F to G in Figure 1.): The distance along the VT-H (C-to-G plane) plane from the point where VT-V line (A-to-J) intersects with VT-H to the posterior pharyngeal wall or the point where VT-H ends.
Figure 1.
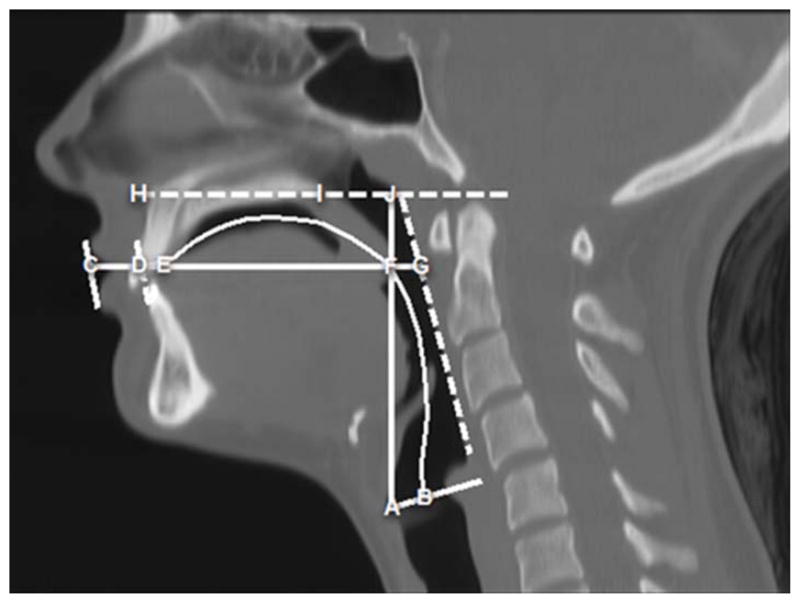
Midsagittal CT image displaying the variables used to assess the anthropometric differences of race for our study. Variables include: Vocal Tract Length (VT Length): the curvilinear line extending from points B to C. Vocal Tract-Vertical (VT-Vertical): vertical distance from points A to J. Nasopharyngeal Length (Nasopharynx): vertical distance from points F to J. Vocal Tract-Horizontal (VT-Horizontal): horizontal distance from points C to G. Oro-hypopharyngeal width (Oropharynx): points F to G.
Statistical Analysis
The data/measurements for each of the five variables from all individuals of all races (AR, i.e. Whites plus non-Whites) versus Whites only (WR) were first fit with a fourth degree polynomial regression to characterize the nonlinear growth trend for males and females and sex differences were tested using the F-statistic. For additional detail and model selection justification see Vorperian et al., 2009. The following model specifies the growth fit used in this analysis:.
The fourth degree polynomial regression model was first fitted for each sex separately. The effect of race was then examined by testing the significance of the race term using the F-statistic.
In addition, given the considerably large proportion of White subjects to the subjects in all the other races in this study we also performed a stability (or sensitivity) analysis of our proposed statistical analysis framework. This entailed repeating the analyses with subsampled White subjects using the same statistical model i.e. we changed the number of White subjects in multiples of the non-White subjects and assessed if the number of White subjects affects the significance of the race variable in our model. The stability analysis was done as follows: For each variable and sex, let NNW be the number of non-White race subjects, which is substantially smaller than the number of White subjects. NNW ranged from 30 to 33 in males and 32 to 35 in females. We then randomly subsampled the White subjects in multiples of NNW. So, the new resampled data sets consisted of NNW non-White subjects and the multiples of NNW White subjects. For example, for VT-Horizontal and male subjects, NNW =33 so we randomly sampled 33 (=33×1), 66 (=33×2),…, 264 (=33×8), 281 subjects from the White race subjects. If the statistical decision is not changed for the subsampled data, we can say that our statistical analysis is stable regardless of the race composition.
Results
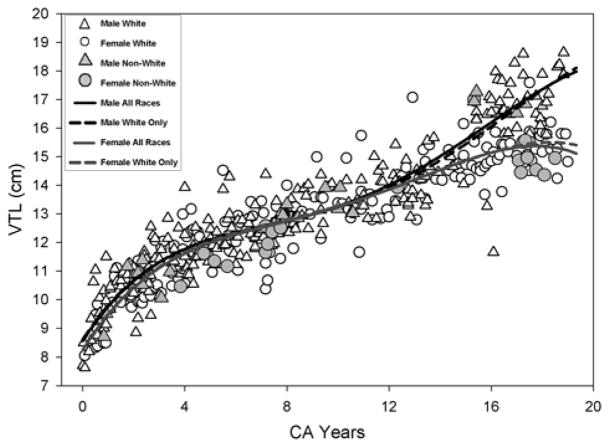
The test for sex differences of the fourth degree polynomial fits for AR versus WR (comparisons of the male solid line fit versus female solid fit; and male dashed fit versus female dashed fit) showed significant differences (p <.001) between males and females for all the variables tested in both the AR and WR groups. Next, race effect was tested between AR versus WR by comparing the fourth degree polynomial fits for the selected 5 VT variables in regions that are reportedly race sensitive (comparisons of the male black steady line fits versus black dashed line fits; and female gray steady line fits versus gray dashed line fits). Given the demographics of the county of this study and the limited number of individuals per racial category, race effect was assessed by comparing the combination of all races (AR) versus the predominant White race (WR). Findings, as expected, showed no significant race effect for males and females. See Table 1.
Table 1.
F-test and p-value of the race term comparing the fourth degree polynomial regression model of each vocal tract structure for each sex (AR vs WR).
| Males | Females | |
|---|---|---|
| VT Length | F(1,268)=1.3697, p=0.243 | F(1,207)=0.0069, p=0.934 |
| VT-Vertical | F(1,271)=0.2590, p=0.611 | F(1,211)=0.2561, p=0.613 |
| VT-Horizontal | F(1,308)=0.3335, p=0.564 | F(1,247)=0.0302, p=0.862 |
| Naso-oropharyngeal length | F(1,300)=0.5944, p=0.441 | F(1,232)=0.2220, p=0.638 |
| Oropharyngeal width | F(1,275)=1.1600, p=0.282 | F(1,212)=0.0481, p=0.827 |
Visual inspection of the scatterplots in Figures 2 to 6, show that the variability in measurements during the course of development for within-group measurements (WR, open white circles/females and open white triangles/males) encompasses the variations across all racial groups where the shaded symbols representing measurements from Asians, Blacks, and Hispanics fall within the range of white symbols for Whites. In other words, the range of variability in measurements from non-Whites (shaded symbols) falls within the range of variability of measurements of the WR. The statistical tests for race effect comparing the fourth degree polynomial regression for AR versus WR for each vocal tract variable (VT Length, VT-Vertical, VT-Horizontal, Nasopharynx, and Oropharynx) were not significant. As seen in Figures 2 to 6, the regression model fits for all races (dashed line) versus Whites only (solid line) are almost identical. Table 1 summarizes the statistics comparing the AR versus WR growth fits where there are no statistically significant differences in both males and females for all five vocal tract variables tested. Though there is a noticeable divergence between the fit lines of males and females for both Whites and non-Whites near the 150 month (age 12.5 years) mark, this divergence captures the expected sexual dimorphism of the VT structures with the onset of puberty/adolescence.
Figure 2.
Growth for the VTL measurement using the fourth degree polynomial regression is shown. The solid line and the dashed line show the model fit for all races (AR) and Whites only (WR) respectively.
Figure 6.
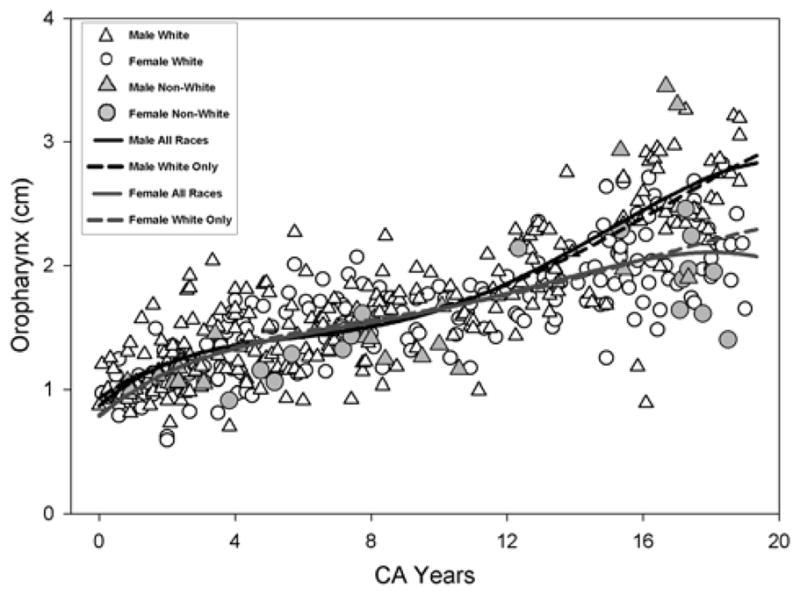
Growth for the Oropharynx measurement using the fourth degree polynomial regression is shown. The solid line and the dashed line show the model fit for all races (AR) and Whites only (WR) respectively.
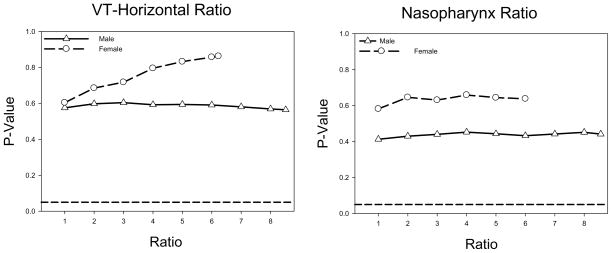
The findings reported above of no significant differences for race effect in the general growth of the five variables examined were further confirmed by findings from the stability analysis performed on all five variables measured while taking age into account. In other words, changing the number of White subjects did not change the outcome of the stability analysis where the findings for all five variables showed the lack of race effect (p> 0.2). Figures 7 displays the findings of the stability analysis for two representative variables demonstrating that the findings are not altered by sample size for Whites.
Figure 7.
Stability analysis results for the variables VT-Horizontal and Nasopharynx. The plots display the p-value of the race term in the growth model as a function of the ratio of the number of White subjects to the number of non-White subjects. The ratio range was affected by the number of available age matched White subjects which was more for males than females. The dashed line reflects the level of significance at the 0.05 level.
Discussion
The purpose of this study was to determine if general anthropometric growth models can be advanced rather than race specific growth models - which are rather impracticable to implement. To this end, we tested race/ethnic effects on growth during the course of development of five variables measured in the oral and pharyngeal regions which, as reviewed in the introduction, are regions with documented racial differences. Our findings as hypothesized and further confirmed by the stability analysis performed, reflected no significant differences in the growth trends of the 5 variables examined (VT Length, VT-Horizontal, VT-Vertical, Nasopharynx, and Oropharynx) across the two distinct observation groups, the first of which included all four races/ethnicities (AR) and the second included a single/predominant White race (WR). The natural variability in measurements of the craniofacial variables in the oral and pharyngeal regions within the predominant race (WR) encompassed the variability among all the different races (AR). These findings were expected given our developmental focus, and the modest representation of the different non-dominant races as mandated by the natural demographics of where this study took place. This latter potential confound however was determined not to be an issue based on the outcome of the stability analysis where the growth analysis framework withheld the test of subsampling. In other words, the findings for all variables examined continued to show no race effect even when the number of WR group was equivalent to AR group or was increased in multiples of the AR group. Thus, our results support general sex specific but race independent anthropometric growth models. Such an outcome is suggestive of ‘universal applicability’ and is consistent with the World Health Organization (WHO, 2006) report on growth standards documenting growth to be remarkably similar during early childhood across human populations from diverse continental groups.
Although we did not find race effects in this particular developmental study, this does not imply that there are no specific individual race/ethnic group differences. In other words, our findings do not counter racial differences described by Xue et al. (2006a, 2006b), Corey et al. (1998) and Andrianopoulos et al. (2001) with respect to race differences in the dimensions of the vocal tract and the nasal and oral structures. The design of those studies focused on race specific anatomic differences in adults (i.e. race is the dependent variable), whereas the focus of this study was on establishing developmental growth models and included all races. In other words, this study assessed the effect of all races on development, not the effect of the individual races on development. To study the effect of individual race groups on development, it would be necessary to have an equally large number of representation/subjects from each race at every age group that spans the entire course of development. However, this sort of demographic representation is rarely present and therefore is impracticable to implement. Oftentimes, natural demographics tend to exhibit population trends that are more homogenous in nature and reflect racial variability in terms of a majority and minority.
Furthermore, and more importantly, the reporting of race that is typically used in studies on race effect is not necessarily scientifically accurate or anthropological in nature. Yokota’s (2005) findings confirm that self reported race does not always accurately reflect biological background. Indeed, the United States (U.S.) Census Bureau (2007) specifies that: “The concept of race as used by the Census Bureau reflects self-identification by people according to the race or races with which they most closely identify. These categories are socio-political constructs and should not be interpreted as being scientific or anthropological in nature. Furthermore, the race categories include both racial and national-origin groups. (http://quickfacts.census.gov/qfd/meta/long_RHI125207.htm).” This last sentence further highlights the notion that the terms race and ethnicity are not interchangeable or additive. However, they are often interpreted to be exclusive of one another. This misconception is further reinforced and not alleviated by the forms used to report race and ethnicity by the U.S. Census Bureau, the hospital intake at time of registration, as well as the inclusion report required by NIH or other funding agencies. These forms, in addition to listing the major race categories, list a broad Hispanic or Latino category without specific racial categories and thus inadvertently reinforce the inaccurate notion that ethnicity is exclusive of race.
Our study, as mandated by natural demographics, had only a small dataset from the non-White group. The findings, with additional support from the stability analysis performed, supports a general race independent growth model, and indicates that it is unlikely that there is a need to develop race specific growth models even when race specific differences of the structures are present. However, it is possible that different sampling strategies and study designs with a larger proportion of racial/ethnic diversity may show significant race differences in growth trend. Our findings suggest that, if one is analyzing a sample that includes a population with limited racial/ethnic variability, a more general model that is race independent may be reached by testing for race effects. Thus, our findings and approach embrace a study design that includes all races/ethnic groups, but controls for the race/ethnic variable to assess race effects and determine whether the findings are generalizable and race independent. At a larger scale with more demographic diversity, such a design would also make it possible to test for individual race group effects, i.e. include race/ethnicity as a covariate in data analysis to test for race group effects. In other words, the treatment of the race variable as a covariate in the analysis permits the modeling of a general race independent growth model, but permits the assessment of overall race effects as well as individual race differences, granted that there are an adequate number of subjects representative of a particular race/ethnicity at all ages. Indeed race/ethnicity is one factor used to determine anatomical differences, however there is evidence that suggests anatomical differences are correlated to other factors like body size and environmental factors. For example, Fitch and Geidd (1999) reported a significant positive correlation between Vocal Tract Length and body size (either height or weight), whereas Buretic-Tomljanovic et al. (2007) found that environmental factors such as diet, climate, and weather had a significant effect on body height and craniofacial variability in adults aged 18 to 21. These findings, along with ours, as well as the WHO (2006) report noted above, show that anatomical differences can be attributed to factors other than race/ethnicity and ideally should be tested for without undue limitations on subject inclusion or enrollment criteria.
The methodology of this study, using existing medical imaging studies to make measurements, mandated the definition of novel measurements that were equivalent but not identical to previously reported race sensitive measurements in the literature. This was the case due to methodological differences, where most studies used radiographic or cephalometric studies that did not use digital imaging and computer technology. Also, many of the measurement definitions and landmarks in the literature were nonspecific and the start and end points of measurements were not clearly stated. The use of existing digital medical imaging studies (CT and MR) along with the use of precise measurement software allowed us to capture greater accuracy of anatomic landmarking and reduce the variability in methodology of our measurements thus giving us an opportunity to produce a study of consistency and repeated measurability. Moreover, by using medical imaging technology we were able to have greater access and mobility for making measurements in regions that were historically more difficult to measure using standard cephalometry, such as measurements in the oral-pharyngeal region. Thus, although to date, most anatomic measurements from radiographic studies and cephalometry have been used to make linear and angular measurements to study race differences, this novel approach of using medical imaging studies permits similar anatomic measurements that are direct, accurate and reliable to assess racial differences. Furthermore, this approach also provides a means to study racial differences of oral and pharyngeal structures and cavities that are difficult to directly measure otherwise and has implications for prospective research studies that assess individual race group effects using volumetric measurements. Thus, such methodology can help augment and validate research findings from a region that is difficult to measure where indirect measurement techniques had to be used such as acoustic pharyngometry and acoustic rhinometry.
To conclude, this study confirms the feasibility of advancing general anthropometric growth models by assessing racial/ethnic anatomic effects on growth within the construct of a purely anatomic framework (cf. Smedley and Smedlely, 2005). Our findings, using medical imaging technology, indicate that it is unlikely that race specific growth models need to be established even when the variables have know racial differences. Thus, much like the approach taken by WHO (2006), it is feasible to include a large heterogeneous group in research on development. Such a design, where race among other critical variables are accounted for in statistical analyses, is ideal in that it permits the advancement of growth models that are generalizable and race independent without discounting the likelihood of race effects. Such a design also meets the directive of research funding agencies to be inclusive of the different racial/ethnic groups.
Figure 3.
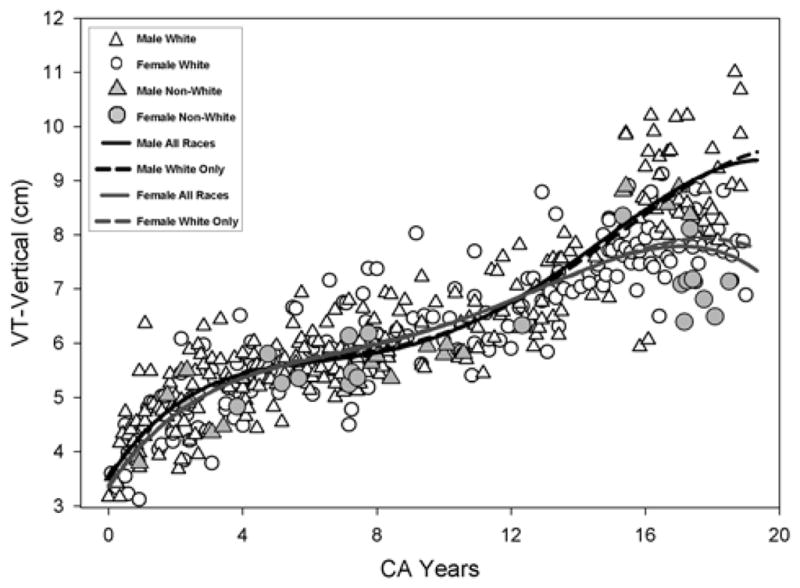
Growth for the VT-Vertical measurement using the fourth degree polynomial regression is shown. The solid line and the dashed line show the model fit for all races (AR) and Whites only (WR) respectively
Figure 4.
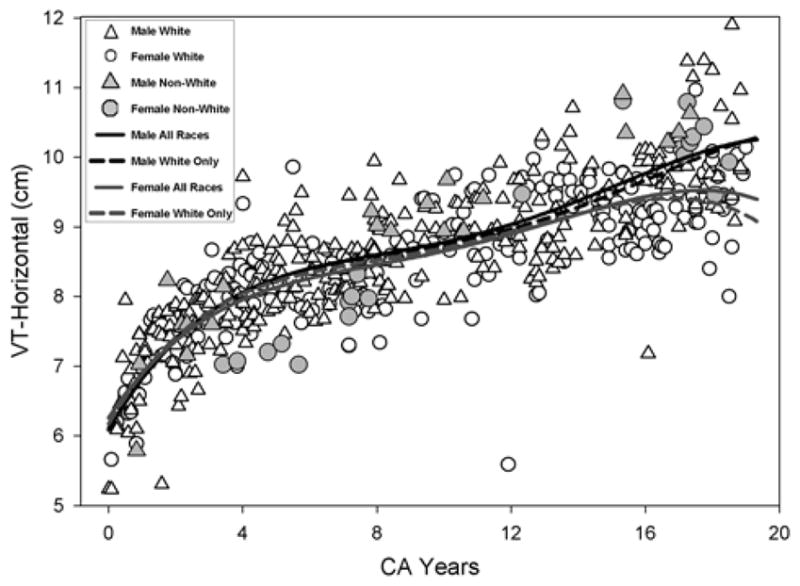
Growth for the VT-Horizontal measurement using the fourth degree polynomial regression is shown. The solid line and the dashed line show the model fit for all races (AR) and Whites only (WR) respectively.
Figure 5.
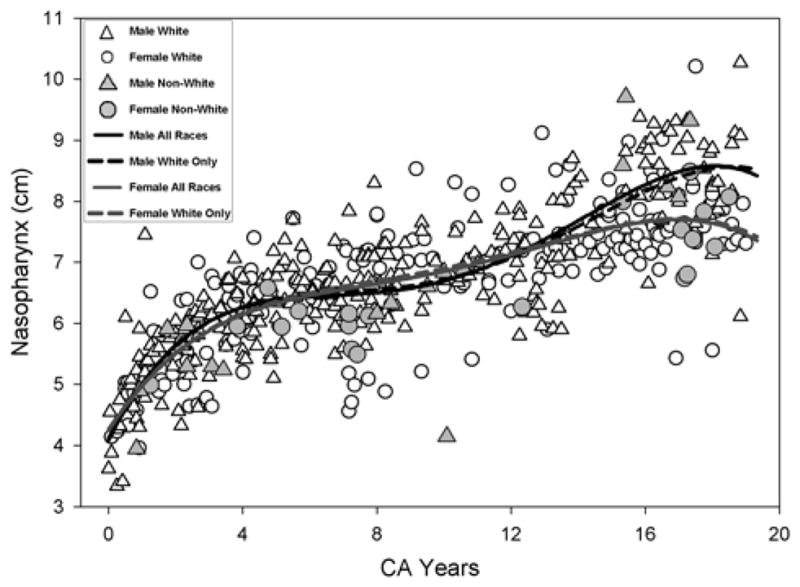
Growth for the each Nasopharynx measurement using the fourth degree polynomial regression is shown. The solid line and the dashed line show the model fit for all races (AR) and Whites only (WR) respectively.
Acknowledgments
This work was supported in part by NIH Research Grants R03 DC4362 (Anatomic Development of the Vocal Tract: MRI Procedures), and R01 DC6282 (MRI and CT Studies of the Developing Vocal Tract), from the National Institute of Deafness and other Communicative Disorders (NIDCD). Also, by a core grant P-30 HD03352 to the Waisman Center from the National Institute of Child Health and Human Development (NICHHD). We thank Celia S. Choih and E. Michael Schimek for assistance with placing the anatomic landmarks and making the necessary measurements, and Erin V. Douglas for assistance with manuscript preparation. Finally, we sincerely thank Ray Kent and four anonymous reviewers for their critical review of this paper.
Contributor Information
Reid B. Durtschi, Waisman Center, University of Wisconsin-Madison, 1500 Highland Avenue, # 429, Madison, Wisconsin 53705
Dongjun Chung, Department of Statistics, University of Wisconsin Madison, 1220 Medical Sciences Center, 1300 University Ave, Madison, WI 53706.
Lindell R. Gentry, Department of Radiology, University of Wisconsin Hospital and Clinics, 600 Highland Avenue, E1-311 Clinical Science Center, Madison, Wisconsin 53792
Moo K. Chung, Departments of Biostatistics & Medical Informatics, University of Wisconsin-Madison, 1500 Highland Avenue, Madison, WI 53705
Houri K. Vorperian, Waisman Center, University of Wisconsin-Madison, 1500 Highland Avenue, # 481, Madison, Wisconsin 53705.
References
- Andrianopoulos MV, Darrow K, Chen J. Multimodal Standardization of Voice among Four Multicultural Populations Formant Structures. Journal of Voice. 2001;15:61–77. doi: 10.1016/S0892-1997(01)00007-8. [DOI] [PubMed] [Google Scholar]
- Buretic-Tomljanovic A, Giacometti J, Ostojic S, Kapovic M. Sex specific differences of craniofacial traits in Croatia: The impact of environment in a small geographic area. Annals of Human Biology. 2007;34:296–314. doi: 10.1080/03014460701211017. [DOI] [PubMed] [Google Scholar]
- Centers for Disease Control and Prevention. Clinical Growth Charts. National Center for Health Statistics; 2000. [accessesed April 2008]. URL: http://www.cdc.gov/growthcharts/ [Google Scholar]
- Corey JP, Gungor A, Nelson R, Liu X, Fredberg J. Normative Standards for Nasal Cross-Sectional Areas by Race as Measured by Acoustic Rhinometry. Archives of Otolaryngology- Head and Neck Surgery. 1998;119:389–93. doi: 10.1016/S0194-5998(98)70085-3. [DOI] [PubMed] [Google Scholar]
- Enlow DH, Pfister C, Righardson E, Kuroda T. An Analysis of Black and Caucasian Craniofacial Patterns. The Angle Orthodontist. 1982;52:281–287. doi: 10.1043/0003-3219(1982)052<0279:AAOBAC>2.0.CO;2. [DOI] [PubMed] [Google Scholar]
- Farkas LG. Anthropometry of the Head and Face. 2. New York: Raven Press; 1994. [Google Scholar]
- Farkas LG, Katic MJ, Forrest CR. International anthropometric study of facial morphology in various ethnic groups/races. The Journal of Craniofacial Surgery. 2005;16:616–646. doi: 10.1097/01.scs.0000171847.58031.9e. [DOI] [PubMed] [Google Scholar]
- Fitch WT, Giedd J. Morphology and development of the human vocal tract: A study using magnetic resonance imaging. Journal of the Acoustical Society of America. 1999;106:1511–1522. doi: 10.1121/1.427148. [DOI] [PubMed] [Google Scholar]
- Harris JE, Kowalski CJ, LeVasseur FA, Nasjleti CE, Walker GF. Age and race as factors in craniofacial growth and development. J Dent Res. 1977;56:266–74. doi: 10.1177/00220345770560031201. [DOI] [PubMed] [Google Scholar]
- Mayo R, Floyd LA, Warren DW, Dalston RM, Mayo CM. Nasalence and Nasal Area Values: Cross-Racial Study. Cleft Palate-Craniofacial Journal. 1999;33:143–149. doi: 10.1597/1545-1569_1996_033_0143_nanavc_2.3.co_2. [DOI] [PubMed] [Google Scholar]
- National Institutes of Health. [accessed June 2009];Target/Planned enrollment table. 2007 URL: http://www.grants.nih.gov/grants/funding/phs398/enrollment.pdf.
- Sapienza CM. Aerodynamic and acoustic characterisitics of the adult African American voice. Journal of Voice. 1997;11:410–416. doi: 10.1016/s0892-1997(97)80036-7. [DOI] [PubMed] [Google Scholar]
- Shorten GD, Opie NJ, Graziotti P, Morris I, Khangure M. Assessment of upper airway anatomy in awake, sedated and anesthetized patients using magnetic resonance imageing. Anesthesia and Intensive Care. 1994;22:165–169. doi: 10.1177/0310057X9402200208. [DOI] [PubMed] [Google Scholar]
- Smedley A, Smedley BD. Race as Biology is Fiction, Racism as a Social Problem is Real: Anthropological and Historical Perspectives on the Social Construction of Race. American Psycholologist. 2005;60:16–26. doi: 10.1037/0003-066X.60.1.16. [DOI] [PubMed] [Google Scholar]
- U.S. Census Bureau. State & County QuickFacts. Dane County; WI: 2007. [accessed Dec. 2008]. URL: http://quickfacts.census.gov/qfd/states/55/55025.html. [Google Scholar]
- U.S. Census Bureau. [accessed Dec. 2008];State & County QuickFacts. 2007 URL: http://quickfacts.census.gov/qfd/meta/long_RHI125207.htm.
- Vorperian HK, Wang S, Chung MK, Schimek EM, Durtschi RB, Kent RD, Ziegert AJ, Gentry LR. Anatomic development of the oral and pharyngeal portions of the vocal tract: An imaging study. The Journal of the Acoustical Society of America. 2009;125(3):1666–1678. doi: 10.1121/1.3075589. [DOI] [PMC free article] [PubMed] [Google Scholar]
- Vorperian HK, Kent RD, Lindstrom MJ, Kalina CM, Gentry LR, Yandell BS. Development of vocal tract length during early childhood: A magnetic resonance imaging study. The Journal of The Acoustical Society of America. 2005;117:338–350. doi: 10.1121/1.1835958. [DOI] [PubMed] [Google Scholar]
- Vorperian HK, Kent RD, Gentry LR, Yandell BS. Magnetic resonance imaging procedures to study the concurrent anatomic development of the vocal tract structures: Preliminary results. International Journal of Pediatric Otorhinolaryngology. 1999;49:197–206. doi: 10.1016/s0165-5876(99)00208-6. [DOI] [PubMed] [Google Scholar]
- Walker SJ, Harris JE, Kowalski CJ. SNA and SNB angles in a population of Nubian schoolchildren. J Dent Res. 1975;54:764–766. doi: 10.1177/00220345750540041101. [DOI] [PubMed] [Google Scholar]
- Walton JH, Orlikoff RF. Speaker Race Identification From Acoustic Cues in the Vocal Signal. Journal of Speech and Hearing Research. 1994;37:738–745. doi: 10.1044/jshr.3704.738. [DOI] [PubMed] [Google Scholar]
- Waters MC. Immigration, Intermarriage, and the Challenges of Measuring Racial/Ethnic Identities. American Journal of Public Health. 2000;90:1735–1737. doi: 10.2105/ajph.90.11.1735. [DOI] [PMC free article] [PubMed] [Google Scholar]
- World Health Organization. WHO child growth standards: length/height-for-age, weight-forage, weight-for-length, weight-forheightand body mass index-for-age: methods and development. Geneva, Switzerland: WHO Press; 2006. [Google Scholar]
- Xue SA, Hao JG. Normative standards for vocal tract dimensions by race as measured by acoustic pharyngometry. Journal of Voice. 2006;20:391–400. doi: 10.1016/j.jvoice.2005.05.001. [DOI] [PubMed] [Google Scholar]
- Xue SA, Hao JGP, Mayo R. Volumetric measurements of vocal tracts for male speakers from different races. Clinical Linguistics & Phonetics. 2006;20:691–702. doi: 10.1080/02699200500297716. [DOI] [PubMed] [Google Scholar]
- Yokota M. Head and facial anthropometry of mixed-race US Army male soldiers for military design and sizing: A pilot study. Applied Ergonomics. 2005;36:379–383. doi: 10.1016/j.apergo.2005.01.009. [DOI] [PubMed] [Google Scholar]


