

Summary
Residual dipolar couplings (RDCs) complement standard NOE distance and J-coupling torsion angle data to improve the local and global structure of biomolecules in solution. One powerful application of RDCs is for domain orientation studies, which are especially valuable for structural studies of nucleic acids, where the local structure of a double helix is readily modeled and the orientations of the helical domains can then be determined from RDC data. However, RDCs obtained from only one alignment media generally result in degenerate solutions for the orientation of multiple domains. In protein systems, different alignment media are typically used to eliminate this orientational degeneracy, where the combination of RDCs from two (or more) independent alignment tensors can be used to overcome this degeneracy. It is demonstrated here for native E. coli tRNAVal that many of the commonly used liquid crystalline alignment media result in very similar alignment tensors, which does not eliminate the 4-fold degeneracy for orienting the two helical domains in tRNA. The intrinsic magnetic susceptibility anisotropy (MSA) of the nucleobases in tRNAVal was also used to obtain RDCs for magnetic alignment at 800 and 900 MHz. While these RDCs yield a different alignment tensor, the specific orientation of this tensor combined with the high rhombicity for the tensors in the liquid crystalline media only eliminates two of the four degenerate orientations for tRNAVal. Simulations are used to show that, in optimal cases, the combination of RDCs obtained from liquid crystalline medium and MSA-induced alignment can be used to obtain a unique orientation for two helical domains in tRNAVal.
Keywords: alignment tensor, liquid crystalline medium, magnetic susceptibility anisotropy, RDC, RNA, domain orientation
Introduction
NMR solution structures are traditionally determined by short-range 1H-1H NOE distance and torsion angle restraints. However, the low density of protons and the non-globular extended structures of many nucleic acids lead to less well-defined structures compared to the NMR solution structures of similar sized proteins. Advances in methodologies for generating tunable alignment of molecules have made it possible to routinely measure residual dipolar couplings (RDCs), which represent valuable structural data for improving the accuracy and precision of NMR solution structures of macromolecules (Tolman, et al. 1995; Tjandra and Bax 1997; Bax, et al. 2001). Easily measured one-bond 1H-15N and 1H-13C RDCs provide long-range orientational information that complements the local structural restraints provided by NOE and torsion angle data (Tolman, et al. 1995; Bax 2003; Lipsitz and Tjandra 2004). Inclusion of RDC data can significantly improve the precision of DNA and RNA structures (Vermeulen, et al. 2000; Padrta, et al. 2002; Staple and Butcher 2003; Lipsitz and Tjandra 2004; Davis, et al. 2005; Latham, et al. 2005; Richards, et al. 2006).
Many different external alignment media have been developed to generate the anisotropic molecular orientation required for the observation of RDCs. Currently, the most popular alignment media employed in studies of proteins and nucleic acids are dilute lyotropic liquid crystalline suspensions of bicelles, bacteriophages, or bilayers (Tjandra and Bax 1997; Clore, et al. 1998; Hansen, et al. 1998; Ruckert and Otting 2000) or anisotropically strained polyacrylamide gels (Sass, et al. 2000; Tycko, et al. 2000). These external alignment media produce partial alignment of molecules by steric exclusion and/or electrostatic repulsion mechanisms. The intrinsic magnetic susceptibility anisotropy (MSA) of a molecule can also be used to impart partial alignment at higher magnetic fields, therefore allowing measurement of RDCs in the absence of any external medium (Gayathri, et al. 1982; Bothner-By 1995). Since the magnitude of MSA-induced alignment scales with the square of the magnetic field, RDCs can be obtained from NMR measurements at two or more magnetic fields (Bothner-By 1995). Extended DNA or RNA helical regions have a significant magnetic anisotropy resulting in partial alignment in high magnetic field. Thus MSA-induced RDCs represent a complementary approach to external alignment media for obtaining long-range orientation restraints in nucleic acids.
Several methods have been developed for determining the low-resolution global structures of nucleic acids including: fluorescence resonance energy transfer and transient electric birefringence (Amiri and Hagerman 1994; Friederich and Hagerman 1997; Lilley 2004). RDCs can also be used to generate global structures of nucleic acids. This approach assumes A-form or B-form structures for the helical domains; rigid body rotations are then performed to find domain orientations that give good fits to the RDC data (Mollova, et al. 2000; Bondensgaard, et al. 2002; Lukavsky, et al. 2003; van Buuren, et al. 2004; Vermeulen, et al. 2005; Getz, et al. 2007). In this analysis since the local structure of helical domains is fixed, the global structures can be determined from a relatively small number of RDCs (Mollova, et al. 2000). One-bond 1H-15N imino RDCs (1DHN) are particularly useful for domain orientation studies of 15N-labeled RNAs because the imino protons are usually well resolved, readily assigned and generally yield one orientational constraint for each Watson-Crick base pair. A complication with this method is that the RDC is a multi-valued function of the angles of the vector between the two nuclei involved in the RDC and the alignment tensor of the molecule (Bax 2003). This leads to 4n−1 degenerate solutions for orienting n domains using only RDC data (Bruschweiler, et al. 1995; Lipsitz and Tjandra 2004). This orientational degeneracy can be lifted if RDCs are measured for independent alignment tensors. Multiple external alignment media can be employed to try to find an independent alignment tensor for the molecule (Al-Hashimi, et al. 2000). This method has been employed in domain orientation studies of protein systems (Al-Hashimi, et al. 2000; Lipsitz and Tjandra 2004). The combination of external alignment media and MSA-induced alignment has also been used to orient domains in a homodimeric DNA quadraplex containing a C2 axis of symmetry (Al-Hashimi, et al. 2001).
Here we demonstrate that the most commonly used liquid crysalline alignment media give very similar alignment tensors for native E. coli tRNAVal (Fig. 1). These media include: filamentous bacteriophages Pf1 (Hansen, et al. 1998) and fd (Clore, et al. 1998), C8E5/n-octanol bilayers (Ruckert and Otting 2000), phospholipid bicelles composed of DMPC/DHPC (Tjandra and Bax 1997) and anionic SDS-doped bicelles (Losonczi and Prestegard 1998; Ramirez and Bax 1998). We also show that magnetic alignment of native E. coli tRNAVal leads to a different alignment tensor than that observed for the external alignment media. These data can be used to eliminate two of the four degenerate structures generated in domain orientations studies of tRNAVal. However, the other two structures give nearly identical fits to the MSA-induced RDCs illustrating that although the alignment tensors are different, they are not independent. Simulations are performed to determine whether additional RDC data and/or different properties of the alignment tensor would make it possible to determine the correct orientation of the helical domains in tRNA.
Figure 1.

(A) Sequence and secondary structure and (B) tertiary structure model of native E. coli tRNAVal (Vermeulen, et al. 2005). (A) Long dashes represent canonical Watson-Crick base pairs and the short dashed lines represent non-canonical or tertiary interactions. Imino groups of the residues in black circles are involved in tertiary interactions, and their 1DHN values were omitted from SVD analysis. The two helical domains are labeled as the acceptor arm and the anticodon arm.
Materials and Methods
Preparation of 15N-labeled tRNAVal
15N-labeled native E. coli tRNAVal (Fig. 1) was overexpressed in E. coli (BL21(DE3)) from the pVALT7 plasmid in M9 minimal media containing 15NH4Cl as the sole nitrogen source and purified as previously described (Yue 1994; Vermeulen 2003). After purification, tRNAVal samples were extensively dialyzed into NMR buffer (10 mM sodium phosphate, pH 6.8, 80 mM NaCl, 5 mM MgCl2 and 0.1 mM EDTA in 10% D2O/90% H2O) by repeated centrifugation in Centricon YM-10 centrifugal filter devices (Millipore, Bedford, MA) and stored at −20 °C.
RDCs from External Alignment Media
The filamentous bacteriophage fd (Clore, et al. 1998) and a 20% longer fd phage, fd-9ah8, were purified using a similar procedure to that employed for Pf1(Hansen, et al. 2000). NMR samples were prepared by adding a concentrated stock solution of phage to 15N-labeled tRNAVal. For phospholipid bicelles, a DMPC/DHPC stock solution containing a total lipid concentration of 15% w/v (q=3.5) was prepared in 10 mM sodium phosphate, pH 7.0, 80 mM NaCl, 5 mM MgCl2 and 0.5 mM EDTA (Tjandra and Bax 1997). Negatively charged bicelles were prepared by adding SDS from a 10% w/v stock solution to the 15% w/v solution of DMPC/DHPC to give a 58:1 ratio of DMPC:SDS (q=3.5:1:0.06) (Losonczi and Prestegard 1998; Ramirez and Bax 1998). NMR samples were made by adding the DMPC/DHPC or DMPC/DHPC/SDS stock solutions to 15N-labeled tRNAVal to a final lipid concentration of 5% w/v.
NMR data on tRNAVal samples in the presence and absence of external alignment media were acquired on Varian Inova 500 and 600 spectrometers (Varian, Inc.) equipped with triple resonance z-axis pulsed field gradient probes. Some data collected at 600 MHz were acquired with a Varian triple resonance z-axis gradient cryogenic probe. The 1H-15N couplings for observable imino groups in tRNAVal were measured utilizing 2D 1H-coupled gradient-selected, sensitivity-enhanced 1H, 15N HSQC (Piotto, et al. 1992) or 2D doublet-selective sensitivity-enhanced 1H, 15N HSQC (Cordier, et al. 1999) experiments. The 1H-15N couplings for the unaligned tRNAVal (1JHN) were measured at 25 °C on a sample with no external media, whereas the couplings for the aligned states (1JHN + 1DHN) were collected at 25 °C for the fd phage and at 38 °C for the two DMPC/DHPC media. All NMR data were processed and analyzed with NMRPipe/NMRDraw software (Delaglio, et al. 1995). The 1H and 15N resonance assignments for the imino groups of tRNAVal were based on previously published values (Mollova, et al. 2000; Vermeulen, et al. 2005). The 1H-15N imino RDCs (1DHN) resulting from alignment by external alignment media were determined by subtracting the measured couplings in the unaligned state from those in the aligned state.
RDCs from Magnetic Alignment
The one-bond 1H-15N imino couplings, 1JHN(B0), were measured at 25 °C at four magnetic fields using Varian Inova 500, 600 and 800 and VNMRS 900 spectrometers. These couplings were averaged from two independent data sets (Ying, et al. 2007) where for the first data set the couplings were directly measured from peak splittings in a 1H-coupled 1H, 15N HSQC spectrum (Piotto, et al. 1992) and for the second data set the couplings were calculated by doubling the measured difference in peaks positions in two separately acquired spectra: a decoupled 1H, 15N HSQC spectrum and a TROSY-HSQC (Pervushin, et al. 1997) spectrum. The 1DHN(B0) values for magnetic alignment were determined by first calculating the zero-field one-bond coupling constant (1JHN(0)), which is the intercept of the best-fit line of 1JHN(B0) vs. B02 (Bothner-By 1995). A weighted least squares method was used to calculate 1JHN(0) with the inverse of the average pairwise root mean square difference (rmsd) of the two data sets collected at each magnetic field used as the weighting factor in the linear regression. 1DHN(800) and 1DHN(900) values were then determined by subtracting 1JHN(0) from 1JHN(800) or 1JHN(900), respectively. In some of the analysis the 1DHN(800) and 1DHN(900) values were combined to obtain a normalized average value, referred to as 1DHN(800, 900), which is equal to [1DHN(800) + (8002/9002)1DHN(900)]/2.
Determination of Alignment Tensors for tRNAVal
The singular value decomposition (SVD) approach was used to calculate the alignment tensor for native E. coli tRNAVal for the different alignment conditions (Losonczi, et al. 1999; Sass, et al. 1999). The previously determined rigid-body minimized, domain-oriented structure of native E. coli tRNAVal (Vermeulen, et al. 2005) and the experimental 1DHN values for a given alignment condition were used as input for the SVD program REDCAT (Valafar and Prestegard 2004). The observed 1DHN for imino groups from residues involved in tertiary interactions (s4U8, G15, G18, m7G46, T54 and Ψ55, see Fig. 1A) were excluded in the SVD analysis of the alignment tensor. The REDCAT program uses a Monte-Carlo approach, which performs multiple SVD fits and assumes Gaussian errors for the RDCs (Valafar and Prestegard 2004). The program only generates a solution when all the back-calculated RDCs are within the input error. Initial SVD calculations using the experimental errors in the RDCs (± 1.5 Hz) as the input error for REDCAT resulted in no solutions for the RDC data from Pf1, C8E5/1-octanol bilayer or DMPC/DHPC bicelles. This is because there is “structural noise” in the local structure of the native E. coli tRNAVal model (Zweckstetter and Bax 2002; Vermeulen, et al. 2005), which results from helical regions being constructed assuming canonical A-form helices (Vermeulen, et al. 2005). Thus for the media that have higher degrees of alignment, larger errors on the RDCs were used for the SVD calculations to account for the systematic error arising from structural noise (± 2 Hz, ± 5 Hz, ± 5 Hz and ± 6 Hz for the fd-8ah8, Pf1, C8E5/1-octanol bilayer and DMPC/DHPC bicelles, respectively). A total of 103 to 104 SVD calculations were performed with these input errors which led to 70 – 80% of the calculations producing solutions that fit the input RDC data (Zweckstetter and Bax 2002).
Results and Discussion
Different External Alignment Media Yield Similar Alignment Tensors
The imino 1DHN values were measured for native E. coli tRNAVal (Fig. 1) in the following external liquid crystalline alignment media: 20 mg/mL wt-fd phage, 20 mg/mL fd-9ah8 phage, 5% DMPC/DHPC bicelles and SDS-doped 5% DMPC/DHPC bicelles (Table S1). The 1DHN values for this tRNA were previously measured in two other alignment media: 10 mg/mL Pf1 phage (Mollova, et al. 2000) and 3.5% C8E5/1-octanol bilayers (Vermeulen, et al. 2005). Fig. 2A shows a scatter plot of 1DHN values for the two different lengths of fd phage versus 1DHN values from Pf1. Since the Pf1 and fd phage have similar negatively charged filamentous structures, it is not surprising that there is a very high degree of correlation between RDCs for tRNAVal in these phage media. Fig. 2B shows a scatter plot of the 1DHN values for the bicelle and bilayer media versus the 1DHN values for Pf1, and these plots also show a high correlation between the RDC data sets. Except for the SDS-doped DMPC/DHPC bicelles, the scatter plots for all the media have Pearson’s correlation coefficients (RP) ranging from 0.90 to 0.98 indicating strong linear correlations (Fig. 2 and Table S1). Strong linear correlations in these scatter plots indicate that the alignment tensors of tRNAVal in these other media are very similar to the tensor in Pf1 phage. The higher degree of alignment of tRNAVal in the DMPC/DHPC bicelles leads to additional 1H-1H RDCs, which causes the apparent line-broadening for many of the 1H-15N imino resonances in the NMR spectrum of tRNAVal (Fig. 3A). Thus only 14 1DHN values could be measured in the DMPC/DHPC bicelles compared to the 26 – 27 1DHN values in the other alignment media. The addition of negatively charged SDS to the bicelles decreased the overall magnitude of alignment and thus eliminated the extensive line-broadening (Fig. 3B), yielding 27 measurable 1DHN values. The scatter plot of 1DHN for Pf1 versus SDS-doped bicelles has a somewhat lower correlation coefficient (RP = 0.83) than the other plots, but these data still have a strong linear correlation (Fig. 2B). The lower degree of correlation between 1DHN values for the SDS-doped bicelles and Pf1 likely arises from the much smaller magnitude of alignment but similar magnitude of error (±1.5 Hz) for the RDCs in the SDS-doped bicelles compared to the other alignment media (1DHN values from − 4.9 to 3.6 Hz for the SDS-doped bicelles versus ranges of −31.0 to 30.1 Hz, −60.7 to 42.7 Hz, −30 to 30.1 Hz, −7.9 to 5.8 Hz, and − 10.7 to 9.2 Hz for the Pf1, DMPC/DHPC bicelles, C8E5/1-octanol bilayers, wt-fd and fd-9ah8, respectively, Table S1). This larger relative error (58% and 10% for SDS-doped bicelles and Pf1, respectively) leads to the lower correlation coefficient (RP = 0.83) for the SDS-doped bicelles than the other alignment media (Table S1). These results illustrate that although it is generally advantageous to have a higher degree of alignment of the macromolecule, too much alignment leads to poor RDCs data due to severe line broadening. Thus, there is generally a compromise in the degree of alignment where RDCs are large enough to be precisely measured and not large enough to induce large enough 1H-1H RDCs to cause apparent line-broadening and lower signal-to-noise.
Figure 2.

Scatter plots of experimental one-bond 1H-15N imino 1DHN values for native E. coli tRNAVal in 10 mg/mL Pf1 bacteriophage plotted against 1DHN values in the presence of (A) fd or fd-9ah8 bacteriophage and (B) bicelle or bilayer alignment media. (A) Squares are the 1DHN values in wild-type fd and circles are the 1DHN values in the longer fd mutant, fd-9ah8. (B) Filled squares are the 1DHN values in DMPC/DHPC bicelles, filled circles are the 1DHN values in SDS-doped DMPC/DHPC bicelles and open squares are the 1DHN values in C8E5/1-octanol bilayers. The lower right inset of each graph shows error bars representing the ±1.5 Hz error in the 1DHN values, and the Pearson’s correlation coefficient (RP) values are given in the upper left of each graph. The lines are the best linear fit for each plot.
Figure 3.

The uracil imino regions from the 2D 1H, 15N doublet selected, sensitivity enhanced HQSC spectra of uniformly 15N-labeled native E. coli tRNAVal in (A) DMPC/DHPC bicelles and (B) SDS-doped DMPC/DHPC bicelles. Spectra were collected at 600 MHz and 38 °C. The lower right inset of each spectrum shows the downfield shifted s4U8 imino resonance. Imino assignments for each residue are indicated in B.
To more directly compare the alignment properties of the different media, the alignment tensors were determined by SVD (Losonczi, et al. 1999; Sass, et al. 1999) for native E. coli tRNAVal in each of the external alignment media. This Monte Carlo approach generates a set of alignment tensors that fit the input structure and RDC data (within error). This analysis employed the model for native E. coli tRNAVal previously determined by domain orientation studies (Vermeulen, et al. 2005). As previously discussed this model contains structural noise, which arises from assuming A-form conformations for the helical domains in tRNAVal (Vermeulen, et al. 2005). The presence of structural noise means that the input errors had to be increased beyond the experimental errors to obtain an adequate number of solutions in the SVD calculations for the external media with larger RDC values (see Methods). Table 1 shows the results of the SVD calculations, illustrating that although the magnitude of alignment (Da) varies greatly in the different external media, the rhombicity (R) values are generally similar. The size of Da depends upon the degree of alignment in each of the media and thus does not provide information on the independence of the alignment tensors in different media. Table 1 also shows that the different external media have comparable relative errors for the magnitudes of their alignment tensors (5 to 10% for Da and 10 to 27% for R). The similar relative errors for Da and R in the various media indicates that the errors introduced to account for structural noise are equal to or greater than the experimental errors in the RDC measurements in these SVD calculations (Zweckstetter and Bax 2002). Thus the SVD calculations likely over estimates the true errors in determining the magnitudes and angles of the alignment tensor.
Table 1.
Molecular alignment of native E. coli tRNAVal by external alignment media.a
| Media | Dab (Hz) | Rb | rmsdc (Hz) | Qd | Normalized Scalar Producte |
|---|---|---|---|---|---|
| Pf1 (10 mg/mL) | 20.4 ± 1.8 | 0.62 ± 0.17 | 2.91 | 0.19 | N/A |
| C8E5/1-octanol (3.5% v/v) | 25.6 ± 1.0 | 0.51 ± 0.04 | 3.17 | 0.17 | 0.95 |
| fd (20 mg/mL) | 4.1 ± 0.3 | 0.58 ± 0.07 | 1.28 | 0.38 | 0.93 |
| fd-9ah8 (20 mg/mL) | 7.0 ± 0.7 | 0.52 ± 0.10 | 1.89 | 0.34 | 0.93 |
| DMPC/DHPCf (5% q=3.5) | 57.1 ± 2.5 | 0.35 ± 0.07 | 5.29 | 0.18 | 0.87 |
| DMPC/DHPC/SDS (5% q=3.5:1;0.06) | 3.2 ± 0.3 | 0.49 ± 0.13 | 1.64 | 0.62 | 0.98 |
For each of the external alignment media, 1DHN and the rigid body minimized structure of native E. coli tRNAVal (Vermeulen, et al. 2005) were used to determine the molecular alignment tensor by SVD as in the program REDCAT (Valafar and Prestegard 2004).
Standard deviations in Da and R were calculated from the variation of the principal components in the SVD calculations for each of the various alignment tensors.
Average rmsd between experimental and calculated 1DHN values.
Q represents the quality factor and is the average rmsd normalized by the average magnitude of experimental 1DHN (Bax 2003).
Normalized scalar product comparing each of the external alignment media to Pf1 (Sass, et al. 1999).
The high degree of alignment in these bicelles led to observation of fewer RDCs than the other media biasing this data set and resulting in less accurate values of the alignment tensor properties (see text).
As mentioned above, there are only half as many observable RDCs for tRNAVal in the DMPC/DHPC bicelles due to the apparent line-broadening arising from the high degree of alignment (Da = ~57 Hz). It is also important to note that a many of the RDCs with the largest magnitudes in the other media were not observed in the DMPC/DHPC bicelles (Figure 1B and Table S1). Thus the 14 observable imino RDCs in the bicelle medium represent a limited and highly biased data set compared to the RDCs measured in the other alignment media. The inability to measure the largest RDCs in the DMPC/DHPC bicelles leads to systematic errors in calculating the alignment tensor for tRNAVal in this medium. However, the remaining RDCs are still highly correlated with the Pf1 RDCs (RP = 0.98; Figure 1B), indicating that the RDCs for the bicelles would not provide an independent alignment tensor from that observed for Pf1. Thus, the smaller R for tRNAVal in the DMPC/DHPC bicelles cannot be interpreted as a different alignment tensor for this medium, but reflects inaccurate estimates for the principal components of the alignment tensor due to limited and biased sampling of the RDC data in this medium (see below).
Table 1 also shows that all of these alignment media yielded rather similar qualities of fit, Q, to the structure of tRNAVal (average rmsd = 1.28 – 5.29 Hz and Q = 0.17 – 0.62). Q is the average rmsd normalized by the average magnitude of the measured RDCs and allows comparison of RDC data sets even with very different Da values (Bax 2003). Part of the Q values (and average rmsd) are due to structural noise resulting from deviations in the local structure of the tRNA away from the assumed A-form conformation (Zweckstetter and Bax 2002; Vermeulen, et al. 2005). Since Q directly compares the experimental RDC values to back-calculated values, it is also sensitive to the experimental error, and the RDCs generated from alignment media with the largest relative errors have the largest Q values (Table 1). To further assess the independence of the alignment tensors for tRNA in the different alignment media, the normalized scalar product was calculated for each tensor relative to the tensor for Pf1 phage. This scalar product is the cosine of the angle between two tensors and provides an estimate of the co-linearity of the two alignment tensors (Sass, et al. 1999), where a scalar product of 1 means exact co-linearity for the two tensors. With the exception of the DMPC/DHPC medium, which has an inaccurate alignment tensor (see above), the normalized scalar product ranges from 0.93 – 0.98 between the different alignment media and Pf1, indicating a high degree of co-linearity between the alignment tensors (Table 1).
The Sauson-Flaumsteed projection maps obtained from the SVD analysis (Fig. 4) can also be used to compare the orientations of principal components of the alignment tensor (where |Szz| ≥ |Syy| ≥ |Sxx|) for tRNAVal in the different alignment media. These maps were referenced such that the Szz component of tRNAVal for the Pf1 phage is oriented at the top (or the bottom) of the globe. The alignment tensor of the tRNAVal in Pf1 has a high rhombicity (Table 1), which means that the Szz and Syy components of the alignment tensors have similar magnitudes. This is manifested in the Sauson-Flaumsteed projection maps where some members of the set of alignment tensors consistent with the input data have exchanged orientations of the Szz and Syy components (Fig, 4A). This property is a natural consequence of the high rhombicity of tRNAVal alignment in the various alignment media. Excluding the biased DMPC/DHPC data, the Sauson-Flaumsteed projection maps for the other external alignment media show similar orientations for the components of the alignment tensors. Given that the various alignment media have different relative errors in their RDC data, it is unexpected that the maps show a similar variation in the orientation of their alignment tensor components. However, this similar variation is a direct consequence of the larger input error required to account for the structural noise in the SVD calculations for some of the alignment media (see Methods). As noted above, the DMPC/DHPC data yields an inaccurate alignment tensor for tRNAVal. This is further illustrated in Figure 4B where there is a ~20° difference in the orientation for Szz compared to the other media. To demonstrate that this difference in orientation results from the biased set of RDCs for the DMPC/DHPC medium, the RDCs that were not observed in the DMPC/DHPC data set were removed from the Pf1 and C8E5/1-octanol data sets. The SVD calculations on these data sets also have Szz shifted by ~15–20° and smaller R (data not shown), demonstrating that the RDC data for the DMPC/DHPC medium leads to an inaccurate alignment tensor.
Figure 4.

Sauson-Flaumsteed projection maps illustrating the orientations of the principal components of the molecular alignment tensor for native E. coli tRNAVal derived from alignment by (A) various filamentous bacteriophage and (B) bilayer or bicelle alignment media. The positions of the principal components Sxx, Syy and Szz of the alignment are indicated on each map. The legend in the lower right of each map shows the symbols for the principal components for the various alignment media. Due to the high rhombicity for several of the alignment tensors, the orientations of Szz and Syy are exchanged. Sauson-Flaumsteed projection maps were generated from the SVD output using the program REDCAT (Valafar and Prestegard 2004). 50 solutions are plotted for each alignment tensor.
It is not surprising that these different alignment media give similar alignment tensors for tRNAVal. Previous studies of the mechanisms of alignment of macromolecules in liquid crystalline media have shown that molecular alignment tensors in liquid crystalline media can be accurately predicted using a steric obstruction model (Zweckstetter and Bax 2000) or a mixed steric obstruction and electrostatic repulsion model (Zweckstetter, et al. 2004). Wu et al. 2006 have also recently developed an analytical approach employing the Debye-Huckel approximation for electrostatic repulsion to predict the alignment tensors of nucleic acids in Pf1. The combined results of these studies predict that alignment of nucleic acids under conditions of electrostatic repulsion is functionally the same as alignment under conditions of steric exclusion (Zweckstetter and Bax 2000; Zweckstetter, et al. 2004; Wu, et al. 2006). These theoretical predictions are experimentally observed in the results presented here for tRNAVal (Figs. 2 and 4 and Table 1), where the alignment of tRNAVal is essentially the same in negatively charged (Pf1 phage, fd phage and SDS-doped bicelles) and in neutral (bicelles and bilayers) liquid crystalline media. Thus a different alignment mechanism, besides steric or electrostatic repulsion, needs to be employed to obtain an independent alignment tensor in tRNAVal.
Magnetic Alignment of E. coli Native tRNAVal
In an attempt to generate a different alignment tensor, the one-bond 1H-15N imino couplings were measured at four magnetic fields and used to determine the MSA-induced 1DHN(800) and 1DHN(900) values for tRNAVal (Table S2). As seen in the scatter plot in Fig. 5 these 1DHN values do not correlate as well with the 1DHN for Pf1 as the 1DHN values for the other alignment media (RP = 0.77 and 0.79 for 1DHN data at 800 and 900 MHz, respectively). A scatter plot of the 1DHN values at 800 and 900 MHz yielded a higher RP of 0.95 (data not shown) indicating the lower RP values in the plots with Pf1 are not simply a result of larger relative errors in measurement of the MSA-induced RDCs compared to the errors in the external alignment media (which have relative errors of 72%, 74% and 10% for 1DHN(800), 1DHN(900) and Pf1, respectively). The 1DHN values at 800 and 900 MHz were normalized, averaged and used as input for SVD analysis with the same tRNAVal model that was employed for the external media above (Vermeulen, et al. 2005). These MSA-induced RDCs fit well to the structure of tRNAVal (Q = 0.45 and average rmsd = 0.72 Hz). Magnetic alignment produces only a small degree of ordering for tRNAVal (Da = −2.0 Hz), along with a somewhat smaller rhombicity than alignment with Pf1 (R = 0.42 versus 0.62). Even though tRNAVal has 76 nucleotides, it has only a small degree of alignment at 900 MHz due to partial cancellation of the individual nucleobase magnetic anisotropies (Ying, et al. 2007) arising from the ~90° orientation of the anticodon arm and acceptor arm in tRNAVal (Mollova, et al. 2000). The normalized scalar product of the two alignment tensors of tRNAVal generated by magnetic alignment and Pf1 alignment is 0.94, indicating a high degree of co-linearity. This suggests that MSA-induced alignment and external alignment media do not generate independent alignment tensors. Fig. 6 compares the Sauson-Flaumsteed maps depicting the orientations of the principal components of the alignment tensor for the Pf1 phage data and the 1DHN(800,900) data for MSA-induced alignment of tRNAVal. The relative magnitudes and orientations of the principal axes for the Pf1 and MSA-induced alignment are also shown in Fig. 7, referenced to the structural model for tRNAVal. Again, the large rhombicity of the Pf1 alignment tensor is highlighted pictorially in Fig. 7 (red axis system), which shows that Szz and Syy for Pf1 alignment have similar magnitudes. These figures also illustrate that the Szz axis for the MSA-induced alignment tensor is rotated by ~95° relative to the Szz axis for Pf1 and is nearly co-linear with Syy for Pf1. Finally, Sxx for both alignment tensors are in a similar orientation. The magnetic susceptibility of the nucleobases in an A-form RNA helix leads to the helical axis being oriented roughly perpendicular to the applied magnetic field, which is in contrast to the external media where the helical axis is oriented parallel to the magnetic field. Typically, the Szz of the MSA-induced alignment tensor is oriented along the helical axis; however, the L-shape of tRNA not only reduces MSA-induced alignment but also leads to Szz being oriented perpendicular to the plane of the L (Fig. 7, blue axis system).
Figure 5.
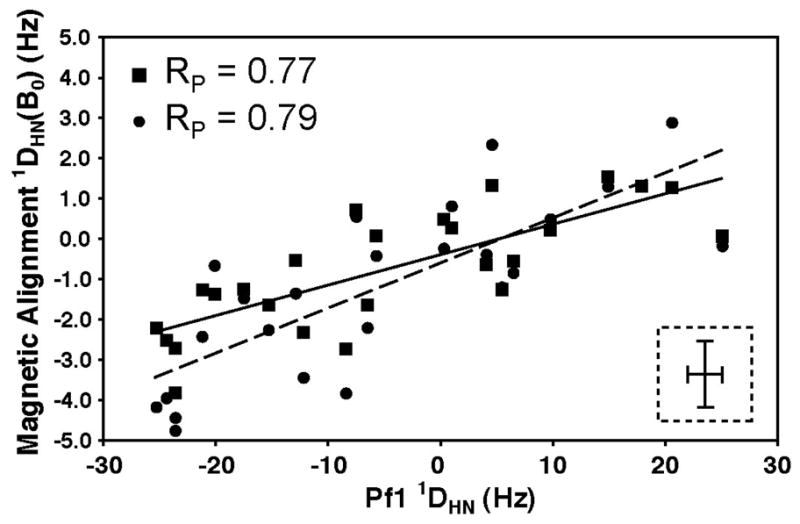
Scatter plot of the experimental 1DHN values of native E. coli tRNAVal in 10 mg/mL Pf1 plotted against 1DHN values for magnetic alignment at 800 MHz (filled squares) and 900 MHz (filled circles). The solid and dashed lines correspond to the best-fit line of the Pf1 data to the 800 MHz and 900 MHz data, respectively. The lower right inset shows an error bar representing the ±1.5 and ±0.8 Hz errors in the 1DHN values obtained from Pf1 and MSA-induced alignment, respectively, and the RP values are given in the upper left of each graph. The lines are the best linear fit for each plot.
Figure 6.

Sauson-Flaumsteed projection maps illustrating the orientations of the principal components of the molecular alignment tensor derived from alignment by (A) 10 mg/mL Pf1 and (B) MSA-induced alignment using the normalized average RDC values measured at 800 and 900 MHz, 1DHN(800, 900). Areas of green, blue and red correspond to the orientations of the principal components of the order tensor Sxx, Syy, and Szz, respectively.
Figure 7.

Relative orientations of the principal components of the molecular alignment tensors for native E. coli tRNAVal resulting from Pf1 (red) and MSA-induced alignment (blue). The magnitude and orientation of Sxx, Syy and Szz were determined by SVD analysis of the 1DHN values using the program REDCAT. The lengths of Sxx, Syy, and Szz represent their magnitudes and are relative to the Szz for Pf1 alignment. For visualization purposes, the lengths of Sxx, Syy, and Szz for the MSA-induced alignment tensor are amplified 5-fold.
The ~95° shift of Szz for the MSA-induced indicates a different alignment tensor for tRNAVal compared to that obtained in Pf1. However, as discussed above, the relatively high rhombicity of the alignment tensor in Pf1 phage also leads a set of alignment tensors from the SVD analysis with Szz being rotated by 90°, which is in a similar orientation as the alignment tensor for the MSA-induced alignment (Figs. 6 and 7). Thus the experimental results show that MSA-induced alignment of native tRNAVal generates a different, but not an independent, alignment tensor from the ones generated by the various external alignment media.
Eliminating Degeneracy in Domain Orientations of tRNA Using RDC Data
One reason for developing different methods for partially aligning macromolecules is that RDCs measured from two (or more) independent alignment tensors greatly simplify domain orientation studies (Al-Hashimi, et al. 2000; Al-Hashimi, et al. 2001; Lipsitz and Tjandra 2004). Thus SVD calculations were performed to test if combining RDC data from magnetic alignment and external alignment could eliminate the orientational degeneracy observed in the studies of tRNAVal (Mollova, et al. 2000; Vermeulen, et al.). For these calculations the model tRNAVal structure was rotated into the principal axis system of the Pf1 alignment tensor and separated into two helical domains, the anticodon arm and the acceptor arm (Fig. 1). The anticodon arm was independently rotated by 180° about the x-, y-, or z-axis of the principal axis system to generate four structures. These four structures represent the 4 degenerate solutions for orienting two domains using RDC data from one external alignment medium (Bruschweiler, et al. 1995). The 1DHN(800, 900) values were then used as SVD input for each of the four structures. As seen in Table 2, two of the four structures have higher Q factors, indicating that these orientations yield poorer fits to the experimental magnetic alignment RDCs. However, all four structures have Q factors (Q = 0.44 – 0.62) within the range seen for fitting the experimental RDCs for the various external alignment media (Tables 1 and 2). Thus the MSA-induced RDC data might be able to rule out two of the structures, but the other two fit equally well. The RNA covalent structure and steric overlap also eliminates two of the possible orientations for tRNAVal (structures 2 and 3)(Mollova, et al. 2000), but these are the same structures eliminated based on the higher Q factors. Thus to determine if the high relative error of the MSA-induced RDCs is the cause for the similar Q factors for structures 1 and 4, SVD calculations were performed with simulated (error free) RDCs to determine if it is possible to eliminate the orientation degeneracy by using perfectly accurate and precise MSA-induced 1DHN(800) data. These SVD calculations employed 21 1DHN(800) values that were predicted for the imino RDCs used in the SVD analysis with the experimental MSA data discussed above. The 1DHN(800) values were generated from the tRNAVal model using a predicted alignment tensor for MSA-induced alignment (Bryce, et al. 2004), which is calculated by summing the magnetic anisotropy tensors of all the individual bases. These predicted 1DHN(800) values were used as SVD input with each of the four orientationally degenerate tRNAVal structures. Table 2 shows that using these perfectly accurate and precise MSA-induced RDC data, it is possible to eliminate the 4-fold degeneracy. The Q factors for structures 2 and 3 are much larger than the Q factor for structures 1 and 4 and would likely rule out these structures for real experimental data. However, even though the Q for structure 4 is higher than for the correct structure 1, it is still quite small (Q = 0.18). Thus structural noise in the domain orientation analysis (Zweckstetter and Bax 2002; Vermeulen, et al. 2005) and measurement errors in experimental RDCs would generally make it impossible to distinguish between structures 1 and 4 for real experimental data.
Table 2.
SVD analysis of MSA-induced RDCs.
| Domain orientation degenerate structurea | ||||
|---|---|---|---|---|
| 1 | 2 | 3 | 4 | |
| Axis of Rotation | N/A | x | y | z |
| Experimental 1DHN(800, 900) | ||||
| Q | 0.44 | 0.62 | 0.65 | 0.44 |
| Predicted RDCs from observed imino resonancesb | ||||
| Q | 0.01 | 0.60 | 0.61 | 0.18 |
| Predicted RDCs from rotated alignment tensorc | ||||
| Q | 0.00 | 0.59 | 0.36 | 0.52 |
tRNAVal structures generated by separating the RNA structure into two domains and rotating the anticodon arm domain (residues 10 – 13 and 22 – 43, Fig. 1) around the indicated axis of the Pf1 alignment tensor. Structure 1 is the original structure (Vermeulen, et al. 2005) whereas structures 2, 3 and 4 involve rotations around the x, y and z axes, respectively.
The MSA-induced alignment tensor for structure 1 was modeled using the method of Bryce et al. (2004). A set of 21 RDC values were predicted based on this alignment tensor and structure 1. These RDC values were then used in SVD analysis for the four orientationally degenerate structures of tRNAVal.
The modeled MSA-induced alignment tensor (in b) was modified where Szz was rotated by ~45°. A new set of 21 RDC values were predicted based on this alignment tensor and structure 1. These RDC values were then also used in SVD analysis for the four orientationally degenerate structures of tRNAVal.
To test whether a more complete set of RDC data would eliminate the orientational degeneracy in the domain orientation studies of tRNAVal, additional 1DHN(800) values were predicted for imino groups in the anticodon arm and included in the SVD analysis of the MSA-induced alignment. There are fewer experimental imino RDC data for the anticodon arm compared to the acceptor arm (8 versus 13), thus these calculations test whether including more experimental RDCs for the anticodon arm can eliminate the orientational degeneracy. The predicted 1DHN(800) values for imino proton groups for residues U33, U34, G43, G44 and G45 in the anticodon arm (Fig. 1A) were included in these SVD calculations. These imino proton resonances were not experimentally observed for tRNAVal, presumably due to rapid proton exchange with water. This additional data leads to very small changes in the Q factors (data not shown). Thus including a more complete set of the imino RDC data does not eliminate the 2-fold degeneracy for the domain orientation studies of tRNAVal.
The alignment tensor for MSA-induced alignment of tRNAVal has Szz rotated by ~95 ° relative to the Szz observed for alignment with Pf1 (Figs. 6 and 7), and as noted above this leads to little independence of the MSA-induced RDC data due to the high rhombicity of the Pf1 tensor. To test if RDC data for a different orientation of the MSA-induced alignment tensor could eliminate the orientational degeneracy in the domain orientation studies, a set of 21 RDCs was predicted using the same magnitudes but different orientations of the principal components of the MSA-induced alignment tensor. In these simulations the Szz axis of the MSA-induced alignment was rotated by ~45° relative to the Pf1 data. As seen in Table 2, it is possible to eliminate two of the 4 possible structures (2 and 4) based on the higher Q factors. Whether structure 3 can be eliminated based on Q-factor alone will depend upon the level of structural noise and experimental error; however, this solution is eliminated due to steric overlap (Mollova, et al. 2000). Al-Hashimi et al. 2001 employed the combination of Pf1 and MSA-induced alignment to orient two domains in a homodimeric DNA quadraplex with C2 symmetry. Similar to what was observed here, the MSA-induced alignment was able to rule out two of the four degenerate solutions. However, in that system the two remaining solutions are related by rotation about the C2 axis of symmetry inherent in the DNA homodimer (Al-Hashimi, et al. 2001). Thus a unique domain orientation was obtained for this system because the molecule contains a C2 axis of symmetry. These results demonstrate that, in optimal cases, it is possible to combine RDC data from external alignment media and magnetic alignment to uniquely orient two domains in nucleic acids. Another potential approach for generating different alignment tensors for tRNA is the use of paramagnetic tags, where an attached paramagnetic metal induces molecular alignment (Rodriguez-Castaneda, et al. 2006). In the absence of an independent alignment tensor, additional data, such as steric overlap or NOE constraints (Mollova, et al. 2000; Bondensgaard, et al. 2002), need to be used to eliminate the orientational degeneracy obtained in domain orientation studies of RNAs.
Supplementary Material
Acknowledgments
We thank Gabe Gittings for purification of the fd and fd mutant bacteriophage, Dr. Jinfa Ying for advice in acquiring the NMR spectra for magnetic alignment, Dr. Alexander Grishaev for the FORTRAN program for calculating the MSA-induced alignment tensor and Dr. Ad Bax for critical advice in collection of the MSA-induced RDCs and for valuable discussions. This work is supported in part by NIH grant AI33098, and MPL was supported in part by a NIH training grant T32 GM65103. The NMR instrumentation was purchased with partial support from NIH grants RR11969, RR16649 and GM068928, NSF grants 9602941 and 0230966, and the W. M. Keck Foundation.
Footnotes
Supplementary material to this paper is available in electronic format http://dx.doi.org/xxxxxxxxxx
References
- Al-Hashimi HM, Majumdar A, Gorin A, Kettani A, Skripkin E, Patel DJ. Field-and phage-induced dipolar couplings in a homodimeric DNA quadruplex, relative orientation of G·(C-A) triad and G-tetrad motifs and direct determination of C2 symmetry axis orientation. J Am Chem Soc. 2001;123:633–640. doi: 10.1021/ja003379y. [DOI] [PubMed] [Google Scholar]
- Al-Hashimi HM, Valafar H, Terrell M, Zartler ER, Eidsness MK, Prestegard JH. Variation of molecular alignment as a means of resolving orientational ambiguities in protein structures from dipolar couplings. J Magn Reson. 2000;143:402–406. doi: 10.1006/jmre.2000.2049. [DOI] [PubMed] [Google Scholar]
- Amiri KMA, Hagerman PJ. Global Conformation of a Self-Cleaving Hammerhead RNA. Biochemistry. 1994;33:13172–13177. doi: 10.1021/bi00249a003. [DOI] [PubMed] [Google Scholar]
- Bax A. Weak alignment offers new NMR opportunities to study protein structure and dynamics. Prot Sci. 2003;12:1–16. doi: 10.1110/ps.0233303. [DOI] [PMC free article] [PubMed] [Google Scholar]
- Bax A, Kontaxis G, Tjandra N. Dipolar couplings in macromolecular structure determination. Methods Enzym. 2001;339:127–174. doi: 10.1016/s0076-6879(01)39313-8. [DOI] [PubMed] [Google Scholar]
- Bondensgaard K, Mollova ET, Pardi A. The global conformation of the hammerhead ribozyme determined using residual dipolar couplings. Biochemistry. 2002;41:11532–11542. doi: 10.1021/bi012167q. [DOI] [PubMed] [Google Scholar]
- Bothner-By AA. In: Encyclopedia of Nuclear Magnetic Resonance. Grant DM, Harris RK, editors. Wiley; Chichester: 1995. pp. 2932–2938. [Google Scholar]
- Bruschweiler R, Liao XB, Wright PE. Long-Range Motional Restrictions in a Multidomain Zinc-Finger Protein From Anisotropic Tumbling. Science. 1995;268:886–889. doi: 10.1126/science.7754375. [DOI] [PubMed] [Google Scholar]
- Bryce DL, Boisbouvier J, Bax A. Experimental and theoretical determination of nucleic acid magnetic susceptibility: Importance for the study of dynamics by field-induced residual dipolar couplings. J Am Chem Soc. 2004;126:10820–10821. doi: 10.1021/ja047179o. [DOI] [PubMed] [Google Scholar]
- Clore GM, Starich MR, Gronenborn AM. Measurement of residual dipolar couplings of macromolecules in the nematic phase of a colloidal suspension of rod-shaped viruses. J Am Chem Soc. 1998;120:10571–10572. [Google Scholar]
- Cordier F, Dingley AJ, Grzesiek S. A doublet-separated sensitivity-enhanced HSQC for the determination of scalar and dipolar one-bond J-couplings. J Biomol NMR. 1999;13:175–180. doi: 10.1023/a:1008301415843. [DOI] [PubMed] [Google Scholar]
- Davis JH, Tonelli M, Scott LG, Jaeger L, Williamson JR, Butcher SE. RNA helical packing in solution: NMR structure of a 30 kDa GAAA tetraloop-receptor complex. J Mol Biol. 2005;351:371–82. doi: 10.1016/j.jmb.2005.05.069. [DOI] [PubMed] [Google Scholar]
- Delaglio F, Grzesiek S, Vuister GW, Zhu G, Pfeifer J, Bax A. NMRPipe: a multidimensional spectral processing system based on UNIX pipes. J Biomol NMR. 1995;6:277–93. doi: 10.1007/BF00197809. [DOI] [PubMed] [Google Scholar]
- Friederich MW, Hagerman PJ. The angle between the anticodon and aminoacyl acceptor stems of yeast tRNA(Phe) is strongly modulated by magnesium ions. Biochemistry. 1997;36:6090–9. doi: 10.1021/bi970066f. [DOI] [PubMed] [Google Scholar]
- Gayathri C, Bothner-By AA, Vanzijl PCM, Maclean C. Dipolar Magnetic-Field Effects in Nmr-Spectra of Liquids. Chem Phys Lett. 1982;87:192–196. [Google Scholar]
- Getz M, Sun X, Casiano-Negroni A, Zhang Q, Al-Hashimi HM. Review NMR studies of RNA dynamics and structural plasticity using NMR residual dipolar couplings. Biopolymers. 2007;86:384–402. doi: 10.1002/bip.20765. [DOI] [PubMed] [Google Scholar]
- Hansen MR, Hanson P, Pardi A. Filamentous bacteriophage as a versatile method for aligning RNA, DNA and proteins for measurement of NMR dipolar coupling interactions. Methods Enzym. 2000;317:220–240. doi: 10.1016/s0076-6879(00)17017-x. [DOI] [PubMed] [Google Scholar]
- Hansen MR, Mueller L, Pardi A. Tunable alignment of macromolecules by filamentous phage yields dipolar coupling interactions. Nature Struct Biol. 1998;5:1065–1074. doi: 10.1038/4176. [DOI] [PubMed] [Google Scholar]
- Latham MP, Brown DJ, McCallum SA, Pardi A. NMR methods for studying the structure and dynamics of RNA. ChemBioChem. 2005;6:1492–1505. doi: 10.1002/cbic.200500123. [DOI] [PubMed] [Google Scholar]
- Lilley DM. Analysis of global conformational transitions in ribozymes. Meth Mol Biol. 2004;252:77–108. doi: 10.1385/1-59259-746-7:077. [DOI] [PubMed] [Google Scholar]
- Lipsitz RS, Tjandra N. Residual dipolar couplings in NMR structure analysis. Ann Rev Biophys Biomol Struct. 2004;33:387–413. doi: 10.1146/annurev.biophys.33.110502.140306. [DOI] [PubMed] [Google Scholar]
- Losonczi JA, Andrec M, Fischer MW, Prestegard JH. Order matrix analysis of residual dipolar couplings using singular value decomposition. J Magn Reson. 1999;138:334–42. doi: 10.1006/jmre.1999.1754. [DOI] [PubMed] [Google Scholar]
- Losonczi JA, Prestegard JH. Improved dilute bicelle solutions for high-resolution NMR of biological macromolecules. J Biomol NMR. 1998;12:447–51. doi: 10.1023/a:1008302110884. [DOI] [PubMed] [Google Scholar]
- Lukavsky PJ, Kim I, Otto GA, Puglisi JD. Structure of HCV IRES domain II determined by NMR. Nature Struct Biol. 2003;10:1033–8. doi: 10.1038/nsb1004. [DOI] [PubMed] [Google Scholar]
- Mollova ET, Hansen MR, Pardi A. Global Structure of RNA Determined with Residual Dipolar Couplings. J Am Chem Soc. 2000;122:11561–11562. [Google Scholar]
- Padrta P, Stefl R, Kralik L, Zidek L, Sklenar V. Refinement of d(GCGAAGC) hairpin structure using one- and two-bond residual dipolar couplings. J Biomol NMR. 2002;24:1–14. doi: 10.1023/a:1020632900961. [DOI] [PubMed] [Google Scholar]
- Pervushin K, Riek R, Wider G, Wuthrich K. Attenuated T2 relaxation by mutual cancellation of dipole-dipole coupling and chemical shift anisotropy indicates an avenue to NMR structures of very large biological macromolecules in solution. Proc Natl Acad Sci U S A. 1997;94:12366–71. doi: 10.1073/pnas.94.23.12366. [DOI] [PMC free article] [PubMed] [Google Scholar]
- Piotto M, Saudek V, Sklenár V. Gradient-Tailored Excitation For Single-Quantum Nmr-Spectroscopy Of Aqueous-Solutions. J Biomol NMR. 1992;2:661–665. doi: 10.1007/BF02192855. [DOI] [PubMed] [Google Scholar]
- Ramirez BE, Bax A. Modulation of the alignment tensor of macromolecules dissolved in a dilute liquid crystalline medium. J Am Chem Soc. 1998;120:9106–9107. [Google Scholar]
- Richards RJ, Wu H, Trantirek L, O’Connor CM, Collins K, Feigon J. Structural study of elements of Tetrahymena telomerase RNA stem-loop IV domain important for function. RNA. 2006;12:1475–85. doi: 10.1261/rna.112306. [DOI] [PMC free article] [PubMed] [Google Scholar]
- Rodriguez-Castaneda F, Haberz P, Leonov A, Griesinger C. Paramagnetic tagging of diamagnetic proteins for solution NMR. Magn Reson Chem. 2006;44(Spec No S10–6) doi: 10.1002/mrc.1811. [DOI] [PubMed] [Google Scholar]
- Ruckert M, Otting G. Alignment of biological macromolecules in novel nonionic liquid crystalline media for NMR experiments. J Am Chem Soc. 2000;122:7793–7797. [Google Scholar]
- Sass HJ, Musco G, Stahl SJ, Wingfield PT, Grzesiek S. Solution NMR of proteins within polyacrylamide gels: Diffusional properties and residual alignment by mechanical stress or embedding of oriented purple membranes. J Biomol NMR. 2000;18:303–309. doi: 10.1023/a:1026703605147. [DOI] [PubMed] [Google Scholar]
- Sass J, Cordier F, Hoffmann A, Cousin A, Omichinski JG, Lowen H, Grzesiek S. Purple membrane induced alignment of biological macromolecules in the magnetic field. J Am Chem Soc. 1999;121:2047–2055. [Google Scholar]
- Staple DW, Butcher SE. Solution structure of the HIV-1 frameshift inducing stem-loop RNA. Nucleic Acids Res. 2003;31:4326–31. doi: 10.1093/nar/gkg654. [DOI] [PMC free article] [PubMed] [Google Scholar]
- Tjandra N, Bax A. Direct measurement of distances and angles in biomolecules by NMR in a dilute liquid crystalline medium. Science. 1997;278:1111–4. doi: 10.1126/science.278.5340.1111. [DOI] [PubMed] [Google Scholar]
- Tolman JR, Flanagan JM, Kennedy MA, Prestegard JH. Nuclear magnetic dipole interactions in field-oriented proteins: information for structure determination in solution. Proc Natl Acad Sci. 1995;92:9279–83. doi: 10.1073/pnas.92.20.9279. [DOI] [PMC free article] [PubMed] [Google Scholar]
- Tycko R, Blanco FJ, Ishii Y. Alignment of biopolymers in strained gels: A new way to create detectable dipole-dipole couplings in high-resolution biomolecular NMR. J Am Chem Soc. 2000;122:9340–9341. [Google Scholar]
- Valafar H, Prestegard JH. REDCAT: a residual dipolar coupling analysis tool. J Magn Reson. 2004;167:228–241. doi: 10.1016/j.jmr.2003.12.012. [DOI] [PubMed] [Google Scholar]
- van Buuren BNM, Schleucher A, Wittmann V, Griesinger C, Schwalbe H, Wijmenga SS. NMR spectroscopic determination of the solution structure of a branched nucleic acid from residual dipolar couplings by using isotopically labeled nucleotides. Angewandte Chemie-International Edition. 2004;43:187–192. doi: 10.1002/anie.200351632. [DOI] [PubMed] [Google Scholar]
- Vermeulen A. Dissertation. University of Colorado; 2003. Determining Nucleic Acid Global Structure by Application of NMR Residual Dipolar Couplings. [Google Scholar]
- Vermeulen A, McCallum SA, Pardi A. Comparison of the Structure and Dynamics of Native and Unmodified tRNAval. Biochemistry. 2005;44:6024–33. doi: 10.1021/bi0473399. [DOI] [PubMed] [Google Scholar]
- Vermeulen A, Zhou H, Pardi A. Determining DNA Global Structure and DNA Bending by Application of NMR Residual Dipolar Couplings. J Am Chem Soc. 2000;122:9638–9647. [Google Scholar]
- Wu B, Petersen M, Girard F, Tessari M, Wijmenga SS. Prediction of molecular alignment of nucleic acids in aligned media. J Biomol NMR. 2006;35:103–115. doi: 10.1007/s10858-006-9004-2. [DOI] [PubMed] [Google Scholar]
- Ying J, Grishaev A, Latham MP, Pardi A, Bax A. Magnetic field induced residual dipolar couplings of imino groups in nucleic acids from measurements at a single magnetic field. J Biomol NMR. 2007;39:91–6. doi: 10.1007/s10858-007-9181-7. [DOI] [PubMed] [Google Scholar]
- Yue D. Dissertation. Iowa State University; 1994. Structure and Function of Unmodified E.coli Valine-tRNA. [Google Scholar]
- Zweckstetter M, Bax A. Prediction of sterically induced alignment in a dilute liquid crystalline phase: Aid to protein structure determination by NMR. J Am Chem Soc. 2000;122:3791–3792. [Google Scholar]
- Zweckstetter M, Bax A. Evaluation of uncertainty in alignment tensors obtained from dipolar couplings. J Biomol NMR. 2002;23:127–137. doi: 10.1023/a:1016316415261. [DOI] [PubMed] [Google Scholar]
- Zweckstetter M, Hummer G, Bax A. Prediction of charge-induced molecular alignment of biomolecules dissolved in dilute liquid-crystalline phases. Biophys J. 2004;86:3444–3460. doi: 10.1529/biophysj.103.035790. [DOI] [PMC free article] [PubMed] [Google Scholar]
Associated Data
This section collects any data citations, data availability statements, or supplementary materials included in this article.