Abstract
In response to light, the mouse retinal pigment epithelium (RPE) generates a series of slow changes in potential that are referred to as the c-wave, fast oscillation (FO), and light peak (LP) of the electroretinogram (ERG). The LP is generated by a depolarization of the basolateral RPE plasma membrane by the activation of a calcium-sensitive chloride conductance. We have previously shown that the LP is reduced in both mice and rats by nimodipine, which blocks voltage-dependent calcium channels (VDCCs) and is abnormal in lethargic mice, carrying a null mutation in the calcium channel β4 subunit. To define the α1 subunit involved in this process, we examined mice lacking CaV1.3. In comparison with wild-type (WT) control littermates, LPs were reduced in CaV1.3−/− mice. This pattern matched closely with that previously noted in lethargic mice, confirming a role for VDCCs in regulating the signaling pathway that culminates in LP generation. These abnormalities do not reflect a defect in rod photoreceptor activity, which provides the input to the RPE to generate the c-wave, FO, and LP, because ERG a-waves were comparable in WT and CaV1.3−/− littermates. Our results identify CaV1.3 as the principal pore-forming subunit of VDCCs involved in stimulating the ERG LP.
INTRODUCTION
The light peak (LP) of the electroretinogram (ERG) is caused by a depolarization of the basolateral plasma membrane of the retinal pigment epithelium (RPE), resulting from changes in the activity of one or more calcium-sensitive chlo-ride channels (Gallemore and Steinberg 1989, 1993). This component is useful clinically in confirming the diagnosis of best vitelliform macular dystrophy (BVMD), where the LP is reduced in amplitude or absent, whereas other ERG components are spared. Because bestrophin (Best-1) mutations underlie BVMD (Petrukhin et al. 1998) and because bestrophin is localized to the basolateral RPE membrane (Marmorstein et al. 2000) and can function as a chloride channel when expressed in vitro (Sun et al. 2002), it has been proposed that bestrophin is the chloride channel that generates the LP. This proposal has been challenged by recent observations in mice lacking best-1, which retain the ERG LP (Marmorstein et al. 2006) and show an altered luminance response function suggesting that bestrophin functions to antagonize rather than generate the LP.
An alternative proposal for LP generation has been developed based on ERG LP recordings made after the systemic administration of nimodipine, an inhibitor of voltage-dependent calcium channels (VDCCs), and in lethargic mice, which carry a loss-of-function mutation in the VDCC β4 subunit. In both cases, the LP was reduced in amplitude, and in lethargic mice, the luminance response function was 1 log unit less sensitive, whereas the response functions for other ERG components were less affected (Marmorstein et al. 2006; Rosenthal et al. 2006). In the arterially perfused cat eye model, Hofmann and Niemeyer (1985) reported that the LP was reversibly reduced when extracellular calcium concentrations were increased. Taken together with the results obtained in mice lacking best-1 and other results showing that bestrophin modulates the activity of VDCCs (Rosenthal et al. 2006), these data suggest that the LP is generated by a calcium-sensitive chloride channel, whose activity is modulated by VDCCs, which are in turn modulated by bestrophin (Marmorstein et al. 2006). This scenario indicates that similar results should be obtained from mice lacking the α1 pore-forming subunit that pairs with β4. Of the four CaV1 subunits, only CaV1.3 (CACNA1D) is known to be expressed in the RPE (Rosenthal et al. 2006). In this study, we report LP abnormalities in CaV1.3−/− mice that match those seen in lethargic mice, confirming a role for VDCCs in LP generation.
METHODS
Mice
CaV1.3+/− mice on a C57BL/6J background (Platzer et al. 2000) were obtained from a breeding colony located at Northwestern University and mated to generate the mice studied here. All procedures involving mice were approved by the Institutional Animal Care and Use Committee of the Cleveland Clinic Foundation and were conducted in accordance with the Institute for Laboratory Animal Research Guide for Care and Use of Laboratory Animals. Mice were genotyped using PCR and were tested between 6 and 16 wk of age.
Stimulation and recording
After overnight dark adaptation, mice were anesthetized with a mixture of ketamine (80 mg/kg) and xylazine (16 mg/kg) diluted in saline. The pupils were dilated with 1% mydriacyl, 1% cyclopentolate hydrochloride HCl, and 2.5% phenylephrine HCl, and the corneal surface was anesthetized with 0.5% proparacaine HCl. Mice were placed on a temperature-regulated heating pad during the ERG recording session.
To measure ERG components generated by the outer neural retina, responses were recorded from the corneal surface using a stainless steel electrode that was wetted with 0.7% methylcellulose. Needle electrodes placed in the cheek and the tail served as reference and ground leads, respectively. Responses were differentially amplified (0.3–1,500 Hz), averaged, and stored using a UTAS E-3000 signal averaging system (LKC Technologies, Gaithersburg, MD). Responses were obtained to stimuli presented in the dark. Flash stimuli were presented in an LKC ganzfeld and ranged in intensity from −3.6 to 2.1 log cd s/m2; interstimulus intervals increased from 4 s at the lowest flash intensity to 61 s at the highest stimulus levels. Stimuli were presented in order of increasing intensity and at least two successive responses were averaged for each stimulus condition.
The amplitude of the a-wave was measured 8 ms after flash onset from the prestimulus baseline. The amplitude of the b-wave was measured from the a-wave trough to the peak of the b-wave or, if no a-wave was present, from the prestimulus baseline. Implicit times of the a- and b-waves were measured from the time of flash onset to the a-wave trough or the b-wave peak.
To measure ERG components generated by the RPE, responses were recorded from the corneal surface of both eyes using a pair of 1-mm-diam glass capillary tubes with filament (BF100-50-10, Sutter Instruments, Novato, CA) that were filled with HBSS to make contact with a Ag/AgCl wire electrode with an attached connector. Both electrodes were shielded in a black tube, and responses were differentially amplified (DP-301, Warner Instruments, Hamden, CT; direct-current (dc)-100 Hz; gain = 1,000 times), digitized at 20 Hz, and stored using LabScribe Data Recording Software (iWorx, Dover, NH).
White light stimuli were derived from an optical channel using a Leica microscope illuminator as the light source and delivered to the left eye with a 1-cm-diam fiber optic bundle; the right eye was shielded from light stimulation with a baffle constructed from black electrical tape. On a given day, mice were tested once using a single stimulus condition. Responses recorded to different intensity stimuli, used in recording sessions that were separated by several days, were used to construct intensity-response functions for each mouse. Maximum stimulus intensity (4.4 log cd/m2; corresponding to 4.8 log photoisomerizations/rod/s) (Wu et al. 2004b) was reduced using neutral density filters (Oriel Instruments, Stratford, CT). Stimulus duration was controlled at 7 min using a Uniblitz shutter system.
The amplitude of the c-wave was measured from the prestimulus baseline to the peak of the c-wave. The amplitude of the fast oscillation (FO) was measured from the c-wave peak to the trough of the FO. The amplitude of the LP was measured from the FO trough to the asymptotic value. The amplitude of the OFF-response was measured from the LP asymptote to the peak of the OFF-response, which in mice could be either negative or positive in polarity, depending on flash intensity (Wu et al. 2004a,b).
RESULTS
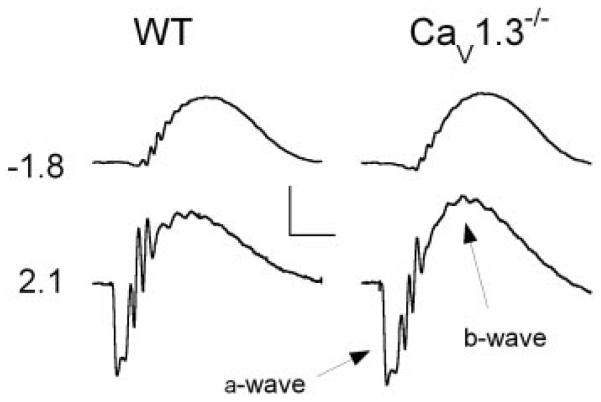
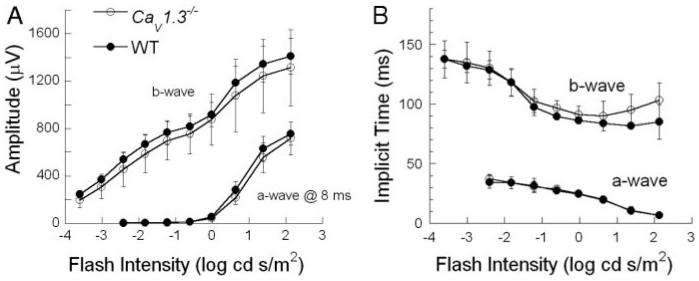
Figure 1 compares representative ERGs recorded from WT (left) and CaV1.3−/− mice (right) to two strobe flash stimulus intensities presented under dark-adapted conditions. Compared with WT mice, there was no difference apparent in the ERG waveforms obtained from CaV1.3−/− mice. This impression was examined quantitatively by plotting intensity-response functions for the amplitude (Fig. 2A) and implicit time (Fig. 2B) of the dark-adapted ERG a- and b-waves. For all measures, the WT and CaV1.3−/− data appeared in close agreement. This impression was confirmed statistically by two-way repeated-measures ANOVA, which indicated no significant difference in the a- or b-wave parameters of WT and CaV1.3−/− mice (F1,4 < 1). The components of the dc-ERG are primarily driven by rod photoreceptor activity (Wu et al. 2004a), and this input appears normal in CaV1.3−/− mice.
FIG. 1.
Representative dark-adapted ERGs obtained from strobe flash stimuli from WT (left) and CaV1.3−/− (right) littermates. Values to the left indicate flash intensity in log cd s/m2. The major components are indicated. Scale bars indicate 400 μV and 50 ms.
FIG. 2.
Intensity-response functions for the amplitude (A) and implicit time (B) of the major components of dark-adapted ERGs obtained from WT and Ca 1.3−/− littermates. Data points indicate average ± SD for ≥5 mice.
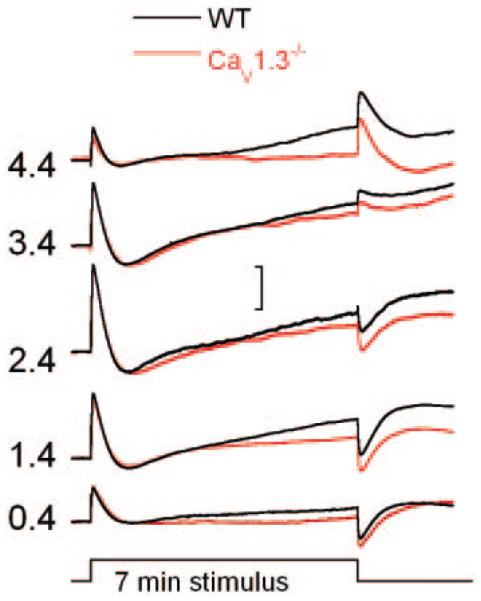
Figure 3 presents dc-ERGs recorded from WT (black tracings) and CaV1.3−/− (red tracings) mice to a 4 log unit range of flash intensities. Although all of the major components of the dc-ERG were present in the responses of WT and CaV1.3−/− mice, the LP components of CaV1.3−/− responses were smaller than those of WT.
FIG. 3.
Representative dc-ERGs obtained from 7-min stimuli from WT (black tracings) and CaV1.3−/− (red tracings) littermates. Values to the left indicate flash intensity in log cd/m2. Scale bar indicates 1 mV.
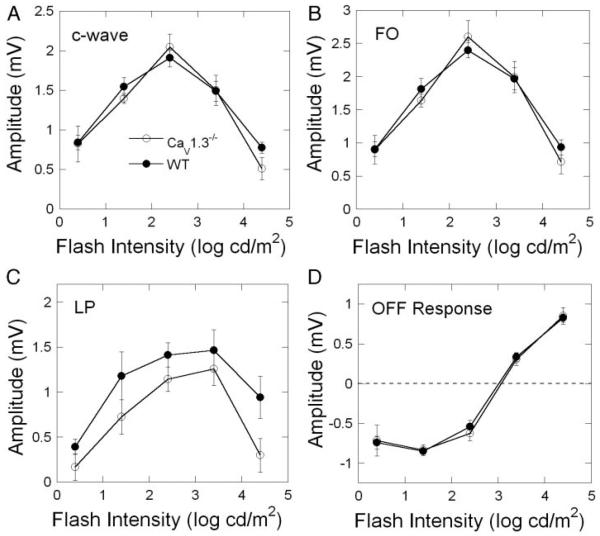
Figure 4 presents intensity-response functions for the major components of the dc-ERG: the c-wave (Fig. 4A), the FO (Fig. 4B), the LP (Fig. 4C), and the OFF-response (Fig. 4D). The response functions of WT and CaV1.3−/− mice were comparable throughout the intensity range examined for the c-wave, FO, and OFF-response. Repeated-measures ANOVAs confirmed no difference (F1,7 < 1) between WT and CaV1.3−/− mice in the amplitudes of these components. In comparison, the LP component appeared consistently smaller in CaV1.3−/− than in WT mice. A repeated-measures ANOVA indicated that this reduction was statistically significant (F1,7 = 9.64; P < 0.05).
FIG. 4.
Intensity-response functions for the major components of the dc-ERG. Data points indicate average ± SD for ≥5 mice.
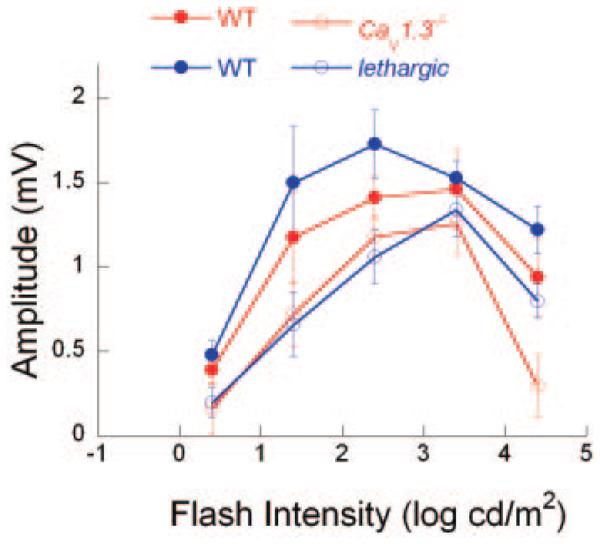
We have previously noted that lethargic mice lacking β4 subunits have reduced LPs (Marmorstein et al. 2006). Figure 5 plots the WT and CaV1.3−/− LP data from Fig. 4C along with LP results obtained from lethargic mice and their control littermates. Although the overall LP response function is somewhat reduced in WT littermates of CaV1.3−/− mice in comparison with those of lethargic mice, the overall shape of the function is comparable. It was interesting to note that the deviations from the WT pattern are similar in both VDCC subunit mutants. In both cases, greatest reduction occurs at low and high stimulus intensities, with less of a reduction to the middle intensities used.
FIG. 5.
Comparison of LP amplitude data obtained from VDCC mutant mice. Amplitude data from Fig. 4C for WT and CaV1.3−/− littermates (red filled and open circles, respectively) are plotted along with comparable data from Marmorstein et al. (2006) for WT and lethargic littermates (blue filled and open circles, respectively).
DISCUSSION
The LP component of the ERG was reduced in amplitude in CaV1.3−/− mice. This abnormality is not secondary to a defect in rod photoreceptor activity, which provides the initiating stimulus to the RPE to generate the LP (Wu et al. 2004b). This input was normal in CaV1.3−/− mice, based on analysis of the leading edge of the dark-adapted ERG a-wave. It is also unlikely that CaV1.3 deletion caused a change in the LP through indirect mechanisms, such as through cardiovascular effects. CaV1.3 is not involved in the regulation of vascular myogenic tone (Sinnegger-Brauns et al. 2004; Zhang et al. 2007), and the bradycardia present at rest in CaV1.3−/− mice is not observed under stressful conditions, like anesthesia (Platzer et al. 2000). Aside from congenital deafness, these mice do not have other neurological abnormalities (Clark et al. 2003). Instead, the selective reduction of the LP component is likely to reflect a defect in LP generation within RPE cells.
It is interesting to note that the abnormalities noted in CaV1.3−/− mice resemble closely those noted previously in lethargic mice (Marmorstein et al. 2006; Fig. 5), which carry a defect in the VDCC β4 subunit (Burgess et al. 1997). Taken together, these results indicate that VDCCs play a role in generating the LP component. This conclusion is also supported by pharmacological studies where the VDCC blocker nimodipine was also found to reduce LP amplitude in WT mice (Marmorstein et al. 2006) and rats (Rosenthal et al. 2006). Because these studies examined only a limited range of stimulus conditions, it will be of interest to evaluate the effect of nimodipine and other agents that affect VDCC function across the intensity range examined here.
Because the LP is generated by the basolateral RPE membrane in response to light-evoked retinal activity, it is clear that LP generation needs an intracellular signaling pathway. Although this study contributes to our understanding of that pathway, further work will be needed to identify two key components. First, although the concept of an “LP substance,” released by the neural retinal to a receptor on the apical membrane of the RPE, is generally accepted, the identity of this ligand has not been identified. Nevertheless, despite considerable effort to evaluate LP substance candidates (dopa-mine: Dawis and Niemeyer 1986; Gallemore and Steinberg 1990; epinephrine: Joseph and Miller 1992; adrenergic agents: Quinn et al. 2001; melatonin: Dawis and Niemeyer 1988), none of these has received unequivocal experimental support. In comparison, adenosine has been shown to reduce the LP in the arterially perfused cat eye (Blazynski et al. 1989), and adeno-sine receptors have been localized to the RPE (Blazynski 1993; Friedman et al. 1989). Although its role in LP generation remains to be determined, adenosine is known to regulate ATP-induced calcium-dependent intracellular signaling (Collison et al. 2005).
Second, although the LP generator is known to be a chloride channel (Gallemore and Steinberg 1989, 1993), the chloride channel that underlies the LP has yet to be identified. As noted above, mice lacking bestrophin generate LPs of normal or supernormal amplitude (Marmorstein et al. 2006), and rats overexpressing WT bestrophin have decreased sensitivity but no increase in LP amplitude (Marmorstein et al. 2004). Thus despite a substantial body of in vitro evidence that bestrophin can form chloride channels (reviewed by Hartzell et al. 2005), such function is not needed to generate the LP, and overexpression of bestrophin does not translate simply to larger LPs. Instead, the observations that VDCCs are needed for LP generation, together with prior data showing that bestrophin modulates the activity of VDCCs (Marmorstein et al. 2006; Rosenthal et al. 2006), indicates that the signal pathway culminating in chloride channel activation and LP generation is modulated by VDCCs, which in turn are modulated by bestrophin. Although cystic fibrosis transmembrane regulator (CFTR) can form calcium-sensitive chloride channels (Anderson et al. 1991), LPs are retained in CFTR-mutant mice, albeit with reduced amplitude (Wu et al. 2006). Identification of the chloride channel(s) involved will be needed to complete a model of LP generation.
Finally, the body of evidence implicating VDCCs in generating the LP in rodents motivates the question of whether VDCCs play a similar role in the human RPE. It will be important to examine this question by, for example, using the electro-oculogram (Arden 1962; Arden and Kelsey 1962) to examine LPs in humans carrying VDCC mutations and/or after the administration of agents that alter VDCC function.
ACKNOWLEDGMENTS
We thank Dr. James Surmeier (Northwestern University) for providing breeder mice from his CaV1.3 colony and G. Sturgill for genotyping the mice tested here.
GRANTS
This work was supported by National Eye Institute Grants R01 EY-14465, R01 EY-13160, and R24 EY-15638, the Macular Vision Research Foundation, the Department of Veterans Affairs, unrestricted grants from Research to Prevent Blindness, and Austrian Science Fund Grant P17159.
REFERENCES
- Anderson MP, Gregory RJ, Thompson S, Souza DW, Paul S, Mulligan RC, Smith AE, Welsh MJ. Demonstration that CFTR is a chloride channel by alteration of its anion selectivity. Science. 1991;243:202–205. doi: 10.1126/science.1712984. [DOI] [PubMed] [Google Scholar]
- Arden GB. Alterations in the standing potential of the eye associated with retinal disease. Trans Am Ophthalmol Soc UK. 1962;82:63–73. [PubMed] [Google Scholar]
- Arden GB, Kelsey JH. Changes produced by light in the standing potential of the human eye. J Physiol. 1962;161:189–204. doi: 10.1113/jphysiol.1962.sp006881. [DOI] [PMC free article] [PubMed] [Google Scholar]
- Blazynski C. Characterization of adenosine A2 receptors in bovine retinal pigment epithelial membranes. Exp Eye Res. 1993;56:595–599. doi: 10.1006/exer.1993.1073. [DOI] [PubMed] [Google Scholar]
- Blazynski C, Cohen AI, Fruh B, Niemeyer G. Adenosine: autoradiographic localization and electrophysiologic effects in the cat retina. Invest Ophthalmol Vis Sci. 1989;30:2533–2536. [PubMed] [Google Scholar]
- Burgess DL, Jones JM, Meisler MH, Noebels JL. Mutation of the Ca2+ channel β subunit gene Cchb4 is associated with ataxia and seizures in the lethargic (lh) mouse. Cell. 1997;88:385–392. doi: 10.1016/s0092-8674(00)81877-2. [DOI] [PubMed] [Google Scholar]
- Clark NC, Nagano N, Kuenzi FM, Jarolimek W, Huber I, Walter D, Wietzorrek G, Boyce S, Kullmann DM, Striessnig J, Seabrook GR. Neurological phenotype and synaptic function in mice lacking the CaV1.3 α subunit of neuronal L-type voltage-dependent Ca2+ channels. Neuroscience. 2003;120:435–442. doi: 10.1016/s0306-4522(03)00329-4. [DOI] [PubMed] [Google Scholar]
- Collison DJ, Tovell VE, Coombes LJ, Duncan G, Sanderson J. Potentiation of ATP-induced Ca2+ mobilisation in human retinal pigment epithelial cells. Exp Eye Res. 2005;80:465–475. doi: 10.1016/j.exer.2004.09.009. [DOI] [PubMed] [Google Scholar]
- Dawis SM, Niemeyer G. Dopamine influences the light peak in the perfused mammalian eye. Invest Ophthalmol Vis Sci. 1986;27:330–335. [PubMed] [Google Scholar]
- Dawis SM, Niemeyer G. Similarity and diversity of monoamines in their effects on the standing potential, light peak and electroretinogram of the perfused cat eye. Clin Vision Sci. 1988;3:108–119. [Google Scholar]
- Friedman Z, Hackett SF, Linden J, Campochiaro PA. Human retinal pigment epithelial cells in culture possess A2-adenosine receptors. Brain Res. 1989;492:29–35. doi: 10.1016/0006-8993(89)90885-8. [DOI] [PubMed] [Google Scholar]
- Gallemore RP, Steinberg RH. Effects of DIDS on the chick retinal pigment epithelium. II. Mechanism of the light peak and other responses originating at the basal membrane. J Neurosci. 1989;9:1977–1984. doi: 10.1523/JNEUROSCI.09-06-01977.1989. [DOI] [PMC free article] [PubMed] [Google Scholar]
- Gallemore RP, Steinberg RH. Effects of dopamine on the chick retinal pigment epithelium. Membrane potentials and light-evoked responses. Invest Ophthalmol Vis Sci. 1990;31:67–80. [PubMed] [Google Scholar]
- Gallemore RP, Steinberg RH. Light-evoked modulation of basolateral membrane Cl- conductance in chick retinal pigment epithelium: the light peak and fast oscillation. J Neurophysiol. 1993;70:1669–1680. doi: 10.1152/jn.1993.70.4.1669. [DOI] [PubMed] [Google Scholar]
- Hartzell HC, Putzier I, Arreola J. Calcium-activated chloride channels. Annu Rev Physiol. 2005;67:719–758. doi: 10.1146/annurev.physiol.67.032003.154341. [DOI] [PubMed] [Google Scholar]
- Hofmann H, Niemeyer G. Calcium blocks selectively the EOG-light peak. Doc Ophthalmol. 1985;60:361–368. doi: 10.1007/BF00158925. [DOI] [PubMed] [Google Scholar]
- Joseph DP, Miller SS. Alpha-1-adrenergic modulation of K and Cl transport in bovine retinal pigment epithelium. J Gen Physiol. 1992;99:263–290. doi: 10.1085/jgp.99.2.263. [DOI] [PMC free article] [PubMed] [Google Scholar]
- Marmorstein AD, Marmorstein LY, Rayborn M, Wang X, Hollyfield JG, Petrukhin K. Bestrophin, the product of the Best vitelliform macular dystrophy gene (VMD2) localizes to the basolateral plasma membrane of the retinal pigment epithelium. Proc Natl Acad Sci USA. 2000;97:12758–12763. doi: 10.1073/pnas.220402097. [DOI] [PMC free article] [PubMed] [Google Scholar]
- Marmorstein AD, Stanton JB, Yocom J, Bakall B, Schiavone MT, Wade-lius C, Marmorstein LY, Peachey NS. A model of best vitelliform macular dystrophy in rats. Invest Ophthalmol Vis Sci. 2004;45:3733–3739. doi: 10.1167/iovs.04-0307. [DOI] [PMC free article] [PubMed] [Google Scholar]
- Marmorstein LY, Wu J, Yocom J, McLaughlin P, Gregg RG, Strauss O, Peachey NS, Marmorstein AD. Generation of the light peak of the electroretinogram requires voltage gated calcium channels and is antagonized by bestrophin. J Gen Physiol. 2006;127:577–589. doi: 10.1085/jgp.200509473. [DOI] [PMC free article] [PubMed] [Google Scholar]
- Petrukhin K, Koisti MJ, Bakall B, Li W, Xie G, Marknell T, Sandgren O, Forsman K, Holmgren G, Andreasson S, Vujic M, Bergen AA, McGarty-Dugan V, Figueroa D, Austin CP, Metzker ML, Caskey CT, Wadelius C. Identification of the gene responsible for best macular dystrophy. Nat Genet. 1998;19:241–247. doi: 10.1038/915. [DOI] [PubMed] [Google Scholar]
- Platzer J, Engel J, Schrott-Fischer A, Stephan K, Bova S, Chen H, Zheng H, Striessnig J. Congenital deafness and sinoatrial node dysfunction in mice lacking class D L-type Ca2+ channels. Cell. 2000;102:89–97. doi: 10.1016/s0092-8674(00)00013-1. [DOI] [PubMed] [Google Scholar]
- Quinn RH, Quong JN, Miller SS. Adrenergic receptor activated ion transport in human fetal retinal pigment epithelium. Invest Ophthalmol Vis Sci. 2001;42:255–264. [PubMed] [Google Scholar]
- Rosenthal R, Bakall B, Kinnick T, Peachey N, Wimmers S, Wadelius C, Marmorstein AD, Strauss O. Expression of bestrophin-1, the product of the VMD2 gene, modulates voltage-dependent Ca2+ channels in retinal pigment epithelial cells. FASEB J. 2006;20:78–80. doi: 10.1096/fj.05-4495fje. [DOI] [PubMed] [Google Scholar]
- Sinnegger-Brauns MJ, Hetzenauer A, Huber IG, Renstrom E, Wietzorrek G, Berjukov S, Cavalli M, Walter D, Koschak A, Waldschutz R, Hering S, Bova S, Rorsman P, Pongs O, Singewald N, Striessnig J. Isoform-specific regulation of mood behavior and pancreatic β cell and cardiovascular function by L-type Ca2+ channels. J Clin Invest. 2004;113:1430–1439. doi: 10.1172/JCI20208. [DOI] [PMC free article] [PubMed] [Google Scholar]
- Sun H, Tsunenari T, Yau K-W, Nathans J. The vitelliform macular dystrophy protein defines a new family of chloride channels. Proc Natl Acad Sci USA. 2002;99:4008–4013. doi: 10.1073/pnas.052692999. [DOI] [PMC free article] [PubMed] [Google Scholar]
- Wu J, Marmorstein AD, Kofuji P, Peachey NS. Contribution of Kir4.1 to the mouse electroretinogram. Mol Vision. 2004a;10:650–654. [PMC free article] [PubMed] [Google Scholar]
- Wu J, Marmorstein AD, Peachey NS. Functional abnormalities in the retinal pigment epithelium of CFTR mutant mice. Exp Eye Res. 2006;83:424–428. doi: 10.1016/j.exer.2006.01.021. [DOI] [PMC free article] [PubMed] [Google Scholar]
- Wu J, Peachey NS, Marmorstein AD. Light-evoked responses of the mouse retinal pigment epithelium. J Neurophysiol. 2004b;91:1134–1142. doi: 10.1152/jn.00958.2003. [DOI] [PMC free article] [PubMed] [Google Scholar]
- Zhang J, Berra-Romani R, Sinnegger-Brauns MJ, Striessnig J, Blaustein MP, Matteson DR. Role of CaV 1.2 L-type Ca2+ v channels in vascular tone: effects of nifedipine and Mg2+ Am J Physiol Heart Circ Physiol. 2007;292:H415–H425. doi: 10.1152/ajpheart.01214.2005. [DOI] [PubMed] [Google Scholar]


