

Abstract
Background
Although grading has prognostic significance for many tumor types, a prognostically significant grading system for lung adenocarcinoma has not yet been established. The aim of this study was to evaluate histologic characteristics included in tumor grading systems, establish optimal cutoff values that have the strongest association with overall survival, and develop a grading system incorporating the histopathologic characteristics that we found to have prognostic significance in patients with lung adenocarcinoma.
Methods
We studied lung adenocarcinomas from 85 consecutive patients, and evaluated the percentage of solid pattern (as a reflection of tumor architecture), the degree of cytologic atypia, and the mitotic count.
Results
In univariate analysis, overall survival was associated significantly with sex (P=0.045), age (P=0.0008), tumor status (P<0.0001), node status (P=0.02), solid pattern (P=0.046) and cytologic atypia (P=0.01), but not with mitotic count (P=0.26). Based on optimal cutoff values, we found that a solid pattern ≥ 90% and severe cytologic atypia were the best discriminators of worse outcome. A grading score, computed as the sum of the architecture score and cytologic atypia score (2=well differentiated, 3=moderately differentiated, 4=poorly differentiated), was a significant predictor of overall survival in univariate analysis (median overall survival times 72.4, 39.5, and 8.7 months for well, moderately and poorly differentiated adenocarcinoma, respectively P=0.0001). Moreover, grading was an independent predictor of survival in multivariate analysis (P=0.002).
Conclusions
We describe a grading system that incorporates the percentage of solid pattern and degree of the cytologic atypia that is an independent predictor of survival in patients with lung adenocarcinoma.
Keywords: Lung adenocarcinoma, grading, survival
Introduction
Lung cancer is the leading cause of death from cancer in both men and women.1 Despite advances in treatment, the five-year overall survival rate is approximately 15.7%.2 Non-small cell lung cancer (NSCLC) accounts for approximately 85% of lung cancer cases, and adenocarcinoma has become the predominant type of NSCLC in the previous decades.6, 8 Prognostic indicators for lung adenocarcinoma are important to refine prognostic profiles that can potentially select patients who will benefit most from aggressive treatment strategies and save others from their toxicity. Currently, pathologic stage is the most important system to predict survival in patients with NSCLC 3, 4 and to define groups to undergo similar treatment strategies.5
For most epithelial neoplasms, there are established grading criteria that have prognostic value.6-10 Although the WHO classification describes grading of lung adenocarcinomas as a qualitative assessment of tumor differentiation based both on the extent to which the architectural pattern of the tumor resembles normal lung tissue and cytologic atypia,11 the prognostic value of architectural patterns, cytologic features, and number of mitoses is uncertain in lung adenocarcinomas,11-14 Recent studies indicating the prognostic significance of tumor grade in lung adenocarcinoma12, 15, 16 use subjective criteria for grading. There is increasing interest in establishing consensus criteria for assessing tumor grade in lung adenocarcinomas, in part, to aid in the comparison of results of clinical trials and to aid in the comparison of studies correlating molecular findings with histologic characteristics.
The aim of this study was to evaluate histologic characteristics included in tumor grading, establish optimal cutoff values, and develop a grading system that has prognostic significance in patients with lung adenocarcinoma. We conducted a retrospective study and evaluated the prognostic significance of histologic characteristics that are conventionally included in tumor grading schemes.6-10, 17, 18 For each parameter we determined the optimal cutoff values with the strongest association with overall survival. We developed a grading system that incorporates the histopathologic characteristics with prognostic significance and compared the findings with overall survival.
Materials and Methods
Patient characteristics
The study group included 85 consecutive patients with lung adenocarcinoma treated with surgery alone or surgery and postoperative adjuvant therapy at Brigham and Women's Hospital between January 1997 and December 1999 (Table 1). The group was identified through a search of the Department of Pathology Registry database maintained by the Department of Pathology and included location and type of the primary tumor. Each resection specimen had been evaluated with standard pathologic methods as described in the Surgical Pathology Dissection Manual of the Department of Pathology.19 The cases were reviewed according to WHO classification criteria11 and staged according to Sixth Edition of the American Joint Committee on Cancer manual.3
TABLE 1.
Clinicopathologic Characteristics of Patients with Lung Adenocarcinoma (N=85)
| Characteristic | No. of patients (%)* |
|---|---|
| Sex | |
| Male | 31 (36.5) |
| Female | 54 (63.5) |
| Age (yr) | |
| Mean | 64.7 |
| Range | (34-84) |
| Smoking status** | |
| Never-smoker | 11 (14.7) |
| Smoker | 64 (85.4) |
| Pack-years (mean) | 48.3 |
| Resection Type | |
| Wedge resection | 26 (30.6) |
| Lobectomy | 58 (68.2) |
| Pneumonectomy | 1 (1.2) |
| Treatment Sequence | |
| Surgery alone | 60 (70.6) |
| Surgery plus adjuvant therapy | 25 (29.4) |
| Tumor location | |
| Right | 43 (50.6) |
| Left | 42 (49.4) |
| Pathologic stage | |
| I A | 22 (25.9) |
| I B | 30 (35.3) |
| II A | 3 (3.5) |
| II B | 9 (10.6) |
| III A | 6 (7.1) |
| III B | 7 (8.2) |
| IV | 8 (9.4) |
| Tumor status† | |
| pT1 | 31 (36.5) |
| pT2 | 41 (48.2) |
| pT3 | 3 (3.5) |
| pT4 | 10 (11.8) |
| Node status†§ | |
| Negative | 54 (71.1) |
| Positive | 22 (29.8) |
| Metastasis status† | |
| Negative | 77 (90.6) |
| Positive | 8 (9.4) |
Due to rounding, not all percentages total 100.
Smoking status was known in 75 patients.
Tumor, node and metastasis status were based on pathology evaluation (pTNM Stage).
76 patients had surgically resected lymph nodes.
Patients were selected for study with the following inclusion criteria: lung adenocarcinoma; first treatment by surgery alone, with or without postoperative adjuvant treatment; no other malignant tumors in the five years prior to the diagnosis of lung adenocarcinoma except squamous cell or basal cell carcinoma of the skin or carcinoma in situ of the uterine cervix; and no deaths in the perioperative period less than 30 days after surgery.
The clinical characteristics ascertained were sex, age, smoking status, cigarette consumption, and type of surgery (Table 1). The pathologic characteristics were anatomic location of the primary tumor, pathologic stage, tumor and lymph node status (Table 1).
Histopathologic Analysis of the Lung Adenocarcinomas
All hematoxylin and eosin (H&E) slides of tumor for each case were reviewed (median 3 tumor slides, range 1-10 slides). Tumors were sampled on average in 1 slide per 9.1 mm (median 6.3 mm-1, 95% confidence interval 7.3 mm-1 to 10.8 mm-1). Each case was evaluated for tumor architecture, degree of cytologic atypia, and mitotic count. In addition, the subtype of adenocarcinoma and the dominant histologic pattern (acinar, papillary, bronchioloalveolar, and micropapillary) were recorded.
Tumor architecture
We assessed the amount of solid growth pattern in each adenocarcinoma. since recent studies indicate that the presence of solid growth is an indicator of poor prognosis in patients with lung adenocarcinoma.12, 13, 20
Solid pattern was defined as solid sheets of tumor without the formation of acini, papillae, or micropapillae (Figure 1A) or areas of tumor with sheets or nests of tumor with intervening fibrous tissue (Figure 1B). The percentage of solid pattern was estimated from the total tumor area present in all slides with tumor and recorded in 10-percent increment intervals. All adenocarcinomas with a pure solid pattern were confirmed by a positive mucicarmine and negative p63, synaptophysin and chromogranin immunoreactivity.
Figure 1.
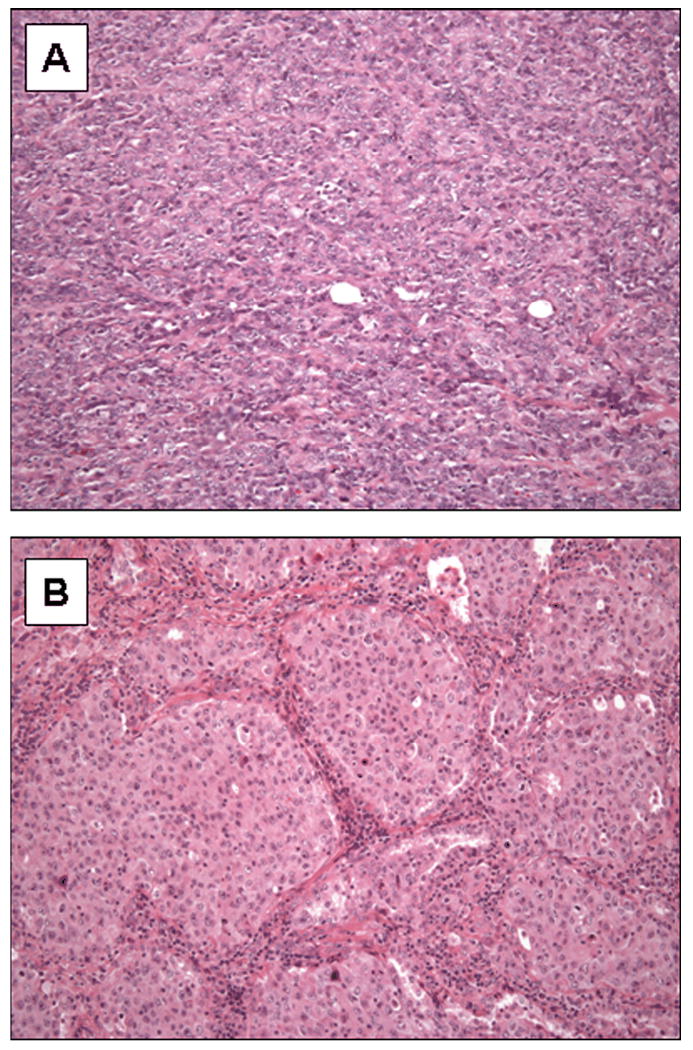
Examples of lung adenocarcinomas with a solid pattern. Solid growth was defined as (A) sheets of tumor cells or (B) nests of tumor with intervening fibrous tissue.
Cytologic atypia
The determinants of cytologic atypia were nuclear pleomorphism and presence of distinct nucleoli (Figure 2). Tumors were classified in three categories and recorded as: mild atypia (relatively uniform nuclei with indistinct nucleoli at 100× magnification), moderate atypia (relatively uniform nuclei with distinct nucleoli at 100× magnification) or severe atypia (bizarre, enlarged nuclei of varied sizes, with some nuclei at least twice as large as others). For heterogeneous tumors that had areas with different degrees of cytologic atypia, the highest degree of atypia was recorded.
Figure 2.
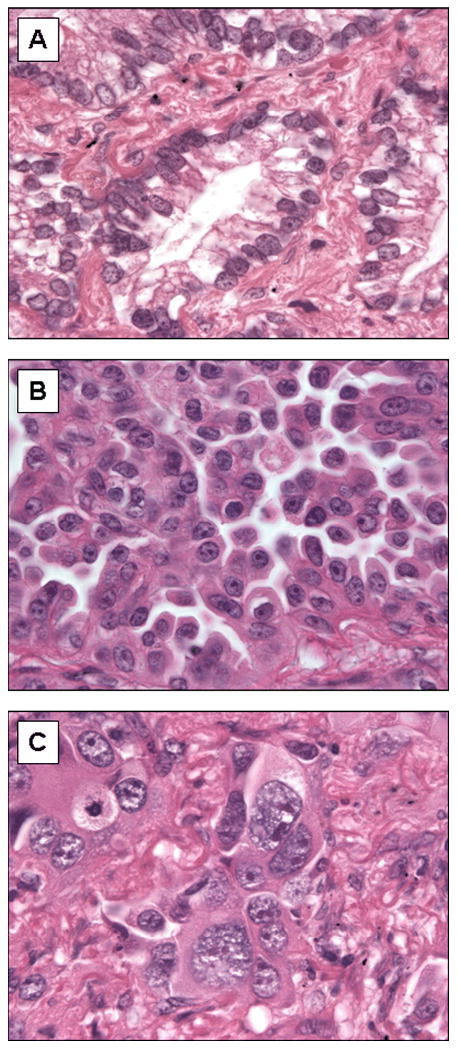
Examples of mild, moderate, and severe cytologic atypia. (A) Mild atypia: uniform nuclei with indistinct nucleoli at 100× magnification. (B) Moderate atypia: relatively uniform nuclei with distinct nucleoli at 100× magnification (C) Severe atypia: bizarre, enlarged nuclei of varied sizes, with some nuclei at least twice as large as others.
Mitotic count
For each case we examined between 30 and 50 high power fields (HPF) using an Olympic BX41 microscope at 400× magnification (objective 40×, visible area = 2.37 mm2) and recorded the average number of mitoses in 10 HPF.
Dominant Histologic Pattern
The subtype of adenocarcinoma and the dominant histologic pattern were recorded, as has previously been described.12 Briefly, each tumor was categorized as pure or mixed. For mixed subtype tumors, the percentage of each histologic component (acinar, papillary, solid, micropapillary, and bronchioloalveolar) was recorded in 10-percent increment intervals. The dominant histologic pattern was defined as the subtype of adenocarcinoma for pure tumors or the histologic component accounting for the highest percentage of the tumor for mixed subtype tumors.12
Statistical analysis
Chi-squared test was used to assess possible associations between the tumor grading score and categorical or binary clinicopathologic characteristics. Overall survival was calculated from time of surgery to time of death from any cause or to time of last follow-up, at which point the data were censored. Overall survival curves were constructed using the Kaplan-Meier method, and the log-rank test was used to evaluate the statistical significance of differences.
For each of the histologic grading parameters (tumor architecture, cytologic atypia, and mitotic count), we determined the cutoff value associated with the largest difference in overall survival, as measured by the log-rank statistic.
The independent prognostic significance of the tumor grading score was determined using Cox proportional hazards model for multivariate analysis with clinicopathologic characteristics.
The statistical analysis was computed using SAS 9.1 (SAS institute, Cary, NC). Kaplan-Meier survival curves were drawn with GraphPad Prism (version 5.01 for Windows; GraphPad Software, San Diego, CA). All p-values are two-sided, and a level of 0.05 was considered as statistically significant.
Results
Patient Demographics and Clinical Characteristics
The clinicopathologic characteristics of the patients with lung adenocarcinoma included in this study are summarized in Table 1.
Thirty-one (36.5%) patients were men, and 54 patients (63.5%) were women. The mean age was 64.7 years (range 34-84 years). Of the 75 patients with known smoking status, 11 patients (14.7%) were never-smokers, and 64 patients (85.4%) were current or former smokers that had an average cigarette consumption of 48.3 ± 3.8 pack-years (standard error, 95 percent confidence interval 40.7 to 55.9). The surgical procedure was wedge resection in 26 patients (30.6%), lobectomy in 58 patients (68.2%), and pneumonectomy in 1 patient (1.2%). Twenty-five patients (29.4%) received adjuvant therapy (chemotherapy=7, radiation therapy=13, or chemoradiation=5). Forty-three tumors (50.6%) were located in the right lung and 42 tumors (49.4%) were located in the left lung. Pathologic stage was IA in 22 patients (25.9%), IB in 30 patients (35.3%), IIA in three patients (3.5%), IIB in 9 patients (10.6%), IIIA in six patients (7.1%), IIIB in eight patients (9.4%), and IV in seven patients (8.2%). The tumor status was pT1 in 31 patients (36.5%), pT2 in 41 patients (48.2%), pT3 in 3 patients (3.5%). Ten patients (11.8%) had multiple tumor nodules in one lobe that were confirmed by pathologic examination of the lobectomy specimens and were therefore classified as pT4. Of 76 patients (89.4%) who had surgically resected lymph nodes, involvement by adenocarcinoma was present in 22 patients (29.8%) and absent in 54 patients (71.1%).
Histopathologic Characteristics of Lung Adenocarcinomas
The histologic characteristics of the lung adenocarcinomas included in this study are summarized in Table 2 and Table 3 and illustrated in Figure 3. The mean percentage of solid pattern present in evaluated carcinomas was 32.7 (95% confidence interval 24 to 41) (Table 2, Figure 3A). Mild cytologic atypia with relatively uniform nuclei and indistinct nucleoli was present in 27 (31.8%) adenocarcinomas; moderate atypia with relatively uniform nuclei and conspicuous nucleoli in 40 (47.1%) adenocarcinomas; and severe atypia with bizarre, enlarged nuclei of varied sizes in 18 (21.2%) adenocarcinomas (Figure 3B). Although cytologic atypia was correlated with percentage of solid pattern (P = 0.0002, Kruskal-Wallis test), a subset of adenocarcinomas had solid pattern and mild atypia or alternatively, severe atypia and absence of solid component (Figure 4). The average number of mitoses/10HPF was 8.6 (95% confidence interval 6.2 to 11) (Figure 3C).
TABLE 2.
Histopathologic Characteristics Evaluated in Lung Adenocarcinomas (N=85)
| Characteristic | Data Type | Mean Value | 95% Confidence Interval of Mean |
|---|---|---|---|
| Solid pattern | Percentage of tumor area | 32.7 | 24 - 41 |
| Cytologic atypia | Graded 1, 2, 3 | 1.9 | 1.7 - 2.1 |
| Mitoses | Number /10 HPF | 8.6 | 6.2 - 11.0 |
TABLE 3.
Histologic Subtypes and Dominant Histologic Pattern in Lung Adenocarcinomas (N=85)
| Histologic Subtype | Histologic Subtype No. of Patients (%)* |
Dominant Histologic Pattern No. of Patients (%) |
|---|---|---|
| Mixed Subtype | 72 (84.7) | NA |
| Acinar | 1 (1.2) | 27 (31.8) |
| Papillary | 2 (2.4) | 29 (34.1) |
| Solid | 10 (11.8) | 29 (34.1) |
| Bronchioloalveolar | 0 | 0 |
| Micropapillary | 0 | 0 |
Due to rounding, not all percentages total 100.
Figure 3.
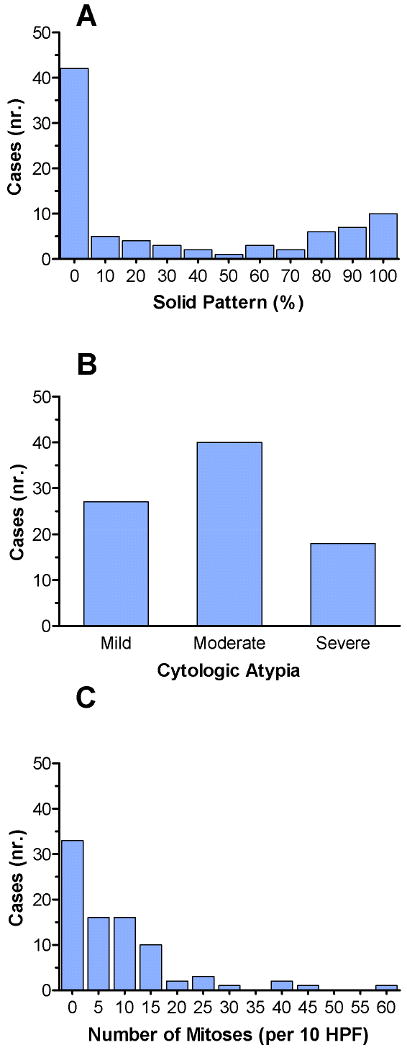
Distribution of cases based on the individual histologic characteristics. (A) There is a bimodal distribution of cases based on solid pattern, with the highest number of cases having either no solid component or entirely solid component. (B) Distribution of cases based on cytologic atypia. Twenty-seven cases (31.8%) had mild cytologic atypia, 40 cases (47.1%) had moderate cytologic atypia, and 18 cases (21.2%) had severe cytologic atypia. (C) Distribution of cases based on the number mitoses per 10 HPF. The mean number of mitoses/10 HPF was 8.6.
Figure 4.
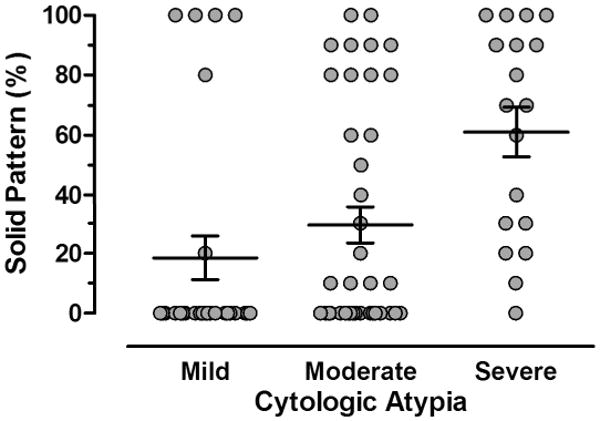
Scatter diagram illustrating the direct correlation between cytologic atypia and the amount of solid pattern (P=0.0002, Kruskal-Wallis test). However, a subset of adenocarcinomas has solid growth but low atypia or alternatively, severe atypia and a low solid growth component. Horizontal lines represent the mean values and whiskers the standard error of the mean.
Seventy-two (84.7%) adenocarcinomas were mixed subtype, one (1.2%) was acinar, two (2.4%) were papillary, and 10 (11.8%) were solid subtype. The dominant histologic pattern was acinar in 27 (31.8%) tumors, papillary in 29 (34.1%) tumors, and solid in 29 (34.1%) tumors.
Histopathologic Characteristics and Associations with Outcome
Table 4 and Figure 3 show the distribution of patients with lung adenocarcinoma according to the evaluated histopathologic features. The primary analysis in Table 4 is focused on the results using the cutoff values for each of the histopathologic features that were associated with the largest difference in overall survival. The cutoff values for percent solid pattern, cytologic atypia, and mitotic count were 90%, moderate atypia and 13 mitoses/10HPF, respectively (Table 4).
TABLE 4.
Univariate and Multivariate Analyses of Overall Survival in Relation to Studied Pathologic Characteristics (N=85)*
| Characteristic | Score | No. of Patients (%) | Median Survival (mo) | 95% CI of Median | P Univariate | P Multivariate |
|---|---|---|---|---|---|---|
| Solid pattern | 0.046 | 0.049 | ||||
| <90% | 1 | 68 (80.0) | 69.4 | (50.7 - 118.9) | ||
| ≥90% | 2 | 17 (20.0) | 21.6 | (6.8 - 77.2) | ||
| Cytologic atypia | 0.01 | 0.02 | ||||
| Mild/Moderate | 1 | 67 (78.8) | 71.0 | (50.7 - N/A) | ||
| Severe | 2 | 18 (21.2) | 30.5 | (18.2 - 50.7) | ||
| Mitoses | 0.26 | 0.57 | ||||
| ≤13 per HPF | 1 | 67 (78.8) | 69.4 | (49.4 - 118.9) | ||
| >13 per HPF | 2 | 18 (21.2) | 33.6 | (18.2 - N/A) |
HR denotes hazard ratio and CI denotes confidence interval.
Sixty-eight (80.0%) patients had lung adenocarcinomas with a solid pattern < 90%, and 17 (20.0%) had a solid component of ≥ 90% (Table 4). The median overall survival time was significantly better among patients with adenocarcinomas with a solid pattern < 90% (69.4 months) than it was among patients with adenocarcinomas with a solid pattern ≥ 90% (21.6 months) (P=0.046) (Table 4 and Figure 5A).
Figure 5.
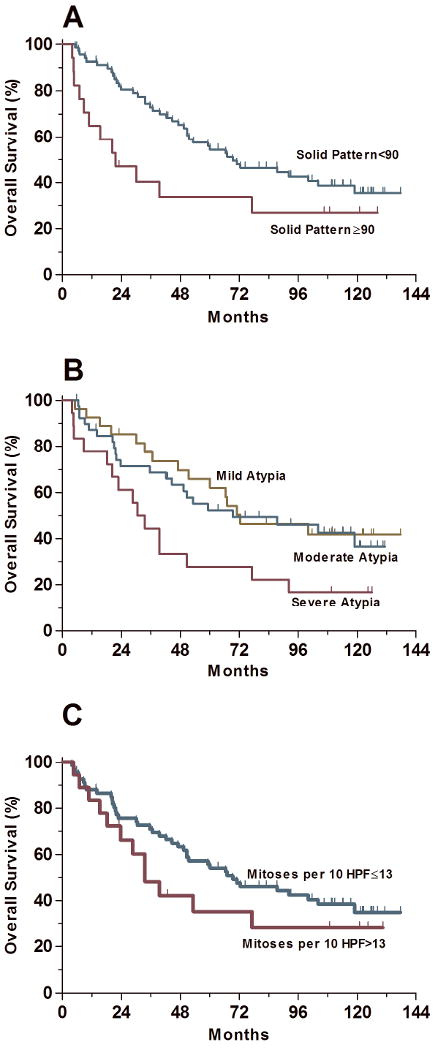
Survival analysis based on individual histologic parameters. (A) The overall survival was significantly better for patients with tumors with a solid growth <90% than for patients with tumors with >90% solid growth (P=0.046). Patients with tumors with a solid growth <90% had a median overall survival of 69.4 months and those with tumors with >90% solid growth had a median overall survival of 21.4 months. (B) The overall survival was significantly better for patients with tumors with mild/moderate cytologic atypia as compared with patients with tumors with severe atypia (P=0.01). The median overall survival was 71.0 months for patients with tumors with mild/moderate cytologic atypia and 30.5 months for patients with tumors with severe cytologic atypia. The overall survival was the same for patients with tumors with mild/moderate cytologic atypia (P=0.74). (C) The overall survival was not significantly different between patients with tumors with ≤13 mitoses/10 HPF and patients with >13 mitoses/10 HPF (P=0.26).
Sixty-seven (78.8%) adenocarcinomas had mild/moderate cytologic atypia, and 18 (21.2%) had severe cytologic atypia (Table 4). Although the outcome in patients with mild and moderate cytologic atypia in their carcinomas was similar (median overall survival times 72.4 and 69.4 months, respectively, P=0.74), the median overall survival was significantly worse among patients with adenocarcinomas with severe atypia (30.5 months) than it was among patients with adenocarcinomas with mild/moderate atypia (71.0 months, P=0.01) (Table 4 and Figure 5B).
The mitotic count was not predictive of outcome when we performed exploratory survival analyses using any incremental cutoff values. Sixty-seven (78.8%) adenocarcinomas had ≤ 13 mitoses/10HPF, and 18 (21.2%) had > 13 mitoses/10HPF (Table 4). Overall survival did not differ significantly between patients with lung adenocarcinomas with ≤ 13 or > 13 mitoses/10HPF (P=0.26) (Table 4 and Figure 5B).
Although both solid pattern and cytologic atypia were independent predictors of overall survival in multivariate analysis (P values 0.049 and 0.02, respectively), the mitotic count was not (P=0.57, Table 4).
Overall survival did not differ significantly between patients according to the dominant histologic pattern. The median overall survival time was 51.5 months for patients with tumors with dominant acinar pattern, 100.1 months for patients with tumors with dominant papillary pattern, and 39.5 months for patients with tumors with a dominant solid growth pattern (P=0.22).
Grading of Lung Adenocarcinomas
Based on our previous analyses, we incorporated the two histopathologic characteristics that had prognostic significance by statistical criteria, the percentage of solid pattern as a reflection of tumor architecture and the degree of cytologic atypia into a grading system. We assigned a score for each characteristic based on the optimal cutoff values (Table 4). Based on architecture, tumors were scored 1 if the solid pattern was <90% or 2 if the solid pattern was ≥ 90% of the tumor surface area. Adenocarcinomas were scored 1 if cells had mild/moderate atypia or 2 if cells had severe atypia. Because the mitotic count was not predictive of outcome, it was not incorporated into the scoring system (Table 4). For each case, a grading score was computed as the sum of the two parameter scores. Based on this grading scheme, lung adenocarcinomas were classified as well differentiated (score 2 - solid pattern< 90% and mild/moderate atypia), moderately differentiated (score 3 - solid pattern ≥ 90% and mild/moderate atypia; or solid pattern< 90% and severe atypia) and poorly differentiated (score 4 - solid pattern ≥ 90% and severe atypia). Fifty-seven (67.1%) adenocarcinomas were well-differentiated, 21 (24.7%) were moderately-differentiated, and seven (8.2%) were poorly differentiated (Table 5A). While higher tumor grade was associated with higher tumor status (P=0.004, Table 5A), we found no association between grading and node status (P=0.48, Table 5B).
TABLE 5.
| TABLE 5A. Relationship between Tumor Grade and Tumor Status (N=85)* | ||||
|---|---|---|---|---|
| Differentiation No. of Patients (%) |
||||
| Tumor Status | Well | Moderate | Poor | Total |
| pT1 | 25 (43.9) | 4 (19.0) | 2 (28.6) | 31 (36.5) |
| pT2 | 25 (43.9) | 13 (61.9) | 3 (42.9) | 41 (48.2) |
| pT3 | 0 (0) | 1 (4.8) | 2 (28.6) | 3 (3.5) |
| pT4 | 7(12.3) | 3 (14.3) | 0 (0) | 10 (11.8) |
| Total | 57 (100) | 21 (100) | 7 (100) | 85 (100) |
| Table 5B. Relationship between Tumor Grade and Node Status (N=76)* | ||||
|
Differentiation No. of Patients (%) |
||||
| Node Status† | Well | Moderate | Poor | Total |
| Negative | 37 (75.5) | 13 (65.0) | 4 (57.1) | 54 (71.1) |
| Positive | 12 (24.5) | 7 (35.0) | 3 (42.9) | 22 (29.0) |
| Total | 49 (100) | 20 (100) | 7 (100) | 76 (100) |
P=0.004 (Chi-Square test) for comparison of tumor grade and tumor status.
P=0.48 (Chi-Square test) for comparison of tumor grade and tumor status.
76 patients had surgically resected lymph nodes.
Survival Analysis
The median potential follow-up time using censored data was 111 months. The median overall survival was 66.4 months.
As previously reported,21, 22 women and age less than 70 years were prognostic indicators for better overall survival (P values 0.045 and 0.0008, respectively) (Table 6). In addition, tumor and node status3 (pT and pN) when analyzed separately were also prognostic indicators (P values <0.0001 and 0.02, respectively) (Table 6). Although not significant, outcome was better in patients with no metastases (median survival 67.1 vs 21.1 months, P = 0.053). As expected, advanced stage patients were treated with adjuvant therapy and had worse outcome (Table 6, P=0.002).
TABLE 6.
Univariate Analysis of Overall Survival in Patients with Lung Adenocarcinoma (N=85)*
| Characteristic | No. of Patients (%) | Median Survival (mo) | 95% Confidence Interval of Median | P |
|---|---|---|---|---|
| Sex | 0.045 | |||
| Female | 54 (63.5) | 72.4 | (49.4 - N/A) | |
| Male | 31 (36.5) | 33.6 | (21.9 - 87.5) | |
| Age - yr | 0.0008 | |||
| < 70 | 50 (58.8) | 104.1 | (53.2 - N/A) | |
| ≥ 70 | 35 (41.2) | 39.5 | (22.8 - 60.1) | |
| Smoking status** | 0.83 | |||
| Nonsmoker | 11 (14.7) | 71.0 | (5.2 - N/A) | |
| Smoker | 64 (85.4) | 66.4 | (44.6 - 100.1) | |
| Resection type | 0.78 | |||
| Wedge resection | 26 (30.6) | 71.0 | (55.7 -118.9) | |
| Lobectomy/ Pneumonectomy | 59 (69.4) | 50.7 | (30.5 -100.1) | |
| Treatment sequence | 0.002 | |||
| Surgery alone | 60 (70.6) | 87.5 | (53.3 - N/A) | |
| Surgery plus adjuvant therapy | 25 (29.4) | 23.6 | (20.3 - 49.4) | |
| Tumor location | 0.47 | |||
| Right | 43 (50.6) | 67.1 | (50.7 - N/A) | |
| Left | 42 (49.4) | 49.4 | (23.6 -104.1) | |
| Tumor status | <0.0001 | |||
| pT1 | 31 (36.5) | 87.5 | (53.2 - N/A) | |
| pT2 | 41 (48.2) | 71.0 | (33.6 - N/A) | |
| pT3 | 3 (3.5) | 20.3 | (4.7 - N/A) | |
| pT4 | 10 (11.8) | 14.0 | (6.9 - 42.2) | |
| Node status† | 0.02 | |||
| Negative | 54 (71.1) | 92.3 | (50.7 - N/A) | |
| Positive | 22 (29.8) | 28.6 | (14.0 - 66.4) | |
| Metastasis status | 0.053 | |||
| Negative | 77 (90.6) | 67.1 | (47.1 - 104.1) | |
| Positive | 8 (9.4) | 21.1 | (4.7 - 77.3) | |
| Tumor grade | 0.0001 | |||
| Well-differentiated | 57 (67.1) | 72.4 | (51.5 - N/A) | |
| Moderately-differentiated | 21 (24.7) | 39.5 | (22.8 - N/A) | |
| Poorly-differentiated | 7 (8.2) | 8.7 | (3.9 - 39.5) |
Due to rounding, not all percentages total 100.
Smoking status was known in 75 patients.
76 patients had surgically resected lymph nodes.
Univariate analysis (Table 6) showed no significant differences in overall survival between smokers and never-smokers (P=0.83), between different surgical approaches (P=0.78), and tumor location (P=0.47) (Table 6).
The median overall survival time was 72.4 months for patients with well differentiated lung adenocarcinomas, 39.5 months for patients with moderately differentiated adenocarcinomas, and 8.7 months for patients with poorly differentiated adenocarcinomas (P<0.0001, Table 6, Figure 6).
Figure 6.
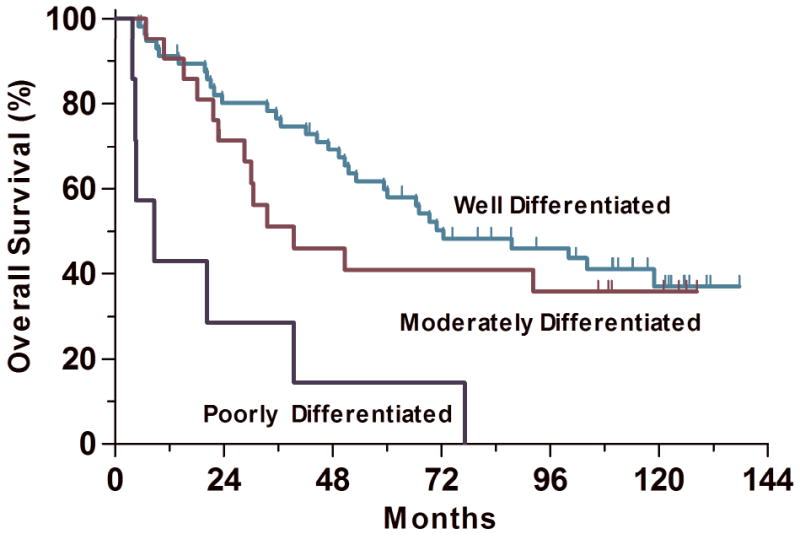
Grading score, computed as the sum of the architecture score and cytologic atypia score was a significant predictor of overall survival in univariate analysis (P=0.0001). The median overall survival times were 72.4, 39.5, and 8.7 months for well, moderately and poorly differentiated adenocarcinoma, respectively.
After adjusting for significant variables, we found that both pathologic tumor and metastasis status (P=0.001 and P=0.008, respectively) and tumor grading (P=0.002) were independent predictors of overall survival (Table 7). Better overall survival was also predicted by younger age (P=0.0004), but not by treatment sequence (P=0.28, Table 7).
TABLE 7.
Multivariate Analysis of Overall Survival in Relation to Clinicopathologic Characteristics (N=85)*
| Characteristic | HR (95% CI) | P |
|---|---|---|
| Sex | 0.12 | |
| Female | 1.00 reference | |
| Male | 1.66 (0.88 – 3.13) | |
| Age | <0.0001 | |
| < 70 | 1.00 reference | |
| ≥ 70 | 4.18 (1.08 – 8.38) | |
| Treatment sequence | 0.28 | |
| Surgery alone | 1.00 reference | |
| Surgery plus adjuvant therapy | 1.60 (0.69 – 3.72) | |
| Tumor status | 0.001 | |
| pT1 and pT2 | 1.00 reference | |
| pT3 and pT4 | 4.61 (1.92 – 11.08) | |
| Node status** | 0.05 | |
| Negative | 1.00 reference | |
| Positive | 2.18 (0.99 – 4.78) | |
| Metastasis status | 0.008 | |
| Negative | 1.00 reference | |
| Positive | 3.75 (1.41 – 9.93) | |
| Tumor grade | 0.002 | |
| Well differentiated | 1.00 reference | |
| Moderately differentiated | 1.25 (0.57 – 2.74) | 0.57 |
| Poorly differentiated | 5.80 (2.27 – 14.82) | <0.0001 |
HR denotes hazard ratio and CI denotes confidence interval.
76 patients had surgically resected lymph nodes.
Discussion
Although grading is a standard component of pathology reports for lung adenocarcinoma and is generally considered predictive of outcome, a prognostically significant grading system based on objective criteria has not been established for lung adenocarcinoma. The aim of this study was to evaluate the prognostic value of histologic parameters of tumor grading to develop a prognostically significant grading system for lung adenocarcinoma.
In our study we found several clinical and pathologic factors that were prognostically significant for patients with lung adenocarcinoma. Consistent with previous studies, we found that stage is the most significant prognostic factor in both univariate and multivariate analysis3 and that older age is also a negative prognostic factor23. We also found that the extent of solid pattern and the degree of cytologic atypia were both associated significantly with outcome (P=0.046 and 0.01), whereas the number of mitoses was not (P=0.26). Patients with lung adenocarcinomas with < 90% solid pattern had a median overall survival of 69.4 months, and those with adenocarcinomas with ≥ 90% solid pattern had a median overall survival of 21.6 months (P=0.046). The median overall survival was 71 months for patients with tumors with mild/moderate cytologic atypia and 30.5 months for patients with tumors with severe cytologic atypia (P=0.01). We found that the number of mitoses was not prognostically significant, contrary to previous reports.14, 24 However, the results of our study are consistent with findings reported in previous studies showing that the presence of solid growth and increased cytologic atypia are predictive of a worse outcome in patient with lung adenocarcinoma.12, 15, 20, 24
A grading score, computed as the sum of the architecture score and cytologic atypia score, was a significant predictor of overall survival in both univariate and multivariate analyses (P=0.0001 and P=0.002, respectively). The median overall survival time was 72.4 months for patients with well differentiated lung adenocarcinomas, 39.5 months for patients with moderately differentiated adenocarcinomas, and 8.7 months for patients with poorly differentiated adenocarcinomas (P<0.0001, Table 6, Figure 5). In the study cited by the WHO demonstrating the prognostic significance of grading in lung adenocarcinoma by Chung et al. 13 well differentiated adenocarcinomas were defined as tumors with well-formed glands, tubules, or acini composed of cuboidal cells with mildly pleomorphic, often vesicular, nuclei. Moderately differentiated adenocarcinomas were defined as tumors with solid and glandular growth composed of cells with moderately pleomorphic nuclei, moderately-sized nucleoli, and a higher nuclear:cytoplasmic ratio. Poorly differentiated adenocarcinomas were defined as tumors formed almost entirely of solid nests or cords of cells with very pleomorphic nuclei, frequently with prominent nucleoli, and variable amount of cytoplasm. The study found that patients with poorly differentiated tumors had more lymph node metastases, a worse 2-year overall survival, and more frequent local recurrences, similar with the findings of our study. Our grading system differs from that outlined by Chung et al, in that we found that tumors with up to 80% solid growth were best classified as well differentiated.
We found that the main difference in overall survival was between patients with poorly differentiated tumors and well or moderately differentiated tumors. It is possible that other clinicopathologic factors could be responsible for the interaction observed between well or moderately differentiated tumors, since the effect is not independent in the multivariate analysis. However, additional larger studies are needed to determine, if there is in fact a difference in survival between patients with well and moderately differentiated tumors, or if these two groups should be combined, creating a two-tiered grading system.
Additional histologic factors are important in evaluating lung adenocarcinomas. For example, while a tumor with a micropapillary component may not have high grade features based on our grading system, the presence of a micropapillary component has been shown to confer a worse prognosis.25, 26 While we did not find that the dominant histologic pattern was prognostically significant, our analysis of dominant pattern was limited due to absent bronchioloalveolar and micropapillary subtypes in our cohort. Therefore, it is important to document the subtypes of adenocarcinoma present in surgical pathology reports since the subtype has been shown to correlate with molecular abnormalities that predict response to targeted therapies.12, 27, 28 The reduced number of patients and absence of progression-free survival (PFS) as an alternative end point are limitations of our study and the results should be validated in larger cohorts, assessing the impact of grading characteristics on both progression-free and overall survival as study end points.
In conclusion, we have described a prognostically significant grading system for lung adenocarcinoma that incorporates the percentage of solid growth pattern and the degree of cytologic atypia. Although the cutoff values for each histologic parameter assessed are well-defined and the overall grading score is relatively straight-forward, additional larger studies are needed to evaluate interobserver reproducibility and to prove its efficacy. Based on our findings, additional studies are warranted to determine if a classification algorithm that includes tumor grading can contribute to stratification of patients for clinical trials and identify a subset of patients with lung adenocarcinomas who should be treated with aggressive treatment strategies.
Acknowledgments
This study was supported by Specialized Programs of Research Excellence (SPORE) grant in Lung Cancer CA090578 from the National Cancer Institute and by W81XWH06-1-0303 from the Department of Defense. We are indebted to Ms. Brittany Macfarland for secretarial support.
References
- 1.Jemal A, Siegel R, Ward E, Murray T, Xu J, Thun MJ. Cancer statistics, 2007. CA Cancer J Clin. 2007;57(1):43–66. doi: 10.3322/canjclin.57.1.43. [DOI] [PubMed] [Google Scholar]
- 2.Alberg AJ, Ford JG, Samet JM. Epidemiology of lung cancer: ACCP evidence-based clinical practice guidelines (2nd edition) Chest. 2007;132(3 Suppl):29S–55S. doi: 10.1378/chest.07-1347. [DOI] [PubMed] [Google Scholar]
- 3.Greene FL, Page DL, Fleming ID, Fritz A, Balch CM, Haller DG, et al. AJCC cancer staging manual. New York, NY: Springer; 2002. pp. 91–8. [Google Scholar]
- 4.Mountain CF. Revisions in the International System for Staging Lung Cancer. Chest. 1997;111(6):1710–7. doi: 10.1378/chest.111.6.1710. [DOI] [PubMed] [Google Scholar]
- 5.Detterbeck FC. Lumping, splitting, and sorting. J Thorac Oncol. 2007;2(7):581–2. doi: 10.1097/JTO.0b013e31807a2fae. [DOI] [PubMed] [Google Scholar]
- 6.Amin MB, Paner GP, Alvarado-Cabrero I, Young AN, Stricker HJ, Lyles RH, et al. Chromophobe renal cell carcinoma: histomorphologic characteristics and evaluation of conventional pathologic prognostic parameters in 145 cases. Am J Surg Pathol. 2008;32(12):1822–34. doi: 10.1097/PAS.0b013e3181831e68. [DOI] [PubMed] [Google Scholar]
- 7.Henson DE, Ries L, Freedman LS, Carriaga M. Relationship among outcome, stage of disease, and histologic grade for 22,616 cases of breast cancer. The basis for a prognostic index. Cancer. 1991;68(10):2142–9. doi: 10.1002/1097-0142(19911115)68:10<2142::aid-cncr2820681010>3.0.co;2-d. [DOI] [PubMed] [Google Scholar]
- 8.Robbins P, Pinder S, de Klerk N, Dawkins H, Harvey J, Sterrett G, et al. Histological grading of breast carcinomas: a study of interobserver agreement. Hum Pathol. 1995;26(8):873–9. doi: 10.1016/0046-8177(95)90010-1. [DOI] [PubMed] [Google Scholar]
- 9.Murphy GP, Busch C, Abrahamsson PA, Epstein JI, McNeal JE, Miller GJ, et al. Histopathology of localized prostate cancer. Consensus Conference on Diagnosis and Prognostic Parameters in Localized Prostate Cancer. Stockholm, Sweden, May 12-13, 1993. Scand J Urol Nephrol Suppl. 1994;162:7–42. discussion 115-27. [PubMed] [Google Scholar]
- 10.Fuhrman SA, Lasky LC, Limas C. Prognostic significance of morphologic parameters in renal cell carcinoma. Am J Surg Pathol. 1982;6(7):655–63. doi: 10.1097/00000478-198210000-00007. [DOI] [PubMed] [Google Scholar]
- 11.Travis WD, World Health Organization., International Agency for Research on Cancer., International Association for the Study of Lung Cancer., International Academy of Pathology . Pathology and genetics of tumours of the lung, pleura, thymus and heart. Lyon: IARC Press; 2004. [Google Scholar]
- 12.Motoi N, Szoke J, Riely GJ, Seshan VE, Kris MG, Rusch VW, et al. Lung adenocarcinoma: modification of the 2004 WHO mixed subtype to include the major histologic subtype suggests correlations between papillary and micropapillary adenocarcinoma subtypes, EGFR mutations and gene expression analysis. Am J Surg Pathol. 2008;32(6):810–27. doi: 10.1097/PAS.0b013e31815cb162. [DOI] [PubMed] [Google Scholar]
- 13.Chung CK, Zaino R, Stryker JA, O'Neill M, Jr, DeMuth WE., Jr Carcinoma of the lung: evaluation of histological grade and factors influencing prognosis. Ann Thorac Surg. 1982;33(6):599–604. doi: 10.1016/s0003-4975(10)60819-3. [DOI] [PubMed] [Google Scholar]
- 14.Takise A, Kodama T, Shimosato Y, Watanabe S, Suemasu K. Histopathologic prognostic factors in adenocarcinomas of the peripheral lung less than 2 cm in diameter. Cancer. 1988;61(10):2083–8. doi: 10.1002/1097-0142(19880515)61:10<2083::aid-cncr2820611025>3.0.co;2-u. [DOI] [PubMed] [Google Scholar]
- 15.Petersen I, Kotb WF, Friedrich KH, Schluns K, Bocking A, Dietel M. Core classification of lung cancer: Correlating nuclear size and mitoses with ploidy and clinicopathological parameters. Lung Cancer. 2009 doi: 10.1016/j.lungcan.2008.12.013. In Press. [DOI] [PubMed] [Google Scholar]
- 16.Kobayashi N, Toyooka S, Soh J, Ichimura K, Yanai H, Suehisa H, et al. Risk factors for recurrence and unfavorable prognosis in patients with stage I non-small cell lung cancer and a tumor diameter of 20 mm or less. J Thorac Oncol. 2007;2(9):808–12. doi: 10.1097/JTO.0b013e31814617c7. [DOI] [PubMed] [Google Scholar]
- 17.Nascimento AF, Raut CP, Fletcher CD. Primary angiosarcoma of the breast: clinicopathologic analysis of 49 cases, suggesting that grade is not prognostic. Am J Surg Pathol. 2008;32(12):1896–904. doi: 10.1097/PAS.0b013e318176dbc7. [DOI] [PubMed] [Google Scholar]
- 18.Cho S, Sung SW, Jheon S, Chung JH. Risk of recurrence in surgically resected stage I adenocarcinoma of the lung: histopathologic and immunohistochemical analysis. Lung. 2008;186(6):411–9. doi: 10.1007/s00408-008-9116-4. [DOI] [PubMed] [Google Scholar]
- 19.Lester SC. Manual of surgical pathology. 2nd. Edinburgh; New York: Elsevier Churchill Livingstone; 2006. [Google Scholar]
- 20.Riquet M, Foucault C, Berna P, Assouad J, Dujon A, Danel C. Prognostic value of histology in resected lung cancer with emphasis on the relevance of the adenocarcinoma subtyping. Ann Thorac Surg. 2006;81(6):1988–95. doi: 10.1016/j.athoracsur.2006.01.021. [DOI] [PubMed] [Google Scholar]
- 21.Jemal A, Thun MJ, Ries LAG, Howe HL, Weir HK, Center MM, et al. Annual Report to the Nation on the Status of Cancer, 1975-2005, Featuring Trends in Lung Cancer, Tobacco Use, and Tobacco Control. J Natl Cancer Inst. 2008;100(23):1672–94. doi: 10.1093/jnci/djn389. [DOI] [PMC free article] [PubMed] [Google Scholar]
- 22.Yabroff KR, Bradley CJ, Mariotto AB, Brown ML, Feuer EJ. Estimates and Projections of Value of Life Lost From Cancer Deaths in the United States. J Natl Cancer Inst. 2008:djn383. doi: 10.1093/jnci/djn383. [DOI] [PMC free article] [PubMed] [Google Scholar]
- 23.Radzikowska E, Glaz P, Roszkowski K. Lung cancer in women: age, smoking, histology, performance status, stage, initial treatment and survival. Population-based study of 20 561 cases. Ann Oncol. 2002;13(7):1087–93. doi: 10.1093/annonc/mdf187. [DOI] [PubMed] [Google Scholar]
- 24.Kurokawa T, Matsuno Y, Noguchi M, Mizuno S, Shimosato Y. Surgically curable “early” adenocarcinoma in the periphery of the lung. Am J Surg Pathol. 1994;18(5):431–8. doi: 10.1097/00000478-199405000-00001. [DOI] [PubMed] [Google Scholar]
- 25.Amin MB, Tamboli P, Merchant SH, Ordonez NG, Ro J, Ayala AG, et al. Micropapillary component in lung adenocarcinoma: a distinctive histologic feature with possible prognostic significance. Am J Surg Pathol. 2002;26(3):358–64. doi: 10.1097/00000478-200203000-00010. [DOI] [PubMed] [Google Scholar]
- 26.Miyoshi T, Satoh Y, Okumura S, Nakagawa K, Shirakusa T, Tsuchiya E, et al. Early-stage lung adenocarcinomas with a micropapillary pattern, a distinct pathologic marker for a significantly poor prognosis. Am J Surg Pathol. 2003;27(1):101–9. doi: 10.1097/00000478-200301000-00011. [DOI] [PubMed] [Google Scholar]
- 27.Ohtsuka K, Ohnishi H, Furuyashiki G, Nogami H, Koshiishi Y, Ooide A, et al. Clinico-pathological and biological significance of tyrosine kinase domain gene mutations and overexpression of epidermal growth factor receptor for lung adenocarcinoma. J Thorac Oncol. 2006;1(8):787–95. [PubMed] [Google Scholar]
- 28.Kim YH, Ishii G, Goto K, Nagai K, Tsuta K, Shiono S, et al. Dominant papillary subtype is a significant predictor of the response to gefitinib in adenocarcinoma of the lung. Clin Cancer Res. 2004;10(21):7311–7. doi: 10.1158/1078-0432.CCR-04-0811. [DOI] [PubMed] [Google Scholar]