

Abstract
RNAs have diverse structures that are important for biological function. These structures include bulges and internal loops that can form tertiary contacts or serve as ligand binding sites. The most commonly exploited RNA drug target for small molecule intervention is the bacterial ribosome, more specifically the ribosomal RNA aminoacyl-tRNA site (rRNA A-site) which is a major target for the aminoglycoside class of antibiotics. The bacterial A-site is composed of a 1×1 nucleotide all-U internal loop and a 2×1 nucleotide all-A internal loop separated by a single GC base pair. Therefore, we probed the molecular recognition of a small library of four aminoglycosides for binding a 16384-member bacterial rRNA A-site-like internal loop library using Two-Dimensional Combinatorial Screening (2DCS). 2DCS is a microarray-based method that probes RNA and chemical spaces simultaneously. These studies sought to determine if aminoglycosides select their therapeutic target if given a choice of binding all possible internal loops derived from an A-site-like library. Results show that the bacterial rRNA A-site was not selected by any aminoglycoside. Analyses of selected sequences using the RNA Privileged Space Predictor (RNA-PSP) program show that each aminoglycoside preferentially binds different types of internal loops. For three of the aminoglycosides, 6″-azido-kanamycin A, 5-O-(2-azidoethyl) neamine, and 6″-azido-tobramycin, the selected internal loops bind with ~10-fold higher affinity than the bacterial rRNA A-site. The internal loops selected to bind 5″-azido-neomycin B bind with similar affinity as the therapeutic target. Selected internal loops that are unique for each aminoglycoside have dissociation constants ranging from 25 to 270 nM and are specific for the aminoglycoside they were selected to bind compared to the other arrayed aminoglycosides. These studies further establish a database of RNA motifs that are recognized by small molecules that could be used to enable the rational and modular design of small molecules targeting RNA.
Most cellular RNAs are single stranded and fold back onto themselves to minimize their free energy. This provides RNA with structural diversity, forming a variety of motifs such as bulges, internal loops, hairpin loops, and multibranch loops. These individual motifs in RNA often dictate the function of the larger biomolecule. For example, a hairpin loop and an internal loop form the tetraloop receptor in group I and group II introns (1-3). Deletion of these structures impairs self-splicing (1-3). Riboswitches are another functionally important class of RNAs whose structure dictates function. These RNAs alter their structures in response to the concentration of metabolites to either stimulate or repress translation of mRNAs that contain these switches (4). Several small molecules have been found to “short circuit” riboswitch function in bacteria and are serving as promising new leads for the development of antibacterial agents (5).
Despite its importance in biology, RNA is underexplored as drug target. One barrier to targeting RNA is the limited information available on RNA-ligand interactions. Currently ribosomal RNA (rRNA) is the most studied and perhaps the most biologically significant RNA target for small molecules (6). The aminoacyl-tRNA site (A-site) of the bacterial ribosome, which is located in the 16S rRNA of the 30S subunit, is the primary target of the aminoglycoside class of antibiotics (7). This region is involved in the recognition of cognate tRNAs and is critical to maintain fidelity in translation (8). A series of hydrogen bonding interactions in the A-site help stabilize the binding of an mRNA codon with the cognate tRNA anticodon (7, 9, 10).
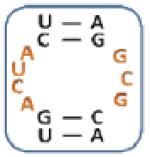
The bacterial A-site is composed of a 1×1 nucleotide all-U internal loop separated by one GC pair from a 2×1 nucleotide all-A internal loop. The antibacterial activity of aminoglycosides is directly attributed to their effects on the recognition of cognate and non-cognate tRNAs in the ribosome (8, 11). Aminoglycoside binding to the A-site leads to indiscriminant recognition of cognate and non-cognate tRNAs. This results in mis-translation of proteins and slowed bacterial growth. Crystal and NMR structures of various aminoglycoside antibiotics complexed with oligonucleotide mimics of the A-site or the whole ribosome show specific hydrogen bonds are formed between the hydroxyl and amino groups of aminoglycosides and the RNA (12-15). Other studies have investigated aminoglycosides binding to other RNA motifs (16-18), but none have attempted to select an oligonucleotide mimic of the bacterial A-site from a mixture of A-site-like structures (1, Figure 1).
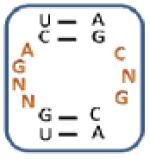
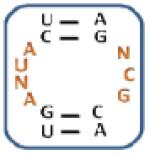
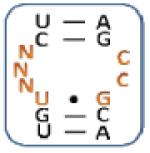
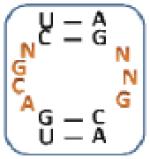
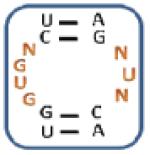
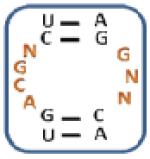
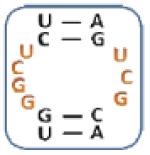
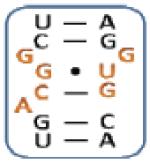
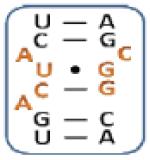
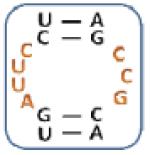
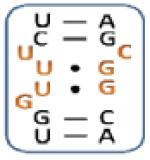
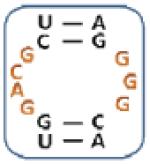
Figure 1.

Secondary structures of the oligonucleotides used in this study. 1 is the 4×3 nucleotide asymmetric internal loop library, where N represents an equimolar mixture of A, C, G, and U. RNA 2 is an oligonucleotide mimic of the bacterial A-site. Oligonucleotides 3-9 are used to compete off interactions to the regions in 1 that are common to all library members.
In order to identify the A-site-like RNAs that bind to four aminoglycoside derivatives, we used Two-Dimensional Combinatorial Screening (2DCS) coupled with the RNA Privileged Space Predictor (RNA-PSP) program. This approach rapidly identifies the specific, privileged RNA space for multiple ligands simultaneously by probing RNA and chemical spaces in parallel (16). Results showed that aminoglycosides do not select their therapeutic target if given a choice. In fact, three of the aminoglycosides prefer RNAs with other predicted structures including 4×3 nucleotide internal loops, 3×2 nucleotide internal loops, and 1×1 nucleotide internal loops separated by two base pairs from a 1-nucleotide bulge. This study defines the A-site-like internal loops that are recognized by aminoglycosides and also expands the database of known RNA motif-ligand interactions that can be used to rationally design modularly assembled small molecules that target RNA (19, 20).
Materials and Methods
Azido-Aminoglycosides
All azido-aminoglycosides and the corresponding fluorescein labeled derivatives were synthesized as previously described (16).
Construction of Alkyne-Functionalized Microarrays
Microarrays were constructed as previously described (21, 22). Briefly, agarose coated slides were prepared by applying ~2 mL of a 1% agarose solution to Silane-Prep slides (Sigma-Aldrich Co., St. Louis. MO). After the agarose dried to a thin film at room temperature, the slides were submerged in a 20 mM aqueous solution of NaIO4 solution for 30 min (23). Oxidized agarose slides were then washed with water (3 × 5 min). To display alkynes on the surface, the slides were then reacted with 20 mM propargylamine in 0.1 M NaHCO3 overnight. The resulting imine was reduced with a solution of 4:1 1X phosphate-buffered saline (PBS) : ethanol containing 32 mM NaCNBH3 for 3 min at room temperature. The remaining periodate was quenched by submerging slides in 10% aqueous ethylene glycol for 1.5 h at room temperature. Slides were then washed with 0.1% sodium dodecyl sulfate (SDS, 3 × 5 min) and water (5 × 5 min), and allowed to dry to a thin film at room temperature.
Construction of Azido-aminoglycoside Microarrays
Azido-aminoglycosides were immobilized onto the alkyne-functionalized agarose surface via a Huisgen 1, 3 dipolar cycloaddition reaction (21, 22, 24-26). Serial dilutions of azido-aminoglycoside were mixed with 1X Spotting Solution (10 mM Tris-HCl, pH 8.5, 1 mM CuSO4, 1 mM Vitamin C, 100 μM TBTA (26) and 10% glycerol). A 200 nL aliquot of each serial dilution was then spotted onto the surface (five 1:5 dilutions beginning with 5 mM azido-aminoglycoside). A negative control for non-specific binding of RNA to the slide surface was generated by delivering 200 nL of 1X Spotting Solution to the slide surface. The spotted microarray was placed in a humidity chamber for 3 h. The array was then washed three times (5 min each) with 1X Hybridization Buffer [HB1; 20 mM HEPES, pH 7.5, 150 mM NaCl, and 5 mM KCl] and then with water (3 × 5 min). The arrays were left to dry to a thin film on the benchtop before use.
General Nucleic Acids
All DNA oligonucleotides were purchased from Integrated DNA Technologies Inc. (IDT, Coralville, IA) and used without further purification. The RNA competitor oligonucleotides were purchased from Dharmacon (Lafayette, CO) and deprotected according to the manufacturer's standard procedure. All aqueous solutions were made with NANOpure water.
RNA Library and Competitor Oligonucleotides
The RNA library (1, Figure 1) displays a 4×3 nucleotide internal loop pattern with closing GC base pairs embedded in a hairpin cassette (27). We chose this pattern since it mimics the bacterial A-site (2, Figure 1). Library 1 was synthesized by in vitro transcription from the corresponding DNA template that was custom-mixed at the randomized positions to ensure equivalent representation of all four nucleotides.
RNA Transcription and Purification
RNA oligonucleotides were transcribed using an RNAMaxx transcription kit (Stratagene) according to the manufacturer's protocol using 12.5 μL of the amplified DNA template from a PCR reaction described below or 1 pmole of DNA template purchased from IDT. After transcription, 1 unit of DNase I (Invitrogen, Carlsbad, CA) was added, and the sample was incubated for additional 30 min at 37 °C. Transcribed RNAs were then purified by gel electrophoresis on a denaturing 15% polyacrylamide gel. The RNAs were visualized by UV shadowing and extracted into 300 mM NaCl by tumbling overnight at 4 °C. The resulting solution was concentrated with 2-butanol, and the RNA was ethanol precipitated. The RNAs were resuspended in 150 μL of NANOpure water, and the concentrations were determined by the absorbance at 260 nm and the corresponding extinction coefficient. Oligonucleotide extinction coefficients were determined using HyTher version 1.0 (Nicolas Peyret and John SantaLucia Jr., Wayne State University, Detroit, MI) (28, 29). These parameters were calculated from information on the extinction coefficients of nearest neighbors in RNA (30).
The A-site-like library (1) was radioactively labeled by run-off transcription using half the concentration of cold ATP per the manufacturer's protocol and 10 μL of [α-32P]ATP (3000 Ci/mol; PerkinElmer, Waltham, MA).
RNA Selection
Radioactively labeled internal loop library (1, 50 pmol) and competitor oligonucleotides (3-9, 50 nmol each; Figure 1) were annealed separately in 1X HB1 at 60 °C for 5 min and allowed to slowly cool on the benchtop. MgCl2 was then added to a final concentration of 1 mM. Annealed RNAs were mixed together in a total volume of 400 μL. Azido-aminoglycoside microarrays were pre-equilibrated with 1X HB1 supplemented with 1 mM MgCl2 and 40 μg/mL bovine serum albumin (BSA) [HB2] for 5 min at room temperature to prevent non-specific binding. After the slides were pre-equilibrated, the annealed RNAs were pipetted onto the slide and evenly distributed across the slide surface with a custom-cut sheet of Parafilm. Slides were hybridized at 37 °C for 30 min. After the 30 min hybridization period, the slides were washed by submersion in 30 mL of HB2 for 30 min with gentle agitation. This step was repeated three times. Excess buffer was removed from the slide surface, and the slides were left on the benchtop to dry.
The arrays were exposed to a phosphorimager screen and imaged using a Bio-Rad FX phosphorimager. The image was used as a template to identify spots that bound RNA and to mechanically remove them from the surface. A 200 nL aliquot of NANOpure water was added to the spot to be excised. After 30 s, excess water was pipetted from the surface (most is absorbed), and the gel at that position was excised.
Reverse Transcription – Polymerase Chain Reaction (RT-PCR) Amplification
The agarose containing bound RNAs was placed into a thin-walled PCR tube with 16 μL of H2O, 2 μL of 10X RQ DNase I Buffer, and 2 units of RQ DNase I (Promega, Madison, WI). The tube was vortexed, centrifuged for 4 min at 8000 × g, and then incubated at 37 °C for 2 h. The reaction was quenched by addition of 2 μL of 10X DNase Stop Solution (Promega, Madison, WI), and the sample was incubated at 65 °C for 10 min to inactivate the DNase. This solution was used for reverse transcription-polymerase chain reaction (RT-PCR) amplification. Reverse transcription reactions were completed in 1X RT buffer (supplied by the manufacturer), 1 mM dNTPs, 5 μM RT primer (5′-d(CCTTGCGGATCCAAT)), 200 μg/mL BSA, 3.5 units of reverse transcriptase (Life Sciences, Inc., St. Petersburg, FL), and 20 μL of the selected RNAs treated with DNase I. The reaction was incubated at 60 °C for 1 h. To 20 μL of the RT reaction were added 6 μL of 10X PCR buffer (1X PCR buffer is 10 mM Tris-HCl, pH 9.0, 50 mM KCl, and 0.1% Triton X-100), 4 μL of 100 μM PCR primer (5′-d(GGCCGGATCCTAATACGACTCACTATAGGGAGAGGGTTTAAT)), 2 μL of 100 μM RT primer, 0.6 μL of 250 mM MgCl2, and 0.1 μL of Taq DNA polymerase. PCR cycling conditions (2-steps) were 95 °C for 1 min and 72 °C for 1 min (27). Aliquots of the RT-PCR reactions were checked every five cycles starting at cycle 25 on a denaturing 15% polyacrylamide gel stained with ethidium bromide or SYBR Gold (Invitrogen, Carlsbad, CA).
Cloning and Sequencing
The RT-PCR products were then digested with BamHI and EcoRI restriction enzymes and cloned into the corresponding site of the pUC19 vector. Sequencing was completed by Functional Biosciences, Inc. (Madison, WI).
PCR Amplification of DNA Templates Encoding Selected RNAs
The DNA templates encoding the selected RNAs were PCR amplified from the harvested plasmid DNA (Eppendorf Fast Plasmid Mini kit) in 50 μL of 1X PCR buffer, 4.25 mM MgCl2, 0.33 mM dNTPs, 2 μM each primer (RT and PCR primers), and 0.1 μL of Taq DNA polymerase. The DNA was amplified by 25 cycles of 95 °C for 30 s, 50 °C for 30 s, and 72 °C for 1 min. All PCR reactions were checked by gel electrophoresis on a 5% agarose gel stained with ethidium bromide.
Identification of Trends in Selected RNAs and RNA Secondary Structure Prediction
The secondary structures of all selected RNAs were predicted by free energy minimization using the Mfold program (31-33). The structures were then analyzed computationally for commonalities using the RNA Privileged Space Predictor (RNA-PSP) Program, version 1.1 (18).
RNA-PSP was used to determine statistically significant sequence trends in the selected RNAs. RNA-PSP generates all sequences contained in library 1 and compares these sequences to the sequences selected to bind the arrayed ligands. Each potential trend is first assigned a Z-score using equations 1 and 2 (34), which determine statistical significance:
| (eq. 1) |
| (eq. 2) |
where n1 is the size of Population 1 (the selected mixture), n2 is the size of Population 2 (the entire library (1), 16384 unique RNAs), p1 is the observed proportion of Population 1 displaying the trend, and p2 is the observed proportion for Population 2 (1) displaying the trend. The corresponding Z-scores were then manually converted to two-tailed p-values using a Standard Normal (Z) Table (35). Two-tailed p-values correspond to the confidence interval for the trend of interest. For example, a two-tailed p-value of 0.001 means that there is a 0.1% chance that the observation occurred randomly.
Fluorescence Binding Assays
Dissociation constants were determined using an in-solution, fluorescence-based assay (16, 22). A selected RNA or RNA mixture was annealed in HB1 supplemented with 40 μg/mL BSA at 60 °C for 5 min and allowed to slowly cool to room temperature. Then, MgCl2 and fluorescently labeled aminoglycoside (10-FL, 11-FL, 12-FL or 13-FL, Figure 2A) were added to final concentrations of 1 mM and 50 nM, respectively. Serial dilutions (1:2) were then completed in 1× HB2 containing 50 nM fluorescently labeled azido-aminoglycoside. The solutions were incubated for 30 min at room temperature and then transferred to a well of a black 96-well plate. Fluorescence intensity was measured using a Bio-Tek FLX-800 plate reader. The change in fluorescence intensity as a function of RNA concentration was fit to equation 3 (36):
| (eq. 3) |
where I is the observed fluorescence intensity, I0 is the fluorescence intensity in the absence of RNA, Δε is the difference between the fluorescence intensity in the absence of RNA and in the presence of infinite RNA concentration and is in units of M−1 1, [FL]0 is the concentration of fluorescently labeled azido-aminoglycoside, [RNA]0 is the concentration of the selected internal loop or control RNA, and Kt is the dissociation constant. Control experiments were conducted as previously described with FITC-triazole (22), which contains the dye and triazole linkage but no aminoglycoside. No change in fluorescence is observed up to 5 μM of 1 (entire internal loop library) indicating that the aminoglycoside is required for binding.
Figure 2.

Two-Dimensional Combinatorial Screening (2DCS) assay to identify RNA loop-ligand interactions. (A, top) Chemical structures of azido-aminoglycosides used in this study: 10-13 are kanamycin A, tobramycin, neamine, and neomycin B derivatives, respectively. (A, bottom) Immobilization of 10-13 onto alkyne-displaying agarose microarrays for 2DCS or for conjugation of 10-13 to fluorescein (green ball) via a Huisgen 1,3 dipolar cycloaddition reaction (HDCR) to yield 10-FL, 11-FL, 12-FL, and 13-FL. AmG refers to aminoglycoside. (B, top) Image of an aminglycoside-functionalized microarray displaying 10-13 after hybridization with radioactively labeled 1 and competitor oligonucleotides 3-9. Aminoglycoside derivatives were immobilized onto the slide surface using a HDCR at five different concentrations. (B, bottom) Bound RNAs were harvested from the microarray surface by manual excision using the image of the hybridized slide as a template.
Results and Discussion
In order to determine the specific asymmetric internal loops (AILs) that prefer to bind different aminoglycosides, Two-Dimensional Combinatorial Screening (2DCS) was used to probe the binding of members of library 1 (16384 library members; Figure 1) to a 4-member aminoglycoside library (Figure 2A) (16). The RNA library (1, Figure 1) used in these studies was designed using structures of aminoglycosides bound to an oligonucleotide mimic of the bacterial A-site (2, Figure 1) (12, 13, 37). In these structures, it was found that either direct or water-mediated contacts are formed to seven bacterial A-site nucleotides (shown in orange lettering in 2, Figure 1). Thus, each of these nucleotides was randomized to create the A-site-like library (1).
Library 1 is structurally diverse and contains other types of structures besides the 1×1 and 2×1 nucleotide internal loops that are present in the bacterial rRNA A-site. The total population of RNA secondary structures in 1 was predicted by using the Mfold server, which provides the ability to batch fold multiple RNA sequences (38). Then, a simple algorithm was designed to parse the .ct files describing the secondary structures. The algorithm determines the pattern of base paired and unpaired nucleotides within and around the variable region to sort and calculate the exact occurrence of each motif type. Analysis of these folds showed that 1 contains 3976 4×3 nucleotide internal loops; 4274 3×2 nucleotide internal loops; 2865 2×1 nucleotide internal loops; 2245 single nucleotide bulges; 1813 single nucleotide bulges with 1×1 nucleotide internal loops; 333 single nucleotide bulges with flanking 2×2 nucleotide internal loops; and 878 sequences with other more complex folding patterns.
The aminoglycoside antibiotics chosen for this study are derivatives of kanamycin A (10), tobramycin (11), neamine (12), and neomycin B (13), which bind the bacterial A-site. The position in the aminoglycoside that was functionalized with an azido group was chosen based in part on the ease of functionalization (kanamycin A and tobramycin at the 6″-OH; neamine at the 5-OH, and neomycin at the 5″-OH). Crystal structures of kanamycin A (10 mimic) and tobramycin (11-mimic) complexed with an oligonucleotide mimic of the bacterial A-site show that there are no contacts between the 6″-OH group of either aminoglycoside and the A-site (13, 14). Hence, immobilization of 10 and 11 would emulate their biological presentation for binding to the A-site. In contrast, the 5-OH and 5″-OH form intramolecular aminoglycoside contacts in 12 and 13, respectively (13, 14).
Two-Dimensional Combinatorial Screening
The aminoglycosides were arrayed onto alkyne agarose slides at five concentrations in duplicate (Figure 2B). Serial dilutions afford a dose-response for each compound. By isolating RNA structures that are bound at the lowest ligand loading that gives signal above background, the highest affinity interactions are selected (22). Since four different aminoglycosides at five different concentrations in duplicate were arrayed and probed for binding library 1, 655360 interactions were probed in a single experiment.
Aminoglycoside arrays were probed for binding to radioactively labeled RNA library 1 (Figure 1) in the presence of excess unlabelled competitor oligonucleotides (3-9, Figure 1). Competitors ensure that selected RNA-aminoglycoside interactions were confined to the randomized region. Oligonucleotides 3-6 collectively mimic the stem and flanking single stranded regions while oligonucleotide 7 mimics the hairpin. DNA competitors (8-9) were added to further increase the stringency of the selection. Each competitor oligonucleotide was added in 1000-fold excess over the amount of 1 and in 5-fold excess over the total amount of 10-13 delivered to the array surface. These ratios effectively compete off interactions to regions that are common to all members of 1 (22).
Members of 1 only bound to positions on the array where azido-aminoglycosides were immobilized (Figure 2B, top). The amount of RNA bound as a function of aminoglycoside concentration showed a clear dose response for each aminoglycoside. Binding was observed when as little as 40 pmoles of aminoglycoside were delivered. The lower loading spots were mechanically excised and subjected to RT-PCR amplification. In good agreement with a previous report, the RNAs harvested from lower ligand loadings are higher affinity than those harvested at higher loadings (22). For example, the dissociation constant obtained from the mixture of RNAs that were harvested when 200 pmoles of 11 were delivered to the surface (circled in Figure 2B, bottom panel) was 690 ± 80 nM, whereas the dissociation constant for the RNAs harvested when 40 pmoles were delivered was 480 ± 15 nM.
Affinities of the Mixtures of RNAs Selected to Bind Aminoglycosides
The binding affinities of all four aminoglycoside derivatives for 2, the A-site mimic, were determined using a fluorescence-based assay and the corresponding fluorescein-labeled compound. These values are in good agreement with previous reports (Table 1) (39). For example, the binding affinity of neomycin B for the bacterial rRNA A-site mimic (19 nM) is comparable with the affinity of 2 to 13-FL (13 nM). Likewise, the previously published dissociation constants of kanamycin A and neamine for an A-site mimic are 18000 nM and 7800 nM, respectively; 2 binds to 10-FL and 12-FL with Kd's greater than 2000 nM. Tobramycin binds to the bacterial A-site mimic with an affinity 1500 nM while 2 binds to 11-FL with a Kd of 500 nM.
Table 1.
Dissociation constants (nM) for the binding of aminoglycosides to bacterial rRNA A-site mimics and to mixtures of selected RNAs.
| Oligonucleotides | Aminoglycoside | |||
|---|---|---|---|---|
| Kanamycin A | Tobramycin | Neamine | Neomycin | |
| Bacterial rRNA A-site mimic a | 18000 | 1500 | 7800 | 19 |
| 10-FL | 11-FL | 12-FL | 13-FL | |
| 1 | >3800 | ≥2000 | >3800 | 220±18 |
| 2 | >2000 | 500±90 | >2000 | 13±8 |
| Pool of RNAs harvested from each aminoglycoside |
~1800 | 480 ± 15 | 510 ± 18 | 200 ± 60 |
Previously reported dissociation constants determined by Surface Plasmon Resonance (SPR) (39).
The mixtures of the selected RNAs for 10 and 12 bind their corresponding aminoglycosides with higher affinity than 2 (Table 1). In comparison to an A-site mimic binding to kanamycin A and neamine, the mixtures of RNAs selected to bind 10 bind ~10-fold more tightly and the 12-selected RNAs bind ~15-fold more tightly. The mixture of RNAs selected to bind to 11-binds 11-FL with similar affinity as 2 does while the 13-selected RNAs bind ~10-fold more weakly to 13-FL than 2 does.
Library 1 was tested for binding to each of the arrayed aminoglycoside derivatives to determine the enhancement in binding that 2DCS provides (Table 1). Results show that 10-FL and 12-FL bind 1 with Kd's >3800 nM, 11-FL binds 1 with a Kd of ≥ 2000 nM, and 13-FL binds 1 with a Kd of 220 nM. Comparison of these values with the values for the selected mixtures shows that 2DCS allows for selection of higher affinity binders within 1 for 10-FL, 11-FL, and 12-FL. In contrast, the binding of 13-FL to the whole library and the selected mixtures are similar. These results suggest that neomycin B (13-like) binds promiscuously to RNA asymmetric internal loops.
Determination of Privileged RNA Space Using the RNA Privileged Space Predictor (RNA-PSP) Program
The harvested RNAs were cloned and sequenced to identify the RNAs that were selected to bind each aminoglycoside. A total of 152 clones were sequenced (40 sequences for 10; 27 sequences for 11; 36 sequences for 12; and 49 sequences for 13). All selected sequences are in the Supporting Information. The sequence for 2, the bacterial A-site, was not observed. This is perhaps not surprising since the mixtures selected to bind 10 and 12 bind more tightly than 2 while 11 binds with similar affinity. Further analysis of sequences was completed using the RNA-PSP program, which facilitates the identification of statistically significant trends in sequencing data from selections (18). The program outputs Z-scores that can be converted into two-tailed p-values. A larger value for a Z-score (the corresponding two-tailed p-value is smaller) indicates greater statistical significance. In order for a trend to be considered statistically significant, the corresponding two-tailed p-value must be ≤0.05, or there is at least 95% confidence that the trend of interest did not occur by chance. RNA-PSP identified common and unique trends within selected RNAs for each aminoglycoside based only on their sequences. For example, 23 of the 78 trends identified for 10 with ≥95% confidence were unique. For 11, 33 of 74 trends were unique while the 12 derivative has the most unique trends—36 of 78. In contrast, the selected RNAs for 13 had the fewest unique trends, only 11 of 77 total trends identified. This result is consistent with the high affinity binding of 13-FL to 1. This qualitatively suggests that 10, 11, and 12 have selected more unique RNA spaces, while 13-selected RNAs are generally more promiscuous for all four arrayed aminoglycosides. The protocol that was used to identify selected internal loops that have unique trends for the corresponding aminoglycoside is shown in Figure 3. Please see the Supporting Information for a list of all trends identified for 10-13.
Figure 3.

The protocol utilized to choose selected RNA internal loops to study binding affinities and selectivities. The output of 2DCS is analyzed via the RNA-PSP program (18) to identify trends that are significant to a ≥95% confidence level. The trends for each ligand were then compared to identify those that are unique. Features that were specific for each aminoglycoside were then used to identify the selected internal loops that have the highest number of unique features. These were expected to be the most selective.
One of the most common trends for all RNA sequences independent of aminoglycoside is guanine at position 7 (Figures 1 and 3), which occurred in 113 of 150 sequences (two-tailed p-value <0.0001). Interestingly, both the human and a mutated bacterial rRNA A-sites contain a G at position 7, and both RNAs bind aminoglycosides with similar affinity (40). There are other trends that are common to all or a subset of RNA-aminoglycoside pairs. For example, is a trend observed for 11, 12, and 13 while is shared among 10, 11, and 12 (Figure 3).
Nevertheless, there are unique trends based on sequence and position in the mixtures selected for each aminoglycoside (Table 2, top and Figure 3). Specifically, three unique trends for 10 ( (Z-score: 7.04), (Z-score: 7.04) and (Z-score: 7.04)) suggesting that the kanamycin derivative prefers to bind members of 1 with U and G in positions 1 and 7, respectively, which are predicted to form a wobble UG base pair. Therefore, these RNAs display 3×2 nucleotide internal loops. Unique trends for 11 such as (Z-score: 8.72), (Z-score: 8.72) and (Z-score: 5.75) suggest that it prefers purine-rich asymmetric loops with A or G in position 1 and G in position 7. The identification of the following trends implies that 12 prefers loops that contain A, C and G at position 1, 2, and 7, respectively: (Z-score: 12.5), (Z-score: 10.0) and (Z-score: 10.0). Unique trends for 13 include (Z-score: 8.46), (Z-score: 6.28), (Z-score: and 6.28) and (Z-score: 6.28). It was expected that RNAs displaying trends that are unique for each aminoglycoside will be specific binders for that ligand.
Table 2.
The output of RNA-PSP analysis of the RNA space selected to bind to the four aminoglycosides used in this study for four base trends. All trends have at least a 99% confidence level.
| 10-Selected Library | 11-Selected Library | 12-Selected Library | 13-Selected Library | ||||
|---|---|---|---|---|---|---|---|
| Trend a | Z-score b | Trend a | Z-score b | Trend a | Z-score b | Trend a | Z-score b |
|
9.45 |
|
8.72 |

|
12.50 |
|
8.46 |

|
7.04 |

|
8.72 |
|
10.00 |

|
6.28 |

|
7.04 |

|
5.75 |

|
10.00 |

|
6.28 |

|
7.04 |

|
5.75 |

|
10.00 |
|
6.28 |

|
7.04 |

|
5.75 |
|
7.46 | ||

|
7.04 |

|
5.75 |

|
7.46 | ||
| Selected Sequences |
Number of trends c |
Selected Sequences |
Number of trends c |
Selected Sequences |
Number of trends c |
Selected Sequences |
Number of trends c |

|
4 |
|
4 |
|
13 |
|
3 |

|
7 |
|
4 |

|
11 |

|
3 |

|
5 |

|
4 |
|
7 |

|
4 |

|
10 |
|
7 |
|
13 |

|
3 |
Boxed nucleotides are derived from 1 as indicated in Figure 1.
Two-tailed p-values that correlate with these Z-score are all >0.0001.
Number of trends is calculated by counting the trends displayed by an individual loop.
The Affinities of Aminoglycosides and Individual Selected RNAs
After evaluation of significant trends for each aminoglycoside, the secondary structures of the selected RNAs were predicted using the Mfold program (33). Based on the unique trends identified by RNA-PSP, a subset of RNAs for each aminoglycoside was chosen for further investigation (Figure 3). The loops that contained the maximum number of unique trends were studied in order to determine their binding affinities and selectivities. For example, KAN AIL2 was chosen because it contains seven unique trends for 10, four of which have the highest Z-scores: , , , and (Table 2). These RNA are predicted to be high affinity and selective for their corresponding aminoglycoside.
RNAs Selected to Bind 10
Loops that were predicted to selectively bind 10 are shown in Figure 4A. All are predicted to be 3×2 nucleotide internal loops. In order for this type of loop to form, either positions 1 and 7 or positions 4 and 5 must be able to form a base pair. Interestingly, only predicted GU closing base pairs were selected. Dissociation constants ranged from 50 to 180 nM, which are at least 10-fold higher affinity than the selected mixture or 2 (Table 1). Another statistically significant trend observed for the 10-selected RNAs was the presence of an adenine across from a cytosine (Kan AIl2 and AIL4). Interestingly, this A across from C trend was also observed for 3×3 nucleotide internal loops (22) and 6-nucleotide hairpins (17) that were selected to bind 6′-N-5-hexynoate kanamycin A.
Figure 4.

Secondary structures of selected RNAs predicted by Mfold and their corresponding dissociation constants (nanomolar). The nucleotides shown were derived from the boxed region in 1 (Figure 1). Structures in A were selected to bind 10; structures in B were selected to bind 11; structures in C were selected to bind 12; and structures in D were selected to bind 13.
The selectivities of these selected loops were also studied by determining their affinities for the other arrayed aminoglycosides (11-FL, 12-FL, and 13-FL) (Table 3). These studies showed that purine-rich KAN AIL1 binds 10-FL with the highest selectivity. It binds 7-fold more weakly to 11-FL, 6-fold more weakly to 12-FL, and 4-fold more weakly to 13-FL. The best single selectivity is observed for KAN AIL2 which binds to 11-FL 11-fold more weakly than to 10-FL. This is interesting since 10 and 11 are structurally related, differing at the 3′ (OH for 10 and NH2 for 11) and 4′ (OH for 10 and H for 11) positions. However, KAN AIL2 only binds 2 and 4-fold more weakly to 12-FL and 13-FL, respectively. KAN AIL3 is 5-fold selective over 12-FL and 13-FL and only 3-fold selective over 11-FL. KAN AIL4 is the least selective loop, binding 12-FL with a similar dissociation constant (180 versus 210 nM) and binding only 2-fold more tightly to 10-FL than 11-FL and 13-FL.
Table 3.
Binding constants and selectivities of individual internal loops selected to bind 10-13.a
| Internal Loop | 10-FL | 11-FL | 12-FL | 13-FL |
|---|---|---|---|---|
| KAN AIL1 | 50 ± 31; – | 330 ± 34; 7 | 305 ± 10; 6 | 210 ± 10;4 |
| KAN AIL2 | 80 ± 67; – | 930 ± 140; 11 | 130 ± 10; 2 | 340 ± 5; 4 |
| KAN AIL3 | 90 ± 76; – | 270 ± 100; 3 | 490 ± 300; 5 | 440 ± 45; 5 |
| KAN AIL4 | 180 ± 74; – | 420 ± 100; 2 | 210 ± 110; 1 | 380 ± 75; 2 |
| TOB AIL1 | 190 ± 3; 8 | 25 ± 9; – | 640 ± 220; 26 | 600 ± 30; 24 |
| TOB AIL2 | 340 ± 22; 6 | 60 ± 20; – | 330 ± 8; 6 | 220 ± 28; 4 |
| TOB AIL3 | 420 ± 15; 3 | 125 ± 21; – | 250 ± 110; 2 | 400 ± 1; 3 |
| TOB AIL4 | 320 ± 95; 2 | 170 ± 16; – | 640 ± 180; 4 | 330 ± 110; 2 |
| NEA AIL1 | 330 ± 60; 7 | 300 ± 80; 7 | 45 ± 24; – | 410 ± 48; 9 |
| NEA AIL2 | 330 ± 170; 2 | 460 ± 83; 2 | 210 ± 120; – | 560 ± 75; 3 |
| NEA AIL3 | 250 ± 85; 1 | 370 ± 130; 2 | 220 ± 130; – | 460 ± 110; 2 |
| NEA AIL4 | 520 ± 200; 2 | 390 ± 87; 1 | 270 ± 3; – | 480 ± 3;2 |
| NEO AIL1 | 105 ± 55; 2 | 220 ± 50; 4 | 100 ± 12; 2 | 50 ± 10; – |
| NEO AIL2 | 270 ± 120; 2 | 200 ± 100; 2 | 590 ± 75; 5 | 110 ± 21; – |
| NEO AIL3 | 130 ± 17; 1 | 240 ± 63; 2 | 600 ± 200; 5 | 120 ± 4; – |
| NEO AIL4 | 880 ± 260; 4 | 790 ± 160; 4 | 340 ± 200; 2 | 200 ± 20; – |
Dissociation constants are reported in nanomolar (nM) and the values after the semicolon indicate the selectivity of the selected RNA motif-ligand interaction. Selectivities are calculated by dividing the Kd for the other aminoglycoside by the Kd for the aminoglycoside that the loop was selected to bind.
RNAs Selected to Bind 11
All of the loops chosen to study the molecular recognition of 11 are predicted to be 4×3 nucleotide internal loops. Dissociation constants range from 25 to 170 nM. Closer analysis of all selected RNAs for 11 reveals that most of the predicted 4×3 nucleotide internal loops have the potential to form an internal Watson-Crick base pair, resulting in structures similar to the bacterial rRNA A-site mimic (Figures 1 and 4). For example, TOB AIL1 has a potential internal base pair between the G at position 2 and the C at position 6, thus forming a 1×1 nucleotide loop (a GG mismatch) and 2×1 internal loop. In a previous selection of symmetric internal loops, G across from G was also preferred by 11(16). As was the case for the RNAs selected to bind 10, all 11-selected RNAs studied bind to 11-FL with higher affinity than 2 and the selected mixture by about 3-fold (Table 1).
TOB AIL1 is the most specific internal loop selected to bind 11-FL that was further studied. It binds 8-, 26-, and 24-fold more tightly to 11-FL than 10-FL, 12-FL, and 13-FL, respectively (Table 3). TOB AIL2 is 6-fold selective for 11-FL over 10-FL and 12-FL and 4-fold selective over 13-FL. TOB AIL3 and AIL4 are less selective, binding the other derivatives between 2- and 4-fold more weakly. Interestingly, NEA AIL4 (Figure 4C), a predicted 4×3 nucleotide internal loop that does not have the potential to form an internal base pair, binds more weakly to 11-FL with a Kd of ~400 nM. Taken together, statistical analysis and affinity measurements suggest 11 prefers to bind predicted 4×3 nucleotide internal loops with potential internal base pairing, forming RNAs that display 1×1 and 2×1 nucleotide internal loops separated by one base pair similar to the bacterial rRNA A-site.
RNAs Selected to Bind 12
The unique loops that bind to 12 are generally predicted to contain 1×1 mismatches separated by two base pairs from a 1-nucleotide bulge (with the exception of NEA AIL4) (Figure 4C). The dissociation constants of the RNAs studied to bind 12-FL range in affinity from 45 to 270 nM, and bind much more tightly than 2 binds to 12-FL (>2000 nM). NEA AIL1 is the highest affinity loop and is predicted to contain an adenine bulge at position 1 and a GG mismatch at positions 4 and 5. The bulge and loop are separated by CG and GU base pairs. Although NEA AIL2 and NEA AIL3 are predicted to form similar structural motifs, they bind approximately 5-fold more weakly to 12-FL than NEA AIL1. This could be due to the identity of the loop nucleotides or the closing base pairs (GC versus UG). The selected loops also have multiple 5′GC and 5′CG steps, which was also identified by hairpin loops selected to bind 6′-N-5-hexynoate neamine (17).
The most selective RNA for 12-FL is NEA AIL1, which binds 7-fold more tightly to 12-FL than 10-FL and 11-FL and 9-fold more weakly to 13-FL (Table 3). The other three RNAs studied either show no selectivity for some aminoglycosides (NEA AIL4 and 11-FL) or moderate selectivity (2- to 3-fold). Interestingly, NEO AIL1 (Figure 4D) is structurally similar to the 12-selected loops, containing a single nucleotide bulge and a 1×1 nucleotide internal loop. However, NEO AIL1 binds 2-fold more tightly to 13-FL than it does to 12-FL. This suggests that aminoglycoside specificity is based not only on the generalized motif structure but also the specific nucleotides within the loop.
RNAs Selected to Bind 13
Based on trends identified via statistical analysis from RNA-PSP, loops that were selected for 13 are predicted to be structurally diverse. For example, NEO AIL1 has the same motif that was specific for 12; the NEO AIL2 motif appears to be similar to the structure preferred by 11; and NEO AIL3 and NEO AIL4 share the motif that was selected for 10. The affinities of the loops studied for binding 13 range from 50 to 200 nM. These loops are lower affinity for 13 than the A-site and similar affinity to the mixtures of RNAs selected for 13. Overall, the NEO AILs have the lowest selectivities ranging from only 1- to 5-fold. As mentioned above, there is significant overlap between the structures selected to bind 13 and those selected to bind 10-12, which explains the low selectivity.
RNA-PSP Effectively Predicts High Affinity and Specific RNA Motif-Ligand Interactions
The protocol shown in Figure 3 was used to determine the RNA internal loop space that was specific for each aminoglycoside selected via 2DCS. By selecting the RNA internal loops that have the highest number of unique, or non-overlapping trends, specific RNA motif-ligand partners were defined (Table 3). This is especially interesting since in some cases, the aminoglycoside with the highest number of amines (neomycin B) has the highest affinity.(39, 41) Thus, the aminoglycoside derivatives are likely interacting with their corresponding selected RNA loops via specific contacts that are governed by the shapes of the loops and the functional groups that they present rather than solely binding via charge-charge interactions. Such details will require structural determination using NMR spectroscopy or X-ray crystallography.
In addition, the unique RNA motifs identified using RNA-PSP generally have higher affinities than the mixtures of structures selected by 2DCS. For example, mixtures selected for 10 bind 10-FL with a Kd of ~1800 nM while the structures determined to have unique trends by the overlap analysis bind with Kd's ranging from 50 to 180 nM; the mixture selected to bind 11 bound 11-FL with a Kd of 480 nM while the structures from the overlap analysis bound with Kd's ranging from 25 to 170 nM. These results are also mirrored in unique trends identified from 12 and 13. Thus, a protocol based on these observations could be generally applicable to other 2DCS selections to predict the highest affinity and most specific RNA motif-ligand interactions from sequence analysis rather than having to subject each selected RNA to a binding assay.
Impact On Understanding the Recognition of RNA in Biological Systems
Many studies have investigated the molecular recognition of aminoglycosides by the bacterial rRNA A-site. For example, studies by Wong and co-workers showed that several aminoglycosides have only limited specificity for binding a variety of RNAs that mimic the bacterial rRNA A-site (39). In this current and other previously reported 2DCS studies (16-18, 21), specific RNA structures that bind aminoglycosides have been identified using only a single round of selection. With the bacterial rRNA A-site-like library, overlap of statistically significant trends in the 2DCS selections have helped to identify the RNA motifs that prefer to specifically bind an aminoglycoside (Figure 3). Thus, sequence data can provide insights into not only the RNAs that prefer to bind a specific aminoglycoside but can also facilitate an understanding of how a specific RNA motif recognizes the ligand that it was selected to bind over all other arrayed ligands.
Collectively, binding data on aminoglycoside-RNA motif interactions (16-18) suggest that it is likely many loops present in biological RNAs should bind aminoglycosides with high affinity. These interactions are, in fact, of higher affinity than aminoglycosides binding to the bacterial rRNA A-site (Tables 1 and 3), which likely explains why the bacterial A-site was not observed in sequencing data at least for 10, 11, and 12. The A-site, however, is not the only binding site for the aminoglycosides in the Escherichia coli ribosome, as a crystal structure of an intact ribosome complexed with aminoglycosides shows that aminoglycosides bind to RNA helix 69 (H69) in the large subunit.(15) The interaction of aminoglycosides at this second site prevents ribosome recycling (15) and can also contribute to the drug's antibacterial effects. Promiscuous binding of aminoglycosides to other RNAs has also provided insights into side effects associated with the clinical use of aminoglycoside antibiotics (42, 43). For example, sequence alterations in eukaryotic ribosomes can render them hyper-susceptible to aminoglycoside-induced mistranslation. These interactions have been associated with aminoglycoside-induced inhibition of mitochondrial translation and cause aminoglycoside-induced cochlear toxicity (44).
All of these studies suggest that the ribosomal A-site is the most occupied target for aminoglycosides in vivo for many reasons: (i) the relative abundance of rRNAs compared to pre-mRNAs and other non-coding RNAs (45); (ii) the slower turnover rate of rRNAs compared to other RNAs (46); and (iii) the potential inaccessibility of some loops due to formation of tertiary contacts or interactions with protein. If the exact interplay of each of these features were known, it could help to identify RNA drug targets in genomic sequence that would be more amendable for small molecule intervention.
Supplementary Material
Acknowledgment
We thank Jessica Childs-Disney for critical review of the manuscript and Steve Seedhouse for help with the computer program to analyze the folding of library 1. M.D.D. is a Cottrell Scholar from the Research Corporation and a Camille and Henry Dreyfus New Faculty Awardee.
This work was funded by the National Institutes of Health, RO1 GM079235
Abbreviations
- 2DCS
Two-Dimensional Combinatorial Screening
- AIL
asymmetric internal loop
- A-site
aminoacyl-tRNA site
- BSA
bovine serum albumin
- DMSO
dimethyl sulfoxide
- dNTP
deoxyribonucleotide triphosphate
- HEPES
N-(2-hydroxyethyl)piperazine-N′-2-ethanesulfonic acid
- PBS
phosphate-buffered saline
- PCR
polymerase chain reaction
- RNA-PSP
RNA Privileged Space Predictor
- rRNA
ribosomal RNA
- RT-PCR
reverse transcriptase-polymerase chain reaction
- RQ
RNA-Qualified
- SDS
sodium dodecyl sulfate
- TBTA
tris(benzyltriazolylmethyl)amine
- Tris-HCl
tris(hydroxymethyl)aminomethane-hydrochloride
Footnotes
Supporting Information Supporting information containing the entire selected sequences, the overlap analysis of these sequences, and the output of RNA-PSP analysis of the selections are available at http:/www.pubs.acs.org.
References
- 1.Cate JH, Gooding AR, Podell E, Zhou K, Golden BL, Kundrot CE, Cech TR, Doudna JA. Crystal structure of a group I ribozyme domain: principles of RNA packing. Science. 1996;273:1678–1685. doi: 10.1126/science.273.5282.1678. [DOI] [PubMed] [Google Scholar]
- 2.Cate JH, Gooding AR, Podell E, Zhou K, Golden BL, Szewczak AA, Kundrot CE, Cech TR, Doudna JA. RNA tertiary structure mediation by adenosine platforms. Science. 1996;273:1696–1699. doi: 10.1126/science.273.5282.1696. [DOI] [PubMed] [Google Scholar]
- 3.Abramovitz DL, Pyle AM. Remarkable morphological variability of a common RNA folding motif: the GNRATetraloop-receptor interaction. J. Mol. Biol. 1997;266:493–506. doi: 10.1006/jmbi.1996.0810. [DOI] [PubMed] [Google Scholar]
- 4.Roth A, Breaker RR. The structural and functional diversity of metabolite-binding riboswitches. Annu. Rev. Biochem. 2009;78:305–334. doi: 10.1146/annurev.biochem.78.070507.135656. [DOI] [PMC free article] [PubMed] [Google Scholar]
- 5.Blount KF, Breaker RR. Riboswitches as antibacterial drug targets. Nat. Biotechnol. 2006;24:1558–1564. doi: 10.1038/nbt1268. [DOI] [PubMed] [Google Scholar]
- 6.Gutell R. Comarative analysis of RNA sequences. Nucleic Acids Symp. Ser. 1999;41:48. [Google Scholar]
- 7.Noller HF. Ribosomal RNA and translation. Annu. Rev. Biochem. 1991;60:191–227. doi: 10.1146/annurev.bi.60.070191.001203. [DOI] [PubMed] [Google Scholar]
- 8.Yoshizawa S, Fourmy D, Puglisi JD. Recognition of the codon-anticodon helix by ribosomal RNA. Science. 1999;285:1722–1725. doi: 10.1126/science.285.5434.1722. [DOI] [PubMed] [Google Scholar]
- 9.Richard Brimacombe. The structure of ribosomal RNA: a three-dimensional jigsaw puzzle. Eur. J. Biochem. 1995;230:365–383. [PubMed] [Google Scholar]
- 10.Green and R, Noller HF. Ribosomes and translation. Annu. Rev. Biochem. 1997;66:679–716. doi: 10.1146/annurev.biochem.66.1.679. [DOI] [PubMed] [Google Scholar]
- 11.Kaul M, Barbieri CM, Pilch DS. Aminoglycoside-induced reduction in nucleotide mobility at the ribosomal RNA A-Site as a potentially key determinant of antibacterial activity. J. Am. Chem. Soc. 2006;128:1261–1271. doi: 10.1021/ja056159z. [DOI] [PubMed] [Google Scholar]
- 12.Fourmy D, Recht MI, Blanchard SC, Puglisi JD. Structure of the A site of Escherichia coli 16S ribosomal RNA complexed with an aminoglycoside antibiotic. Science. 1996;274:1367–1371. doi: 10.1126/science.274.5291.1367. [DOI] [PubMed] [Google Scholar]
- 13.Francois B, Russell RJM, Murray JB, Aboul-ela F, Masquida B, Vicens Q, Westhof E. Crystal structures of complexes between aminoglycosides and decoding A site oligonucleotides: role of the number of rings and positive charges in the specific binding leading to miscoding. Nucleic Acids Res. 2005;33:5677–5690. doi: 10.1093/nar/gki862. [DOI] [PMC free article] [PubMed] [Google Scholar]
- 14.Vicens Q, Westhof E. Crystal Structure of a complex between the aminoglycoside tobramycin and an oligonucleotide containing the ribosomal decoding A site. Chem. Biol. 2002;9:747–755. doi: 10.1016/s1074-5521(02)00153-9. [DOI] [PubMed] [Google Scholar]
- 15.Borovinskaya MA, Pai RD, Zhang W, Schuwirth BS, Holton JM, Hirokawa G, Kaji H, Kaji A, Cate JH. Structural basis for aminoglycoside inhibition of bacterial ribosome recycling. Nat. Struct. Mol. Biol. 2007;14:727–732. doi: 10.1038/nsmb1271. [DOI] [PubMed] [Google Scholar]
- 16.Disney MD, Labuda LP, Paul DJ, Poplawski SG, Pushechnikov A, Tran T, Velagapudi SP, Wu M, Childs-Disney JL. Two-dimensional combinatorial screening identifies specific aminoglycoside-RNA internal loop partners. J. Am. Chem. Soc. 2008;130:11185–11194. doi: 10.1021/ja803234t. [DOI] [PubMed] [Google Scholar]
- 17.Aminova O, Paul DJ, Childs-Disney JL, Disney MD. Two-dimensional combinatorial screening identifies specific 6′-acylated kanamycin A- and 6′-acylated neamine-RNA hairpin interactions. Biochemistry. 2008;47:12670–12679. doi: 10.1021/bi8012615. [DOI] [PMC free article] [PubMed] [Google Scholar]
- 18.Paul DJ, Seedhouse SJ, Disney MD. Two-dimensional combinatorial screening and the RNA Privileged Space Predictor program efficiently identify aminoglycoside-RNA hairpin loop interactions. Nucleic Acids Res. 2009;37:5894–5907. doi: 10.1093/nar/gkp594. [DOI] [PMC free article] [PubMed] [Google Scholar]
- 19.Lee MM, Pushechnikov A, Disney MD. Rational and modular design of potent ligands targeting the RNA that causes myotonic dystrophy 2. ACS Chem. Biol. 2009;4:345–355. doi: 10.1021/cb900025w. [DOI] [PMC free article] [PubMed] [Google Scholar]
- 20.Pushechnikov A, Lee MM, Childs-Disney JL, Sobczak K, French JM, Thornton CA, Disney MD. Rational design of ligands targeting triplet repeating transcripts that cause RNA dominant disease: application to myotonic muscular dystrophy type 1 and spinocerebellar ataxia type 3. J. Am. Chem. Soc. 2009;131:9767–9779. doi: 10.1021/ja9020149. [DOI] [PMC free article] [PubMed] [Google Scholar]
- 21.Disney MD, Childs-Disney JL. Using selection to identify and chemical microarray to study the RNA internal loops recognized by 6′-N-acylated kanamycin A. ChemBiochem. 2007;8:649–656. doi: 10.1002/cbic.200600569. [DOI] [PubMed] [Google Scholar]
- 22.Childs-Disney JL, Wu M, Pushechnikov A, Aminova O, Disney MD. A small molecule microarray platform to select RNA internal loop-ligand interactions. ACS Chem. Biol. 2007;2:745–754. doi: 10.1021/cb700174r. [DOI] [PubMed] [Google Scholar]
- 23.Afanassiev V, Hanemann V, Wolfl S. Preparation of DNA and protein micro arrays on glass slides coated with an agarose film. Nucleic Acids Res. 2000;28:e66. doi: 10.1093/nar/28.12.e66. [DOI] [PMC free article] [PubMed] [Google Scholar]
- 24.Kolb Hartmuth C., Finn MG, Barry Sharpless K. Click chemistry: diverse chemical function from a few good reactions. Angew. Che., Int. Ed. Engl. 2001;40:2004–2021. doi: 10.1002/1521-3773(20010601)40:11<2004::AID-ANIE2004>3.0.CO;2-5. [DOI] [PubMed] [Google Scholar]
- 25.Disney MD, Barrett OJ. An aminoglycoside microarray platform for directly monitoring and studying antibiotic resistance. Biochemistry. 2007;46:11223–11230. doi: 10.1021/bi701071h. [DOI] [PubMed] [Google Scholar]
- 26.Chan TR, Hilgraf R, Sharpless KB, Fokin VV. Polytriazoles as copper(I)-stabilizing ligands in catalysis. Org. Lett. 2004;6:2853–2855. doi: 10.1021/ol0493094. [DOI] [PubMed] [Google Scholar]
- 27.Bevilacqua JM, Bevilacqua PC. Thermodynamic analysis of an RNA combinatorial library contained in a short hairpin. Biochemistry. 1998;37:15877–15884. doi: 10.1021/bi981732v. [DOI] [PubMed] [Google Scholar]
- 28.Peyret N, Seneviratne PA, Allawi HT, SantaLucia J. Nearest-neighbor thermodynamics and NMR of DNA sequences with internal A•A, C•C, G•G, and T•T mismatches. Biochemistry. 1999;38:3468–3477. doi: 10.1021/bi9825091. [DOI] [PubMed] [Google Scholar]
- 29.SantaLucia J. A unified view of polymer, dumbbell, and oligonucleotide DNA nearest-neighbor thermodynamics. Proc. Natl. Acad. Sci. U. S. A. 1998;95:1460–1465. doi: 10.1073/pnas.95.4.1460. [DOI] [PMC free article] [PubMed] [Google Scholar]
- 30.Puglisi JD, Tinoco I, James ED, John NA. Absorbance melting curves of RNA. Methods Enzymol. 1989;180:304–325. doi: 10.1016/0076-6879(89)80108-9. [DOI] [PubMed] [Google Scholar]
- 31.Mathews DH, Sabina J, Zuker M, Turner DH. Expanded sequence dependence of thermodynamic parameters improves prediction of RNA secondary structure. J. Mol. Biol. 1999;288:911–940. doi: 10.1006/jmbi.1999.2700. [DOI] [PubMed] [Google Scholar]
- 32.Mathews DH, Disney MD, Childs JL, Schroeder SJ, Zuker M, Turner DH. Incorporating chemical modification constraints into a dynamic programming algorithm for prediction of RNA secondary structure. Proc. Natl. Acad. Sci. U. S. A. 2004;101:7287–7292. doi: 10.1073/pnas.0401799101. [DOI] [PMC free article] [PubMed] [Google Scholar]
- 33.Zuker M. Mfold web server for nucleic acid folding and hybridization prediction. Nucleic Acids Res. 2003;31:3406–3415. doi: 10.1093/nar/gkg595. [DOI] [PMC free article] [PubMed] [Google Scholar]
- 34.Zou KH, Fielding JR, Silverman SG, Tempany CMC. Hypothesis testing I: Proportions. Radiology. 2003;226:609–613. doi: 10.1148/radiol.2263011500. [DOI] [PubMed] [Google Scholar]
- 35.Weiss NA, Hassett MJ. Introductory Statistics. xiii. Addison-Wesley Pub. Co.: Reading, Massachusetts; 1982. [Google Scholar]
- 36.Wang Y, Rando RR. Specific binding of aminoglycoside antibiotics to RNA. Chem. Biol. 1995;2:281–290. doi: 10.1016/1074-5521(95)90047-0. [DOI] [PubMed] [Google Scholar]
- 37.Fourmy D, Recht MI, Puglisi JD. Binding of neomycin-class aminoglycoside antibiotics to the A-site of 16 s rRNA. J. Mol. Biol. 1998;277:347–362. doi: 10.1006/jmbi.1997.1552. [DOI] [PubMed] [Google Scholar]
- 38.Markham NR, Zuker M. DINAMelt web server for nucleic acid melting prediction. Nucleic Acids Res. 2005;33:W577–581. doi: 10.1093/nar/gki591. [DOI] [PMC free article] [PubMed] [Google Scholar]
- 39.Wong CH, Hendrix M, Priestley ES, Greenberg WA. Specificity of aminoglycoside antibiotics for the A-site of the decoding region of ribosomal RNA. Chem. Biol. 1998;5:397–406. doi: 10.1016/s1074-5521(98)90073-4. [DOI] [PubMed] [Google Scholar]
- 40.Griffey RH, Hofstadler SA, Sannes-Lowery KA, Ecker DJ, Crooke ST. Determinants of aminoglycoside-binding specificity for rRNA by using mass spectrometry. Proc. Natl. Acad. Sci. U. S. A. 1999;96:10129–10133. doi: 10.1073/pnas.96.18.10129. [DOI] [PMC free article] [PubMed] [Google Scholar]
- 41.von Ahsen U, Noller HF. Footprinting the sites of interaction of antibiotics with catalytic group I intron RNA. Science. 1993;260:1500–1503. doi: 10.1126/science.8502993. [DOI] [PubMed] [Google Scholar]
- 42.Mingeot-Leclercq MP, Tulkens PM. Aminoglycosides: Nephrotoxicity. Antimicrob. Agents Chemother. 1999;43:1003–1012. doi: 10.1128/aac.43.5.1003. [DOI] [PMC free article] [PubMed] [Google Scholar]
- 43.Kondo J, Francois B, Urzhumtsev A, Westhof E. Crystallographic studies of Homo sapiens ribosomal decoding A site complexed with aminoglycosides. Nucleic Acids Symp. Ser. 2005;49:253–254. doi: 10.1093/nass/49.1.253. [DOI] [PubMed] [Google Scholar]
- 44.Hobbie SN, Akshay A, Kalapala SK, Bruell CM, Shcherbakov D, Bottger EC. Genetic analysis of interactions with eukaryotic rRNA identify the mitoribosome as target in aminoglycoside ototoxicity. Proc. Natl. Acad. Sci. U.S.A. 2008;105:20888–20893. doi: 10.1073/pnas.0811258106. [DOI] [PMC free article] [PubMed] [Google Scholar]
- 45.Berg JM, Tymoczko JL, Stryer L. Biochemistry. Sixth Edition W.H. Freeman and Company; New York: 2007. [Google Scholar]
- 46.Deutscher MP. Degradation of RNA in bacteria: comparison of mRNA and stable RNA. Nucleic Acids Res. 2006;34:659–666. doi: 10.1093/nar/gkj472. [DOI] [PMC free article] [PubMed] [Google Scholar]
Associated Data
This section collects any data citations, data availability statements, or supplementary materials included in this article.