Abstract
To understand pathways mediating the inflammatory responses of human aortic endothelial cells to oxidized phospholipids, we previously used a combination of genetics and genomics to model a coexpression network encompassing >1000 genes. CHAC1 (cation transport regulator-like protein 1), a novel gene regulated by ox-PAPC (oxidized 1-palmitoyl-2-arachidonyl-sn-3-glycero-phosphorylcholine), was identified in a co-regulated group of genes enriched for components of the ATF4 (activating transcription factor 4) arm of the unfolded protein response pathway. Herein, we characterize the role of CHAC1 and validate the network model. We first define the activation of CHAC1 mRNA by chemical unfolded protein response-inducers, but not other cell stressors. We then define activation of CHAC1 by the ATF4-ATF3-CHOP (C/EBP homologous protein), and not parallel XBP1 (X box-binding protein 1) or ATF6 pathways, using siRNA and/or overexpression plasmids. To examine the subset of genes downstream of CHAC1, we used expression microarray analysis to identify a list of 227 differentially regulated genes. We validated the activation of TNFRSF6B (tumor necrosis factor receptor superfamily, member 6b), a FASL decoy receptor, in cells treated with CHAC1 small interfering RNA. Finally, we showed that CHAC1 overexpression enhanced apoptosis, while CHAC1 small interfering RNA suppressed apoptosis, as determined by TUNEL, PARP (poly(ADP-ribose) polymerase) cleavage, and AIF (apoptosis-inducing factor) nuclear translocation.
Most natural populations exhibit thousands of common DNA variations that perturb gene expression (1–3). These expression variations can be quantified by microarray analysis and used to identify co-regulated genes and construct co-expression network modules (1–8). We and others have shown that such networks identify groups of correlated genes in modules that are highly enriched for known pathways (1–8). We now show that network modeling can generate useful hypotheses for the functional annotation of novel genes.
Oxidized 1-palmitoyl-2-arachidonyl-sn-3-glycero-phosphoryl-choline (ox-PAPC)3 is a proinflammatory oxidized phospholipid that has been implicated in the pathogenesis of atherosclerosis. We previously generated global gene expression networks using a set of primary human aortic endothelial cell (HAEC) lines from healthy donors treated with ox-PAPC (5, 6). Among 15 modules identified, one was highly enriched for genes of the ATF4 (activating transcription factor 4) branch of the unfolded protein response (UPR) pathway. CHAC1 (cation transport regulator-like protein 1, aka MGC4504, YER163c, chaC, Rik1810008K03, MMT00059404) was among the most highly connected genes in this module. Preliminary studies showed that CHAC1 was induced in HAEC by tunicamycin and that ATF4 small interfering RNA (siRNA) could inhibit this induction (6). The yeast homolog of CHAC1 (YER163c) has also been identified as a mRNA that was induced by UPR activation (9).
CHAC1/YER163c/ChaC/MGC4504 is highly conserved, having ~30% aa identity between mammalian and bacterial genes, suggesting a fundamental role for survival. The bacterial CHAC1 homolog, chaC, is part of the cha (Ca2+, H+ antiporter) operon and consists of three genes: chaA, chaB, and chaC (10–12). chaA is a bacterial membrane antiporter that transports Ca2+, H+, Na+, and K+ and is thought to be involved in the maintenance of cellular ion concentration and osmolarity. The functions of chaB and chaC are less well defined in the bacterial system, but they may modulate the activity of the chaA antiporter, as is the common modus for prokaryotic operons. Since there are numerous analogous membrane-associated cation antiporters in mammals (13), auxiliary functions of chaB and chaC in relation to chaA are likely not conserved. The CHAC1 protein contains a large conserved domain spanning aa 30–210 (Pfam: ChaC-like domain) that has been solved in a conserved yeast protein At5g39720.1, and the Escherichia coli YtfP. The localization or function of this protein has previously not been defined in any system.
The endoplasmic reticulum (ER) facilitates the translation, maturation, and trafficking of integral membrane and secreted proteins and lipids. Sensor proteins regulate ER function, and when their capacity is exceeded, the UPR is activated. The UPR is a protective response to ER stress, with the net effect being augmentation of divergent pathways that reduce ER load (14–16). The molecular pathways defining UPR induction have been well characterized and involve the activation of several key transcription factors, including ATF4, ATF6, and XBP1 (X box-binding protein 1). These then increase synthesis of several proteins involved in protein stabilization (DNAJ, HSP70, HSP90), ER-associated degradation (HERPUD1), and other pathways that reduce ER load (14, 16). Additionally, various protective responses, including activation of inflammatory pathways, G1 arrest, and apoptosis are signaled.
Herein, we define CHAC1 as a novel component of the mammalian UPR, downstream of the ATF4-ATF3-CHOP (C/EBP homologous protein) pathway. Additionally, we define a role for CHAC1 in promoting apoptosis signaling through AIF (apoptosis-inducing factor) and PARP (poly(ADP-ribose) polymerase).
Materials and Methods
Reagents and Abs
The following commercially available Abs were used: V5-epitope (Invitrogen, R960-25), cleaved PARP1 (Cell Signaling Technology, no. 9541), AIF (Cell Signaling Technology, no. 4642), caspase-3 (Santa Cruz Bio-technology, SC7272), cleaved caspase-3 (Cell Signaling Technology, no. 9664), TNFRSF6B (tumor necrosis factor receptor superfamily, member 6b, a FASL decoy receptor; Cell Signaling Technology, no. 4758), actin (Sigma-Aldrich, no. A2066), GAPDH (Cell Signaling Technology, no. 2118), histone H3 (Cell Signaling Technology, no. 9715), secondary anti-mouse Ab (Amersham/GE Healthcare, NA931V), and anti-rabbit Ab (Amersham/GE Healthcare, NA934V).
The following human specific siRNAs were purchased from Qiagen: CHAC1 (SI00642131, SI00642138, SI00642145), CHOP (SI00059528, SI00059535), ATF3 (SI00305900, SI00305907), ATF6 (SI03019205, SI03019206), XBP1 (SI00763840, SI02656661), and scrambled control (1027280).
Primers for real-time PCR were as follows: β2-microglobulin, forward, ATC GGA GCA GTC AGA CCT GTC TTT, reverse, ATG GTG CTG CTT ACA GGT CTC GAT; CHAC1, forward, CCT GAA GTA CCT GAA TGT GCG AGA, reverse, GCA GCA AGT ATT CAA GGT TGT GGC; ATF4, forward, CAT TCC TCG ATT CCA GCA AAG CAC, reverse, TTC TCC AAC ATC CAA TCT GTC CCG; ATF3, forward, TTG CAG AGC TAA GCA GTC GTG GTA, reverse, ATG GTT CTC TGC TGC TGG GAT TCT; CHOP, forward, ATG GCA GCT GAG TCA TTG CCT TTC, reverse, AGA AGC AGG GTC AAG AGT GGT GAA; spliced XBP1, forward, CCG CAG CAG GTG CAG G, reverse, GAG TCA ATA CCG CCA GAA TCC A; BiP, forward, ATC CCG TGG CAT AAA CCC AGA TGA, reverse, ACT TCT GGT AGG CAC CAC TGT GT; ATF6 (Qiagen, QT00083370); TNFRSF6B, forward, AGG TCA TCA ACG AGC TTC GGA ACA, reverse, AGA AAT GAC AGG AGC GAC TTG CCA.
The full-length CHAC1 coding region was PCR amplified from a cDNA clone purchased from OriGene (SC111411) and cloned in-frame, directly upstream of a V5 epitope and enhanced GFP (eGFP) coding peptide to generate CHAC1-V5eGFP. This construct, containing a CMV promoter, was fully sequenced in both directions to verify that no mutations were introduced by PCR.
Cell culture
HAEC were cultured as previously described (6). HEK 293 and HeLa cells were grown in DMEM supplemented with 10% FBS. Cells were transfected with HiPerFect reagent (Qiagen) for siRNA treatments or Lipo-fectamine 2000 (Invitrogen) for plasmids according to the manufacturers’ protocols. UPR-inducing treatments were 1 mM DTT, 10 μg/ml tunicamycin, 5 μM thapsigargin, or 50 μg/ml ox-PAPC for 4 h. Nonspecific cell stress treatments were heat shock (40°C for 60 min) or UV (5 J/m2) followed by 24 h recovery. For eGFP and V5 immunostaining, cells were grown on glass coverslips, fixed with formalin, and treated with Abs diluted in PBS, with 3% BSA blocking solution. Following washing and incubation with corresponding secondary Ab, coverslips were counter-stained with DAPI (4′,6-diamidino-2-phenylindole), mounted in 50% glycerol, and visualized using a Leica fluorescence microscope. TUNEL staining was done using the ApopTag Red in situ apoptosis detection kit (Chemicon International, catalog no. S7165), according to the manufacturer’s specifications.
Immunoblotting
Nuclear vs cytoplasmic protein extractions were performed as previously described (6). Protein samples were separated and blotted using precast gels and membranes (Invitrogen) and blocked with 3% BSA in TBST (10 mM Tris (pH 7.5), 100 mM NaCl, 0.1% Tween 20). Primary Abs were incubated for 1 h at room temperature diluted 1/1000 in TBST, washed in TBST, and subsequently incubated in corresponding secondary Abs diluted 1/2500. Membranes were treated with ECL Plus reagent (Amersham Biosciences) for detection. Quantification of band intensities was done using a GelDoc1000 (Bio-Rad). Student’s t test was used to determine significant differences in band intensities, normalized to control (cytosol: GAPDH or actin; nucleus: histone H3). For experiments with more than two groups we used ANOVA followed by the Student-Newman-Keuls test. Each sample was run in triplicate and repeated in at least two separate experiments.
Real-time PCR
Quantitative mRNA measurements were performed in triplicate using SYBR Green detection as described previously (6). RNA was isolated using RNeasy columns (Qiagen), and reverse transcription was performed using SuperScript III (Invitrogen) according to the manufacturers’ protocols. Each real-time measurement of reverse-transcribed mRNA was normalized to β2-microglobulin levels, run in parallel. For statistical analysis we used ANOVA followed by the Student-Newman-Keuls test. All measurements were done using n = 3 for each treatment, repeated in at least two separate experiments.
Microarrays
Global RNA expression was determined using RNA isolated as above, and assayed using the Illumina platform HumanRef-8 v2 BeadChips that assay more than 22,000 transcripts. Primary data were normalized using the rank-invariant method of bead detection studio software (Illumina). Statistical analyses were done using the GeneSifter package of programs (www.genesifter.net).
Results
Chemical UPR activators, but not general cell stressors, induce CHAC1 expression
The UPR can be induced with chemical agents, such as tunicamycin (N-linked glycosylation inhibitor), DTT (reduces disulfide linkages), thapsigargin (SERCA (sarco-endoplasmic Ca2+-ATPase) inhibitor), or ox-PAPC (6), but not with other general stressors such as heat shock (42°C, 60 min) or short-wave UV treatment (5 J/m2) (17).
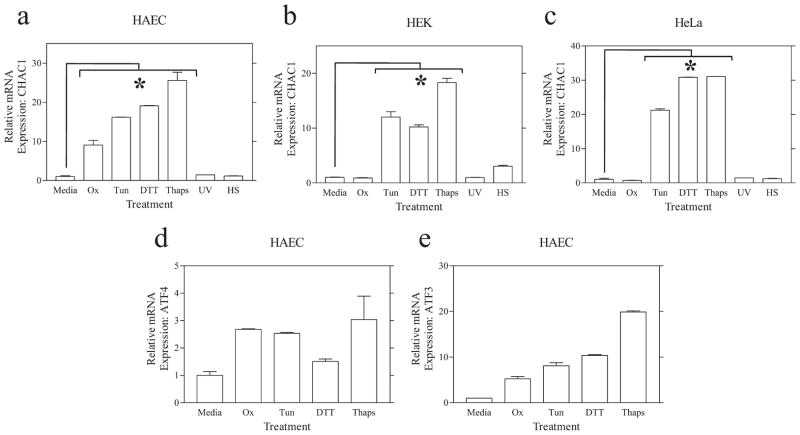
We assayed CHAC1 mRNA by real-time RT-PCR in cells treated with tunicamycin, DTT, thapsigargin, or Ox-PAPC vs UV or heat shock (Fig. 1). These experiments demonstrated that CHAC1 mRNA was robustly induced in HAEC and in HEK and HeLa cells following treatments that induce the UPR (tunicamycin, DTT, or thapsigargin) but not with general cell stressors (UV or heat shock). We also examined the mRNA expression of ATF4 and ATF3 following these same treatments to validate the chemical UPR inducers (Fig. 1, d and e).
FIGURE 1.
CHAC1 is induced specifically by chemical UPR inducers. Determination of normalized CHAC1 mRNA measured by real-time RT-PCR in untreated cells (Media) and in cells treated with ox-PAPC (Ox), tunicamycin (Tun), DTT, thapsigargin (Thaps), or the general cell stressors UV and heat shock (HS). Shown are data from primary (a) HAEC, (b) HEK 293 cells, and (c) HeLa cells. Induction of known UPR genes (d) ATF4 and (e) ATF3 in HAEC, by real-time RT-PCR, in untreated cells (media) and in cells treated with chemical UPR inducers. *, p < 0.01.
It is noteworthy that ox-PAPC did not induce CHAC1 mRNA in HEK or HeLa cells, in contrast to our previous findings in HAEC. These data indicate that the induction of portions of the UPR pathway in HAEC by ox-PAPC is selective to this cell type. Collectively, these data indicate that CHAC1 is indeed a novel member of the UPR pathway.
CHAC1 is downstream of the ATF4-ATF3-CHOP pathway
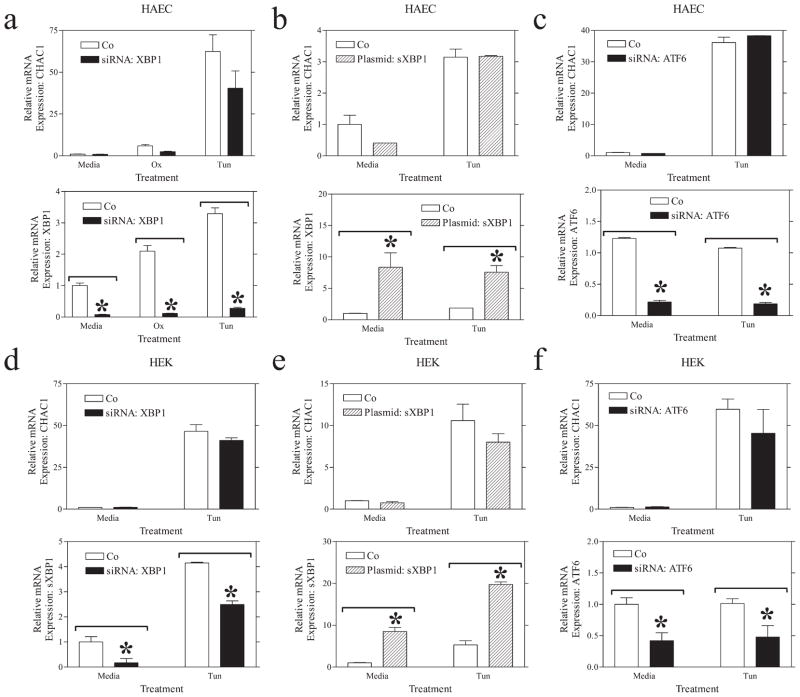
Network modeling suggested that CHAC1 was in the ATF4 rather than in the XBP1 or ATF6 branches of the UPR. We have previously shown that CHAC1 mRNA was stimulated following ATF4 overexpression and that siRNA inhibition of ATF4 inhibited UPR induction of CHAC1 (6). To further characterize UPR signal transduction pathways that regulate CHAC1, we examined the effect of inhibiting other components of the UPR on CHAC1 mRNA expression. Unlike the effect of ATF4 siRNA, neither XBP1 nor ATF6 knockdown significantly prevented the induction of CHAC1 by UPR stimulation (tunicamycin treatment) in HAEC or HEK cells (Fig. 2). Since we noted a small, but nonsignificant, reduction in CHAC1 mRNA following XBP1 inhibition in both cell types, we additionally examined the effect of spliced XBP1 overexpression. Increasing XBP1 levels did not significantly affect CHAC1 mRNA induction in HAEC or HEK cells (Fig. 2, b and e). We validated the efficacy of the ATF6 and XBP1 siRNA, as well as spliced XBP1 expression constructs, by monitoring mRNA expression of these genes following transfections with respective siRNA or plasmid (Fig. 2). These data suggest that CHAC1 activation by the UPR is dependent solely on ATF4 and not XBP1 or ATF6.
FIGURE 2.
XBP1 or ATF6 arms of the UPR do not affect CHAC1 mRNA expression. Determination of normalized CHAC1 mRNA levels measured by real-time RT-PCR following treatment with media, ox-PAPC (Ox), and/or tunicamycin (Tun) in HAEC cells transfected with (a) XBP1 siRNA, or scrambled control, (b) spliced XBP1 (sXBP1) overexpression construct or eGFP control plasmid, or (c) ATF6 siRNA, vs scrambled control. d–f, Determination of normalized CHAC1 mRNA levels as in a–c in HEK 293 cells. Measurement of normalized target gene modulation is also shown in the bottom panels. *, p < 0.01.
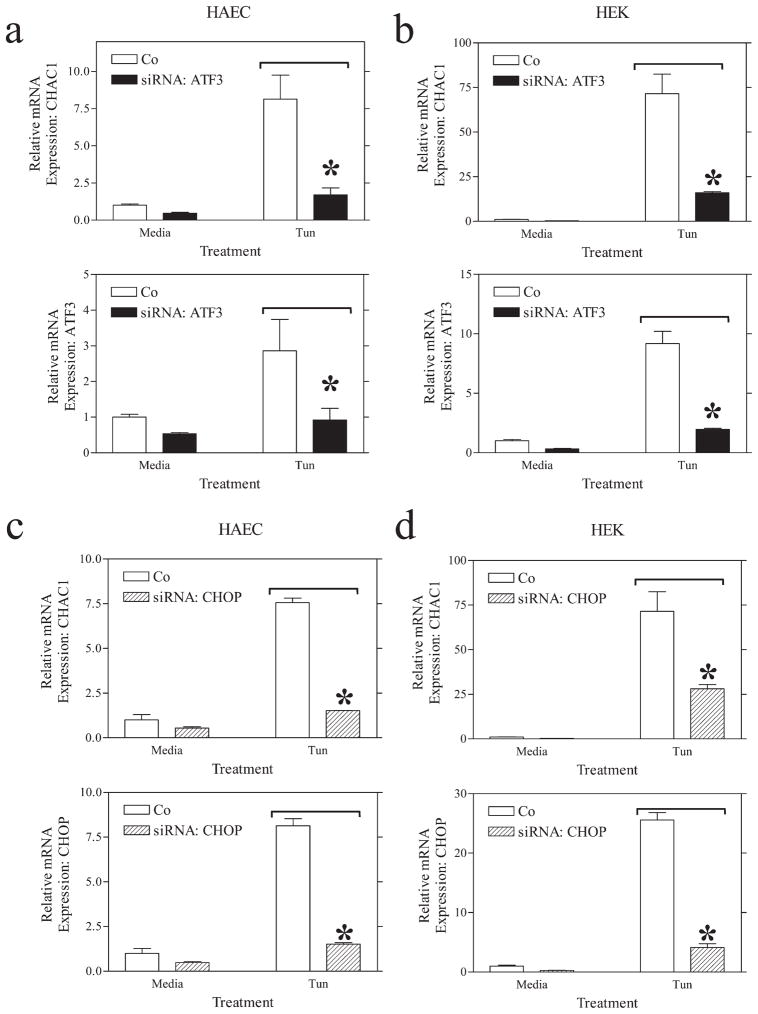
We next examined whether siRNA knockdown of ATF3 or CHOP was sufficient to reduce the expression of CHAC1 following induction of the UPR. These transcription factors are downstream of ATF4 in the UPR induction cascade (14). Both ATF3 and CHOP knockdown were sufficient to reduce the induction of CHAC1 mRNA by tunicamycin in HEK cells and HAEC (Fig. 3). These data suggest that CHAC1 is indeed a component of the UPR and that it lies downstream of the ATF4-ATF3-CHOP pathway.
FIGURE 3.
ATF3 or CHOP siRNA treatment inhibits CHAC1 mRNA expression in the context of UPR induction. Determination of normalized CHAC1 mRNA levels measured by real-time RT-PCR following treatment with media or tunicamycin (Tun) in (a and c) HAEC or (b and d) HEK 293 cells treated with (a and b) ATF3 siRNA or (c and d) CHOP siRNA vs scrambled control. Determination of normalized levels of the target mRNA is also shown in each panel. *, p < 0.01.
CHAC1 is coexpressed with ATF4 in vivo
We examined the expression of CHAC1 in a genetic cross between the C57BL/6J-ApoE and C3H/HeJ-ApoE mouse strains. Whole-genome transcript levels in four tissues, brain, liver, muscle, and adipose, were examined in 334 F2 progeny. Notably, ATF4 was the gene most highly correlated with CHAC1 in brain (Pearson’s correlation: 0.73, p < 5 × 10−50), and it was also highly correlated (ranked 24th overall) in liver (Pearson’s correlation: 0.37, p < 2.5 × 10⁻¹¹), two metabolically active tissues that have a high ER load. However, this interaction was not observed in adipose or muscle, likely because these tissues have a smaller ER folding capacity, and the induction of UPR signaling pathways is below the limits of detection. Interestingly, we also noted expression correlations between ATF3 (−0.27, 1.6 × 10⁻⁶) and CHOP (−0.25, 1.1 × 10⁻⁵) with CHAC1 in brain tissue from this data set.
Structure and subcellular localization of CHAC1
CHAC1 contains a domain that is highly conserved from the bacterial chaC, but the function of this domain is unknown. The three-dimensional structure of CHAC1 was modeled using the Phyre algorithm (www.sbg.bio.ic.ac.uk/phyre) (18). The output indicated an E-value of 0.063, with estimated precision of 95%. The structure of this protein most closely resembles that of BtrG and ytfr, two yeast proteins of unknown function. This software algorithm also models the presence of pockets/cavities/clefts as an indicator of possible active sites or critical amino acid residues. Residues Phe36, Gly94, Trp93, Tyr60, and Ala140 received high scores and will be the subject of future site-directed mutagenesis studies defining the molecular function of CHAC1.
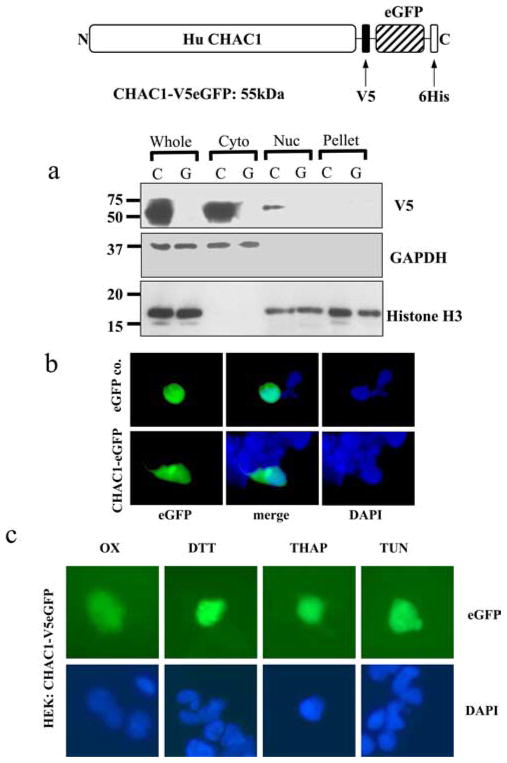
Human CHAC1 does not contain an ER-targeting signal peptide or any other sequence indicating subcellular localization, although the N terminus of the peptide contains a hydrophobic region that could be embedded in or span a membrane (aa 5–21). To determine the cellular localization of CHAC1, we generated expression constructs fused in-frame to an epitope tag and eGFP (CHAC1-V5eGFP). We fractionated cells transfected with CHAC1-V5eGFP and examined expression of CHAC1-V5eGFP by Western blotting. CHAC1 was primarily localized in the cytosolic compartment compared with the nucleus or pellet fractions (Fig. 4a).
FIGURE 4.
CHAC1 protein is expressed in the cytosol, and protein localization is not changed following induction of the UPR. a, Western blot detecting the V5 epitope, cytosolic control GAPDH, and nuclear histone H3 in cells transfected with C (CHAC1-V5eGFP (55 kDa)) or G (control eGFP). Whole indicates whole-cell extract, Cyto, cytosolic extract; Nuc, nuclear extract; Pellet, pelleted membranes. b, Fluorescence images of eGFP (green) and DAPI (blue) in cells transfected with CHAC1-V5eGFP-expressing plasmid or eGFP control. c, eGFP and DAPI fluorescence of HEK cells transfected with CHAC1-V5eGFP and treated with ox-PAPC or the chemical UPR inducers DTT, thapsigargin, or tunicamycin.
To further demonstrate the cytosolic expression of CHAC1 we used fluorescence microscopy. Cells transiently transfected with CHAC1-V5eGFP displayed diffuse staining throughout the cytoplasm, similar to a control eGFP, which is expressed in the cytosol (Fig. 4b), consistent with the Western blot of fractionated cells. Additionally, we examined whether there was a change in localization of CHAC1 by GFP fluorescence (Fig. 4c), V5 immunostaining, or Western blot (data not shown) following treatment with tunicamycin, DTT, thapsigargin, or ox-PAPC. Cells transfected with CHAC1-V5eGFP displayed a cytosolic distribution following UPR induction with tunicamycin, DTT, thapsigargin, or ox-PAPC, not different from untreated controls. These data suggest that CHAC1 protein is contained in the cytosol and not targeted to ER, Golgi, mitochondria, or nuclear compartments and that its localization is not changed following induction of the UPR.
Downstream targets of CHAC1
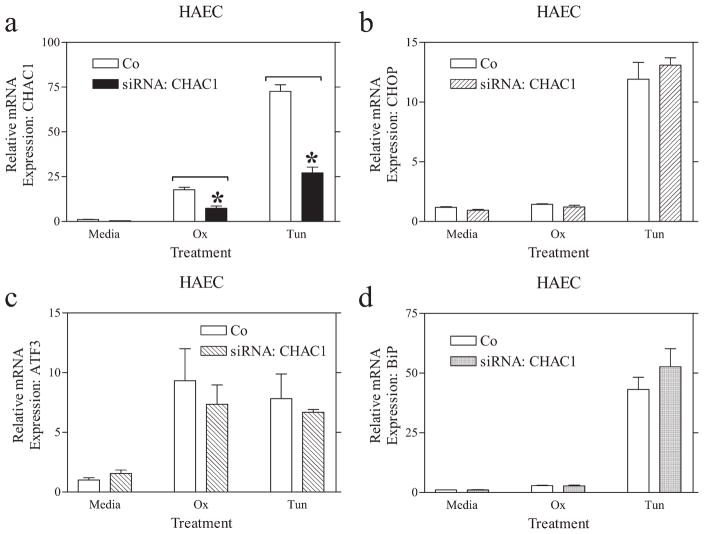
To uncover downstream targets of CHAC1, we transfected cells with a siRNA directed against CHAC1. As demonstrated in Fig. 5, we were able to reduce UPR-induced expression of CHAC1 by >50% using three separate siRNAs (data shown for one siRNA) targeting different regions of CHAC1, compared with a scrambled control. We examined the expression of the ATF4-regulated genes ATF3 and CHOP, and the XBP1/ATF6-activated gene BiP, in cells treated with CHAC1 siRNA. There were no changes in the ox-PAPC- or tunicamycin-induced expression of ATF3, CHOP, or BiP in HAEC following CHAC1 knockdown (Fig. 5). These data indicate that CHAC1 knockdown does not affect the currently known targets of ATF4, and that it likely lies downstream of CHOP in the ATF4-ATF3-CHOP cascade.
FIGURE 5.
CHAC1 siRNA treatment does not affect the expression of CHOP, ATF3, or BiP. Determination of normalized mRNA levels by real-time RT-PCR of (a) CHAC1, (b) CHOP, (c) ATF3, and (d) BiP following transfection with CHAC1-specific siRNA vs scrambled control in HAEC that were untreated (media) vs treated with ox-PAPC (ox) or Tunicamycin (Tun). *, p < 0.01.
To define downstream targets of CHAC1, we next performed mRNA expression arrays on 1) control HAEC transfected with scrambled siRNA, 2) cells transfected with scrambled siRNA with tunicamycin, and 3) cells transfected with the CHAC1 siRNA with tunicamycin. We examined the intersample reproducibility as a measure of the quality of RNA preparation and array protocol. Within each group there was a 0.9 correlation coefficient between expressions of mRNAs within the gene set. Following removal of genes that were expressed at low levels, with a GeneSifter detection score of <0.99, we identified ~10,000 genes that could be accurately quantified. Of these, we first compared the expression of genes induced by the UPR in human endothelial cells and filtered out all candidates that were at least changed 1.5-fold and passed t test analysis, with Benjamini and Hochberg correction (19).
In response to tunicamycin, there was a robust increase in expression of CHAC1, as well as other well-characterized components of the UPR, including GADD45A, GADD45B, GADD34, HERPUD, ERO1L, ERO1Lβ, SLC3A2, SLC7A1, SLC35B1, SLC7A5, SLC39A14, SLC3A2, SLC2A6, PDIA4, PDIA6, PDIA5, HSPA5, XBP1, DNAJB9, DNAJC3, DNAJB11, DNAJC12, DNAJA3, DNAJC16, and IL8 (group 1 vs 2). Interestingly, the transcription factors KLF6 (Kruppel-like factor 6), KLF4, and KLF2 were also induced by tunicamycin, indicating these as potential new components that may play a role in the UPR. In total, 588 genes were selected as being differentially expressed according to our selection criteria stated above (supplemental Table I).4 This is the first definition of the global changes in gene expression in human endothelial cells following UPR induction.
Using similar analysis as above to compare cells treated with CHAC1 siRNA vs scrambled (group 2 vs 3), we identified 227 genes that were differentially expressed based on t test in HAEC treated with tunicamycin (supplemental Table II). Using the CRÉME (creme.dcode.org) algorithm, we searched the transcription factor binding sites enriched in the CHAC1 selected gene list from siRNA treatment compared with control (Table I). These data highlight transcription factors that might be targets of CHAC1, although their respective mRNAs were not affected directly by CHAC1 knockdown, implying posttranscriptional regulation.
Table I.
Putative transcription factors downstream of CHAC1a
| Transcription Factor | p | No. of Genes |
|---|---|---|
| GATA3_03 | 0.000242543 | 8 |
| STAT1_03 | 0.000508342 | 67 |
| AREB6_04 | 0.000575685 | 30 |
| YY1_01 | 0.000725818 | 5 |
| HNF3α_Q6 | 0.00157133 | 19 |
| AP4_Q5 | 0.00218991 | 21 |
| CDXA_01 | 0.00350079 | 47 |
| STAT6_02 | 0.00355877 | 77 |
| STAT5A_03 | 0.00412948 | 60 |
| AP4_Q6 | 0.004432 | 18 |
| STAT_01 | 0.00613769 | 15 |
| IRF1_Q6 | 0.00886876 | 23 |
| NFMUE1_Q6 | 0.0110571 | 6 |
| STAT5A_04 | 0.016443 | 77 |
| MYB_Q6 | 0.0188144 | 19 |
| SRY_01 | 0.0218238 | 44 |
| FAC1_01 | 0.0230942 | 5 |
| SP1_Q6 | 0.024927 | 26 |
| HSF1_01 | 0.0259192 | 6 |
| CAAT_01 | 0.0262597 | 19 |
| SOX5_01 | 0.0332317 | 8 |
| HFH3_01 | 0.0340206 | 9 |
| STAT_Q6 | 0.0438751 | 12 |
| HNF3_Q6 | 0.0452026 | 13 |
List of transcription factors having binding sites that were enriched within the corresponding promoters of genes identified in cells transfected with CHAC1 siRNA vs scrambled control. Analysis was done using the CRÈME algorithm.
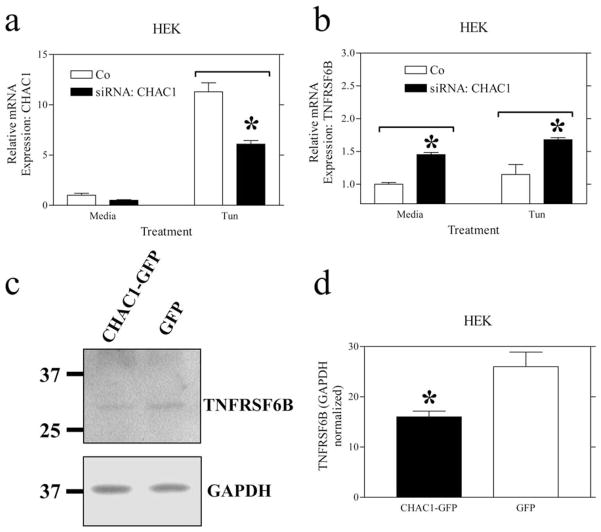
We examined the expression of several candidate mRNAs from the microarray list using real-time RT-PCR, choosing well-defined genes that were likely involved in known pathways. One of the 11 candidates, TNFRSF6B, was validated with real-time RT-PCR using three CHAC1 siRNAs, and the direction of the response to CHAC1 siRNA was the same as determined from the array (Fig. 6). Additionally, we assayed the effects of CHAC1 overexpression on TNFRSF6B protein levels by Western blot and noted a decrease (Fig. 6), consistent with siRNA treatments. TNFRSF6B is a soluble decoy receptor for the proapoptotic FASL pathway (20) and is inhibited by CHAC1.
FIGURE 6.
CHAC1 siRNA treatment activates and overexpression reduces TNFRSF6B. Determination of normalized mRNA levels by real-time RT-PCR of (a) CHAC1 and (b) TNFRSF6B following transfection with CHAC1-specific siRNA vs scrambled control. c and d, Measurement of TNFRSF6B levels by Western blot, normalized to GAPDH in cells transfected with CHAC1-V5eGFP overexpressing plasmid, vs eGFP control. *, p < 0.01.
CHAC1 overexpression promotes, while siRNA inhibition blocks, apoptosis
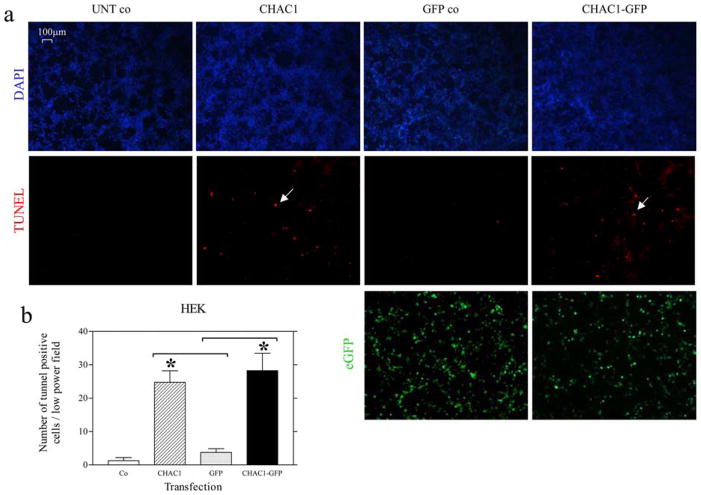
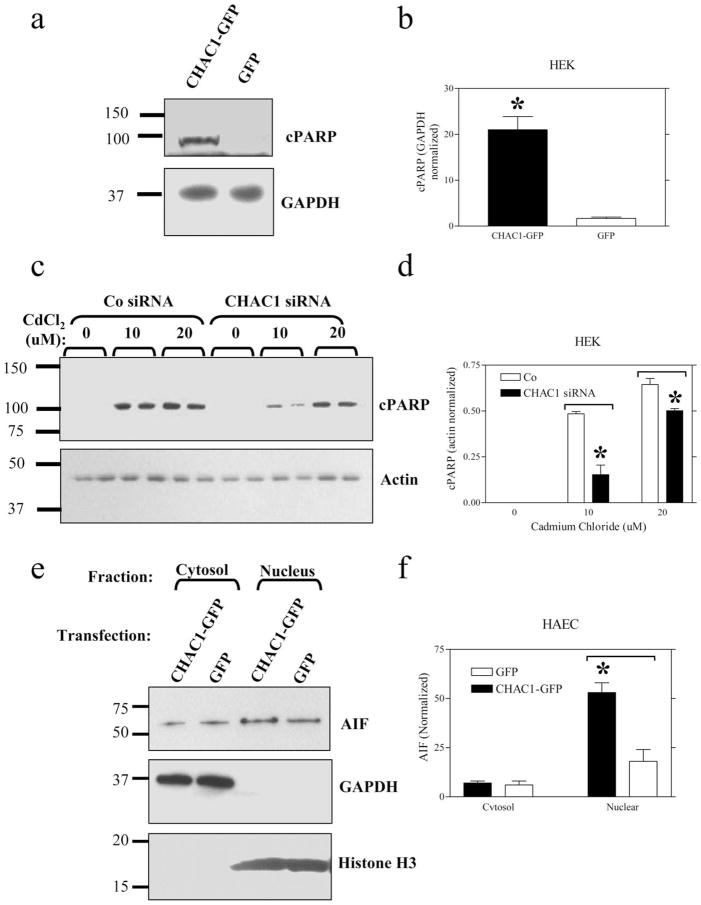
Since we identified CHAC1 as a target of ATF3 and CHOP, known to promote apoptosis (21), and an inhibitor of TNFRSF6B, an antiapoptotic protein (20), we tested whether CHAC1 modulation affected apoptosis. To assay apoptosis, we examined TUNEL staining and the expression of cleaved PARP (cPARP), nuclear AIF, or cleaved caspase-3 in HEK cells transfected with CHAC1 overexpressing plasmid vs control. We noted an increase in TUNEL staining (Fig. 7), cPARP, and AIF nuclear translocation (Fig. 8, a and e) in CHAC1-transfected cells vs GFP control, but no change in caspase-3 cleavage (data not shown). Additionally, we examined the effect of CHAC1 inhibition using a specific siRNA in cells treated with cadmium chloride, an inducer of apoptosis that has been demonstrated to act via induction of UPR components, and JNK phosphorylation (22). There was a specific inhibition of cPARP levels (Fig. 8c) in cells treated with CHAC1 siRNA vs scrambled control. Additionally, we examined the effects of CHAC1 siRNA treatment on apoptosis measures in HEK cells treated with tunicamycin for 48 h, and noted that CHAC1 inhibition caused a decrease in cPARP and nuclear AIF, but no change in caspase-3 activation. These data highlight CHAC1 expression as necessary and sufficient to induce well-characterized markers of apoptosis, TUNEL, cPARP, and AIF nuclear translocation. These data suggest that CHAC1 represents a mechanism that mediates ATF3 or CHOP signaling, involving inhibition of TNFRSF6B, and that sensitizes cells to commit to apoptosis following induction of the UPR pathways.
FIGURE 7.
CHAC1 overexpression induces apoptosis. HEK cells untransfected (UNT co) or transfected with CHAC1-V5 (CHAC1), GFP (GFP co), or CHAC1-V5eGFP (CHAC1-GFP). a, Fluorescent staining of nuclei with DAPI (blue), apoptoic nuclei with TUNEL-rhodamine (red), and GFP (green). Examples of apoptotic nuclei are highlighted with white arrows. b, Quantification of TUNEL-positive nuclei. *, p < 0.01.
FIGURE 8.
CHAC1 overexpression induces, while siRNA treatment reduces, apoptosis. Measurement of cleaved PARP (cPARP) levels by Western blot in (a) cells transfected with CHAC1-V5eGFP overexpression plasmid vs eGFP control normalized to GAPDH, (c) in cells treated with CHAC1 siRNA vs scrambled control, and 0, 10, or 20 μM cadmium chloride, normalized to actin. e, Measurement of cytoplasmic and nuclear AIF levels by Western blot, normalized to GAPDH (Cytosol) or histone H3 (Nucleus) in cells transfected with CHAC1-V5eGFP overexpressing plasmid vs eGFP. b, d, and f, Quantification of band intensities in a, c, and e. *, p < 0.05.
Discussion
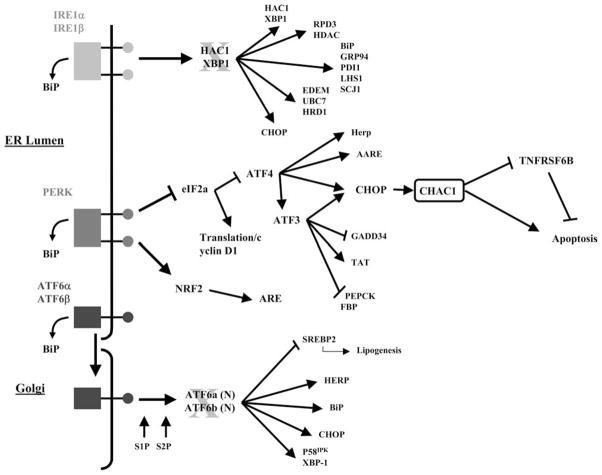
We have characterized the regulation and function of the highly conserved CHAC1 gene and several significant conclusions have emerged. CHAC1 is clearly a UPR-inducible gene regulated by the ATF4 arm of the pathway (Fig. 9). It is downstream of ATF3 and CHOP and may mediate, in part, the proapoptotic effects of these transcription factors. Significantly, our results are highly consistent with the integrative genetics network modeling of the response of a population of HAEC to ox-PAPC.
FIGURE 9.
Schematic showing the proposed position of CHAC1 within the UPR cascade.
CHAC1 is a specific component of the ATF4-ATF3-CHOP signaling pathway and is not directly regulated by the ATF6 or XBP1 arms of the UPR. Inhibition of CHOP was sufficient to prevent UPR-induced CHAC1 expression, while neither XBP1 nor ATF6 knockdown or spliced XBP1 overexpression significantly affected CHAC1 induction. These data suggest the presence of other components that regulate the CHAC1 promoter, since CHOP mRNA can be induced by XBP1 or ATF6. Importantly, these data highlight that XBP1/ATF6 induction of CHOP can result in different sequelae compared with ATF4-ATF3, consistent with reports that demonstrate ATF4 as the dominant factor mediating induction of CHOP (23).
We examined sequences flanking CHAC1 using the online ECR browser (ecrbrowser.dcode.org) and found that elements of the 3′-UTR as well as ~2 kb upstream and downstream of the gene were highly conserved. Scanning the 2-kb region directly upstream of the CHAC1 promoter, we used the MultiTF algorithm (multitf. dcode.org) to identify regions likely to be bound by transcription factors ATF4, ATF3, and CHOP. We found a putative ATF binding site that was in an orthologous block ~250 bp upstream of the start site of the CHAC1 gene (TTGCATCAC), conserved from human to mouse. This promoter element is similar in sequence and location to a known UPR-inducible element within the CHOP promoter (24). This suggests that the CHAC1 gene may be directly regulated by ATF4, ATF3, and CHOP following UPR induction. Additionally, in vivo studies with genetically randomized mice (344 F2 progeny from a cross between C57BL/6J and C3H/HeJ) indicated a strong correlation between CHAC1 and ATF4, ATF3, and CHOP expression, analogous to the results obtained from the human HAEC population.
Collectively, these data suggest that regulation of the CHAC1 promoter is complex. Our current model places CHAC1 as a direct target of CHOP; however, direct transcriptional effects of ATF4 and ATF3 are also suggested. These interactions provide a possible explanation why CHAC1 expression is more closely correlated with ATF4 than ATF3, CHOP, XBP1, or ATF6 in our study populations. Moreover, these data strengthen the validity of the network model and highlight how mRNA coexpression networks have functional underpinnings and can uncover complex relationships compared with examinations of linear cell signaling pathways.
Based on studies of C-terminal tagged CHAC1, this protein is expressed primarily in the cytoplasm, compared with the nucleus, ER-Golgi sectretory apparatus, or mitochondria. Additionally, its localization is not changed following treatment with chemical UPR inducers, suggesting that it functions in this compartment. These data are consistent with the predicted three-dimensional structure using the Phyre algorithm, and they suggest that CHAC1 is a soluble peptide. Our future studies aim to determine molecular functions of CHAC1, and we will explore possible interactions with other proteins and effects on ER-associated degradation of misfolded proteins.
We performed microarray analyses of mammalian HAEC in the presence and absence of chemical UPR induction with tunicamycin, the first systematic examination of the global mRNA response to UPR induction in human endothelial cells. In addition to well-characterized UPR pathway components (9), we noted previously unidentified genes that are significantly induced by UPR activation, such as KLF transcription factors.
We defined the global mRNA profile for cells treated with CHAC1 siRNA and verified a subset of these results by real-time PCR. TNFRSF6B, one of the candidates identified by microarray, showed a consistent change when assayed by real-time PCR. Interestingly, this gene was not identified in the chemical UPR induction dataset compared with control, but mRNA expression levels were altered as a result of CHAC1 siRNA treatment. These data suggest that the functions of CHAC1 may represent a boundary between UPR-mediated and other pathways, and that CHAC1 may have other functions independent of the UPR.
We noted that CHAC1 siRNA treatment was sufficient to activate the expression of TNFRSF6B. This protein is a soluble decoy receptor of the proapoptotic FASL (20), an important signaling mechanism in the activation of apoptosis in endothelial cells by macrophages. We examined the effect of CHAC1 overexpression and inhibition on apoptosis in HEK cells and HAEC. Interestingly, we noted augmentation of TUNEL staining, cPARP, and AIF nuclear translocation, but not caspase-3 cleavage, following CHAC1 overexpression. These data suggest that CHAC1 can modulate the AIF-PARP apoptotic pathway, but the parallel caspase-3-dependent cascade is not affected.
There are several proposed mechanisms that contribute to apoptosis following UPR activation. Caspase-12 is the prototypical UPR-inducible pathway in mice, which leads to caspase-3 activation (25, 26), but this protein is nonfunctional in humans (27). CHOP is known to activate apoptosis; however, the downstream mechanism has not been completely characterized. There are data suggesting that CHOP may act through inhibiting Bcl-2 (28), activating Bax (29), or changing the redox status by activating GADD34 and Ero1α (30). This is consistent with our data and suggests that the cleavage of PARP and translocation of AIF are also events associated with CHOP-dependent induction of apoptosis. Also, our data suggest that these pathways occur as a result of the induction of CHOP by ATF4, and not by XBP1 or ATF6, and they highlight the presence of two separate mechanisms that can transduce UPR-dependent apoptotic signaling.
These data highlight CHAC1 as a novel target for modulating the AIF-PARP apoptosis pathway in disease. Also, inhibiting TNFRSF6b (antiapoptotic) is a mechanism whereby CHAC1 activation contributes to apoptosis. Collectively, these data suggest that CHAC1 activation may augment endothelial cell apoptosis in response to oxidized phospholipids. More generally, these data suggest that CHAC1 may be an important downstream target of the ATF4-ATF3-CHOP pathway that promotes apoptosis.
Footnotes
I.N.M. was supported by the Heart and Stroke Foundation of Canada and by Canadian Institutes of Health Research postdoctoral fellowships. This work was supported by National Institutes of Health Grant HL30568.
Abbreviations used in this paper: ox-PAPC, oxidized 1-palmitoyl-2-arachidonyl-sn-3-glycero-phosphorylcholine; AIF, apoptosis-inducing factor; ATF, activating transcription factor; CHAC1, cation transport regulator-like protein 1; CHOP, C/EBP homologous protein; cPARP, cleaved PARP; DAPI, 4′,6-diamidino-2-phenylindole; eGFP, enhanced GFP; ER, endoplasmic reticulum; HAEC, human aortic endothelial cells; KLF, Kruppel-like factor; PARP, poly(ADP-ribose) polymerase; siRNA, small interfering RNA; TNFRSF6B, tumor necrosis factor receptor superfamily, member 6b, a FASL decoy receptor; UPR, unfolded protein response; XBP1, X box-binding protein 1.
The online version of this article contains supplemental material.
Disclosures
The authors have no financial conflicts of interest.
References
- 1.Ghazalpour A, Doss S, Sheth SS, Ingram-Drake LA, Schadt EE, Lusis AJ, Drake TA. Genomic analysis of metabolic pathway gene expression in mice. Genome Biol. 2005;6:R59. doi: 10.1186/gb-2005-6-7-r59. [DOI] [PMC free article] [PubMed] [Google Scholar]
- 2.Ghazalpour A, Doss S, Zhang B, Wang S, Plaisier C, Castellanos R, Brozell A, Schadt EE, Drake TA, Lusis AJ, Horvath S. Integrating genetic and network analysis to characterize genes related to mouse weight. PLoS Genet. 2006;2:e130. doi: 10.1371/journal.pgen.0020130. [DOI] [PMC free article] [PubMed] [Google Scholar]
- 3.Chen Y, Zhu J, Lum PY, Yang X, Pinto S, MacNeil DJ, Zhang C, Lamb J, Edwards S, Sieberts SK, et al. Variations in DNA elucidate molecular networks that cause disease. Nature. 2008;452:429–435. doi: 10.1038/nature06757. [DOI] [PMC free article] [PubMed] [Google Scholar]
- 4.Fuller TF, Ghazalpour A, Aten JE, Drake TA, Lusis AJ, Horvath S. Weighted gene coexpression network analysis strategies applied to mouse weight. Mamm Genome. 2007;18:463–472. doi: 10.1007/s00335-007-9043-3. [DOI] [PMC free article] [PubMed] [Google Scholar]
- 5.Gargalovic PS, Gharavi NM, Clark MJ, Pagnon J, Yang WP, He A, Truong A, Baruch-Oren T, Berliner JA, Kirchgessner TG, Lusis AJ. The unfolded protein response is an important regulator of inflammatory genes in endothelial cells. Arterioscler Thromb Vasc Biol. 2006;26:2490–2496. doi: 10.1161/01.ATV.0000242903.41158.a1. [DOI] [PubMed] [Google Scholar]
- 6.Gargalovic PS, Imura M, Zhang B, Gharavi NM, Clark MJ, Pagnon J, Yang WP, He A, Truong A, Patel S, et al. Identification of inflammatory gene modules based on variations of human endothelial cell responses to oxidized lipids. Proc Natl Acad Sci USA. 2006;103:12741–12746. doi: 10.1073/pnas.0605457103. [DOI] [PMC free article] [PubMed] [Google Scholar]
- 7.Wang S, Yehya N, Schadt EE, Wang H, Drake TA, Lusis AJ. Genetic and genomic analysis of a fat mass trait with complex inheritance reveals marked sex specificity. PLoS Genet. 2006;2:e15. doi: 10.1371/journal.pgen.0020015. [DOI] [PMC free article] [PubMed] [Google Scholar]
- 8.Wang SS, Schadt EE, Wang H, Wang X, Ingram-Drake L, Shi W, Drake TA, Lusis AJ. Identification of pathways for atherosclerosis in mice: integration of quantitative trait locus analysis and global gene expression data. Circ Res. 2007;101:e11–e30. doi: 10.1161/CIRCRESAHA.107.152975. [DOI] [PubMed] [Google Scholar]
- 9.Travers KJ, Patil CK, Wodicka L, Lockhart DJ, Weissman JS, Walter P. Functional and genomic analyses reveal an essential coordination between the unfolded protein response and ER-associated degradation. Cell. 2000;101:249–258. doi: 10.1016/s0092-8674(00)80835-1. [DOI] [PubMed] [Google Scholar]
- 10.Ivey DM, Guffanti AA, Zemsky J, Pinner E, Karpel R, Padan E, Schuldiner S, Krulwich TA. Cloning and characterization of a putative Ca2+/H+ antiporter gene from Escherichia coli upon functional complementation of Na+/H+ antiporter-deficient strains by the overexpressed gene. J Biol Chem. 1993;268:11296–11303. [PubMed] [Google Scholar]
- 11.Radchenko MV, Waditee R, Oshimi S, Fukuhara M, Takabe T, Nakamura T. Cloning, functional expression and primary characterization of Vibrio parahaemolyticus K+/H+ antiporter genes in Escherichia coli. Mol Microbiol. 2006;59:651–663. doi: 10.1111/j.1365-2958.2005.04966.x. [DOI] [PubMed] [Google Scholar]
- 12.Radchenko MV, Tanaka K, Waditee R, Oshimi S, Matsuzaki Y, Fukuhara M, Kobayashi H, Takabe T, Nakamura T. Potassium/proton antiport system of Escherichia coli. J Biol Chem. 2006;281:19822–19829. doi: 10.1074/jbc.M600333200. [DOI] [PubMed] [Google Scholar]
- 13.DiPolo R, Beauge L. Sodium/calcium exchanger: influence of metabolic regulation on ion carrier interactions. Physiol Rev. 2006;86:155–203. doi: 10.1152/physrev.00018.2005. [DOI] [PubMed] [Google Scholar]
- 14.Schroder M, Kaufman RJ. The mammalian unfolded protein response. Annu Rev Biochem. 2005;74:739–789. doi: 10.1146/annurev.biochem.73.011303.074134. [DOI] [PubMed] [Google Scholar]
- 15.Bernales S, Papa FR, Walter P. Intracellular signaling by the unfolded protein response. Annu Rev Cell Dev Biol. 2006;22:487–508. doi: 10.1146/annurev.cellbio.21.122303.120200. [DOI] [PubMed] [Google Scholar]
- 16.Schroder M, Kaufman RJ. Divergent roles of IRE1α and PERK in the unfolded protein response. Curr Mol Med. 2006;6:5–36. doi: 10.2174/156652406775574569. [DOI] [PubMed] [Google Scholar]
- 17.Ito D, Walker JR, Thompson CS, Moroz I, Lin W, Veselits ML, Hakim AM, Fienberg AA, Thinakaran G. Characterization of stanniocalcin 2, a novel target of the mammalian unfolded protein response with cytoprotective properties. Mol Cell Biol. 2004;24:9456–9469. doi: 10.1128/MCB.24.21.9456-9469.2004. [DOI] [PMC free article] [PubMed] [Google Scholar]
- 18.Kelley LA, MacCallum RM, Sternberg MJ. Enhanced genome annotation using structural profiles in the program 3D-PSSM. J Mol Biol. 2000;299:499–520. doi: 10.1006/jmbi.2000.3741. [DOI] [PubMed] [Google Scholar]
- 19.Reiner A, Yekutieli D, Benjamini Y. Identifying differentially expressed genes using false discovery rate controlling procedures. Bioinformatics. 2003;19:368–375. doi: 10.1093/bioinformatics/btf877. [DOI] [PubMed] [Google Scholar]
- 20.Pitti RM, Marsters SA, Lawrence DA, Roy M, Kischkel FC, Dowd P, Huang A, Donahue CJ, Sherwood SW, Baldwin DT, et al. Genomic amplification of a decoy receptor for Fas ligand in lung and colon cancer. Nature. 1998;396:699–703. doi: 10.1038/25387. [DOI] [PubMed] [Google Scholar]
- 21.Oyadomari S, Mori M. Roles of CHOP/GADD153 in endoplasmic reticulum stress. Cell Death Differ. 2004;11:381–389. doi: 10.1038/sj.cdd.4401373. [DOI] [PubMed] [Google Scholar]
- 22.Yokouchi M, Hiramatsu N, Hayakawa K, Kasai A, Takano Y, Yao J, Kitamura M. Atypical, bidirectional regulation of cadmium-induced apoptosis via distinct signaling of unfolded protein response. Cell Death Differ. 2007;14:1467–1474. doi: 10.1038/sj.cdd.4402154. [DOI] [PubMed] [Google Scholar]
- 23.Fawcett TW, Martindale JL, Guyton KZ, Hai T, Holbrook NJ. Complexes containing activating transcription factor (ATF)/cAMP-responsive-element-binding protein (CREB) interact with the CCAAT/enhancer-binding protein (C/EBP)-ATF composite site to regulate Gadd153 expression during the stress response. Biochem J. 1999;339:135–141. [PMC free article] [PubMed] [Google Scholar]
- 24.Kim SH, Hwang CI, Juhnn YS, Lee JH, Park WY, Song YS. GADD153 mediates celecoxib-induced apoptosis in cervical cancer cells. Carcinogenesis. 2007;28:223–231. doi: 10.1093/carcin/bgl227. [DOI] [PubMed] [Google Scholar]
- 25.Morishima N, Nakanishi K, Takenouchi H, Shibata T, Yasuhiko Y. An endoplasmic reticulum stress-specific caspase cascade in apoptosis: cytochrome c-independent activation of caspase-9 by caspase-12. J Biol Chem. 2002;277:34287–34294. doi: 10.1074/jbc.M204973200. [DOI] [PubMed] [Google Scholar]
- 26.Nakagawa T, Zhu H, Morishima N, Li E, Xu J, Yankner BA, Yuan J. Caspase-12 mediates endoplasmic-reticulum-specific apoptosis and cytotoxicity by amyloid-β. Nature. 2000;403:98–103. doi: 10.1038/47513. [DOI] [PubMed] [Google Scholar]
- 27.Fischer H, Koenig U, Eckhart L, Tschachler E. Human caspase 12 has acquired deleterious mutations. Biochem Biophys Res Commun. 2002;293:722–726. doi: 10.1016/S0006-291X(02)00289-9. [DOI] [PubMed] [Google Scholar]
- 28.McCullough KD, Martindale JL, Klotz LO, Aw TY, Holbrook NJ. Gadd153 sensitizes cells to endoplasmic reticulum stress by down-regulating Bcl2 and perturbing the cellular redox state. Mol Cell Biol. 2001;21:1249–1259. doi: 10.1128/MCB.21.4.1249-1259.2001. [DOI] [PMC free article] [PubMed] [Google Scholar]
- 29.Gotoh T, Terada K, Oyadomari S, Mori M. hsp70-DnaJ chaperone pair prevents nitric oxide- and CHOP-induced apoptosis by inhibiting translocation of Bax to mitochondria. Cell Death Differ. 2004;11:390–402. doi: 10.1038/sj.cdd.4401369. [DOI] [PubMed] [Google Scholar]
- 30.Marciniak SJ, Yun CY, Oyadomari S, Novoa I, Zhang Y, Jungreis R, Nagata K, Harding HP, Ron D. CHOP induces death by promoting protein synthesis and oxidation in the stressed endoplasmic reticulum. Genes Dev. 2004;18:3066–3077. doi: 10.1101/gad.1250704. [DOI] [PMC free article] [PubMed] [Google Scholar]


