SYNOPSIS
Objectives
Public health surveillance is often dependent on sentinel testing performed in clinical microbiology laboratories, and recognition of emerging/unusual antimicrobial resistance is especially challenging. We obtained cumulative antibiograms from hospitals to determine whether clinical laboratories recognized unusual resistance or reported antimicrobials inappropriate for various bacterial species, as measured before and after public health laboratory (PHL) educational and technical-support interventions.
Methods
We compared cumulative antibiogram data from 81 clinical laboratories servicing 86 hospitals in Michigan from 2000 through 2005 with a standardized checklist derived from Clinical and Laboratory Standards Institute (CLSI) antimicrobial susceptibility testing (AST) documents. We considered the reporting of unlikely percent-susceptible results and/or inappropriate antimicrobials serious errors, and we calculated error rates for each data year. We used CLSI-recommendation compliance as a measure to determine whether laboratories were implementing changes.
Results
Ninety-five of 239 (28%) cumulative antibiograms examined had one or more serious errors. The annual number of cumulative antibiograms with serious errors did not change radically (range: 10–13); however, when expressed as a percentage of cumulative antibiograms received, the occurrence of these errors declined from 59% in 2000 to 19% in 2005. The reporting of misleading or dangerous antimicrobial-organism combinations occurred less frequently than the reporting of unlikely percent-susceptible results. Compliance with new CLSI recommendations did not improve significantly.
Conclusions
AST is complex and nuanced. PHL programs can provide resources, guidance, and technical support to help clinical microbiologists differentiate questionable AST results from true emerging antimicrobial resistance.
In most state public health systems, communicable disease surveillance not only depends on the ability of sentinel clinical laboratories in the community to recognize and identify organisms of concern, but also relies on their cooperation in reporting results and referring specimens to public health laboratories (PHLs) for confirmatory testing and outbreak investigation. This process is fairly well established for foodborne disease agents such as Salmonella and for suspect bioterrorism agents, but is less well defined for unusual or novel antimicrobial resistance surveillance.
The world's first confirmed vancomycin-resistant Staphylococcus aureus (S. aureus) (VRSA), recovered in Michigan in 2002, demonstrated the role of PHLs in investigating and controlling emerging antimicrobial resistance. As vancomycin is often used for treatment of resistant S. aureus infections, spread of VRSA into the community would have enormous therapeutic and economic implications. This single isolate from a diabetic patient's foot wound prompted intensive epidemiologic investigation and surveillance by public health agencies, including local and state health departments and the Centers for Disease Control and Prevention (CDC), and highlighted the importance of the clinical laboratory's ability to recognize unusual results.1
Recognition of unusual or novel antimicrobial resistance is challenging for a number of reasons. Laboratory testing for detecting antimicrobial resistance is highly complex and becoming more so; changes in technique and/or methodology may be required as organisms acquire new resistance mechanisms. Laboratories increasingly rely on automated antimicrobial susceptibility testing (AST) instruments, and may depend on manufacturers to incorporate recommended changes. Many laboratories now use “expert” software as part of the laboratory diagnostic test system or information system to recognize questionable results, because laboratory workforce shortages have resulted in fewer experienced microbiologists with the necessary skills to interpret and report results accurately.
These concerns led to a hypothesis that clinical laboratories need additional guidance in AST practices. In 2002, the Michigan Department of Community Health (MDCH) Bureau of Laboratories implemented a strategy of education, communication, and provision of technical support and resources for clinical laboratories, dedicating one full-time, experienced clinical microbiologist to a multiyear initiative to promote AST laboratory standards and evaluate adherence to laboratory practice guidelines.
METHODS
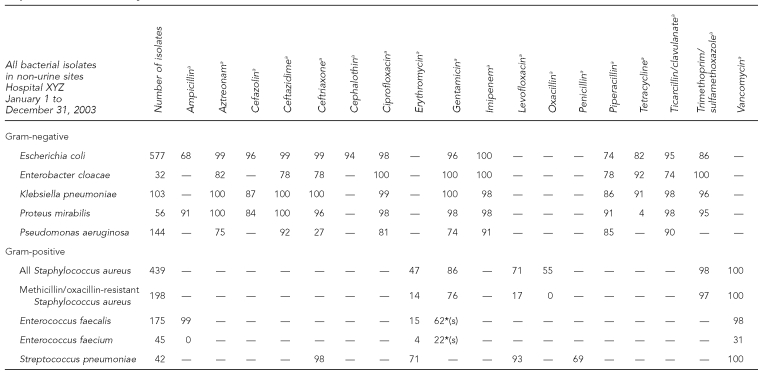
To determine if new trends in antimicrobial resistance were developing in Michigan without adding the burden of reporting additional data, MDCH requested cumulative antibiograms from clinical laboratories. These statistical reports are routinely prepared by compiling individual patient culture and sensitivity results over a defined period of time (usually one year) into an aggregate picture of the various isolated species and their susceptibility/resistance patterns. The data are typically presented as the percentage of each species that is susceptible to various antimicrobial agents on the hospital pharmacy formulary. Generally in a tabular format, the data are distributed to the medical staff by clinical laboratories and/or pharmacies to aid in empirical therapy. An example is provided in Figure 1.
Figure 1.
Example (fictitious data) of a cumulative hospital antibiogram submitted by clinical laboratories to the Michigan Department of Community Health, 2000–2005
aValue indicates percent susceptible for each organism-antimicrobial combination. Percent susceptible was generated by including the first isolate of that organism encountered on a given patient.
— = Drug not tested or not indicated
*(s) = Synergy with cell-wall agent; do not use alone
During review of the cumulative antibiograms, we noted unexpected anomalies, such as improbable resistance patterns not reported in the literature to date and not reported to MDCH as required by the Michigan Communicable Disease Rules.2 These findings suggested that clinical laboratories may have difficulty recognizing emerging/unusual resistance and keeping up with corresponding changes in testing recommendations. Considering the antibiogram data are derived from patient reports, this was of great concern to us, as the reporting of an incorrect result, whether susceptible or resistant, can lead to the prescribing of inappropriate or ineffective antimicrobial therapy and possibly less-than-optimal outcomes.
Therefore, MDCH undertook a systematic analysis of the cumulative antibiograms, comparing them with documents from the Clinical and Laboratory Standards Institute (CLSI, formerly the National Committee for Clinical Laboratory Standards), including the first published standardized guideline, document M39-A: “Analysis and Presentation of Cumulative Antimicrobial Susceptibility Test Data; Approved Guideline—First Edition” (2002); and document M100-S12: “Performance Standards for Antimicrobial Susceptibility Testing; 12th Informational Supplement” (2002).3,4
We used results of the analysis to develop educational presentations and materials intended to raise awareness of changing antimicrobial resistance patterns and the tools for detecting them. MDCH also purchased and distributed AST-related CLSI documents, including M2, M7, M39, and M100, to the sentinel clinical microbiology laboratories in Michigan.3–6 We predicted that increasing awareness of and compliance with these standards and guidelines would result in a decrease in the number and type of irregularities noted in Michigan hospital cumulative antibiograms, reflecting an increasing accuracy of the AST and reporting data from which cumulative antibiograms are constructed.
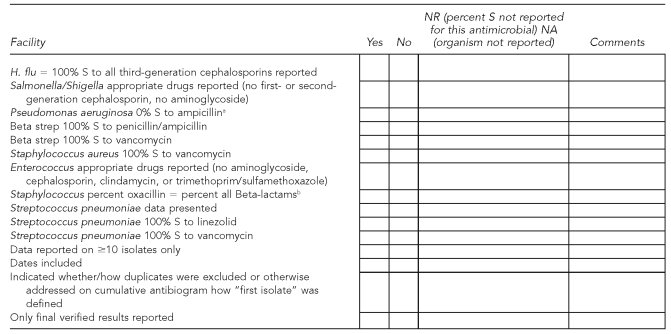
Approximately 110 Michigan clinical laboratories perform AST. MDCH initially asked these laboratories to submit on a voluntary basis cumulative antibiograms from 2000 and 2001 as a baseline to compare with data from 2002. Assuring laboratories of anonymity, we requested a cumulative antibiogram each year thereafter via the MDCH laboratory quarterly newsletter and direct fax. In 2004, we added the submission of cumulative antibiogram data to yearly requirements for participation as a sentinel laboratory in the Michigan Laboratory Response Network. We examined cumulative antibiograms from 2000 through 2005 for this study, using CLSI AST document M100-S12 to develop a standardized checklist of unlikely percent-susceptible results and antimicrobials that should not be reported on certain organisms (Figure 2).
Figure 2.
Checklist used by the Michigan Department of Community Health to examine cumulative hospital antibiograms submitted by clinical laboratories, 2000–2005
aFor results that are 0% S, an acceptable alternative is to omit any percent S data and indicate “-” in the cell on the cumulative antibiogram report. This checklist item was noted only if a laboratory reported percent S other than 0 for Pseudomonas aeruginosa vs. ampicillin.
bExcluding Beta-lactams that are penicillinase-labile agents: ampicillin, amoxicillin, and penicillin
S = susceptible
For purposes of analysis, we considered the reporting of improbable or impossible percent-susceptibility results or the reporting of misleading or inappropriate organism-antimicrobial combinations as serious errors. These errors were of greatest concern because of their potential adverse impact on patient care. We also noted a number of minor errors which, although not included in our checklist, were difficult to ignore. These included misspelled organism names or antimicrobial agents and obvious math calculation errors. Minor errors were unlikely to have any adverse impact on individual patient care.7
Beginning in 2003 and each year thereafter when new editions appeared, MDCH purchased CLSI AST documents for all sentinel laboratories and provided educational materials on these standards and guidelines at regional presentations, collaborative meetings, and wet workshops. The hands-on wet workshops allowed participants to examine culture plates and other materials set up as case studies, to demonstrate the correct reading and interpretation of susceptibility test results. We also wrote articles for our laboratory newsletters and sent timely e-mail updates as issues related to AST and reporting emerged. It seemed likely that testing practices would improve and occurrence of cumulative antibiogram errors would decrease as awareness and implementation of AST standards and guidelines increased; therefore, we chose to track error rates as an objective way to measure the effectiveness of our education, communication, and technical-support strategies. We also calculated error rates for hospitals according to bed size, using data from the American Hospital Association.8
In addition to determining error rates, we compared cumulative antibiograms with selected recommendations from CLSI document M39-A to measure how readily clinical laboratories were adopting the new guidelines. The checklist we designed and the parameters used for the analysis are shown in Figure 2.
RESULTS
During the six-year period, 95 of 110 (86%) clinical laboratories responded by providing cumulative antibiograms from 100 hospitals. (Many larger laboratories performed testing for several hospitals and analyzed data separately for each.) For consistency, although they were analyzed by the same laboratory, cumulative antibiograms were counted separately if they were clearly printed and distributed as facility-specific reports and not shared system-wide. We excluded 42 raw-data summaries printed directly from automated instruments in 14 hospital laboratories, as it was unlikely that these data were distributed to physicians.
We analyzed a total of 239 cumulative antibiograms: 17 from 2000, 26 from 2001, 34 from 2002, 44 from 2003, 54 from 2004, and 64 from 2005. The same hospitals did not submit data each year: we received cumulative antibiograms (excluding instrument raw data) for a single year from 16 hospitals; two years from 15; three years from 20; four years from 12; five years from 11; and for all six years from only five hospitals.
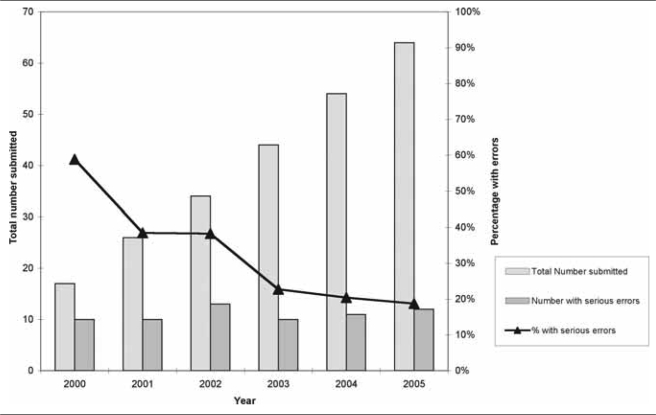
Serious errors occurred each year but decreased. Fifty--nine percent of cumulative antibiograms from 2000 contained one or more serious errors, 38% from 2001 and 2002, 23% from 2003, 20% from 2004, and 19% from 2005. Figure 3 and the Table illustrate the total number of cumulative antibiograms submitted and the percentage with serious errors for 2000 to 2005.
Figure 3.
Number and percentage of cumulative hospital antibiograms submitted by clinical laboratories to the Michigan Department of Community Health with serious errors, 2000–2005
Table.
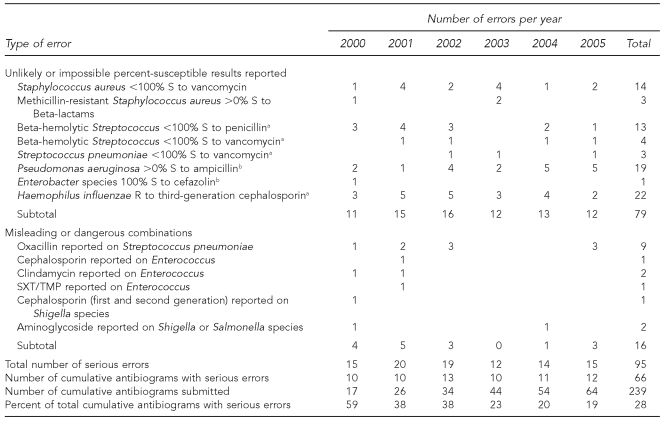
Number and type of serious errors in cumulative hospital antibiograms submitted by clinical laboratories to the Michigan Department of Community Health, 2000–2005
aNone confirmed in literature to date
bPatterns extremely unlikely
S = susceptible
R = resistant
SXT/TMP = sulfamethoxazole/trimethoprim
Eight unlikely or impossible percent-susceptible results were reported on cumulative antibiograms from 2000 to 2005. These patterns included Beta-hemolytic streptococci that were not susceptible to penicillin or vancomycin; Streptococcus pneumoniae not susceptible to vancomycin; and Haemophilus influenzae not susceptible to third-generation cephalosporins—none of which has been confirmed in the literature to date.4 Other unlikely patterns included methicillin-resistant S. aureus (MRSA) isolates reported as susceptible to Beta-lactam antimicrobials, Pseudomonas aeruginosa isolates susceptible to ampicillin, and Enterobacter species susceptible to cefazolin. Finally, although two of the four isolates of VRSA reported globally from 2002 to 2005 were confirmed in Michigan, cumulative antibiogram data would indicate that 14 additional laboratories encountered VRSA, which was neither reported to nor confirmed by the MDCH laboratory.
Misleading or dangerous combinations reported by laboratories during this period included antimicrobials inappropriate for treating Enterococcus infections (cephalosporin, clindamycin, and trimethoprim/sulfamethoxazole); oxacillin results on Streptococcus pneumoniae (a surrogate test for penicillin susceptibility, oxacillin itself should not be reported); and antimicrobials inappropriate for treating Salmonella and Shigella infections (first- or second-generation cephalosporins and aminoglycosides). More than half of these serious errors (n=52) occurred in cumulative antibiograms from hospitals with <100 beds located in small communities or rural areas of the state. Twenty-eight serious errors were noted in cumulative antibiograms from hospitals with >500 beds located in large urban areas. The remaining 15 errors were found in cumulative antibiograms from hospitals with 100–250 beds and were evenly split between rural and urban hospitals (data not shown). The Table outlines the number and type of serious errors found.
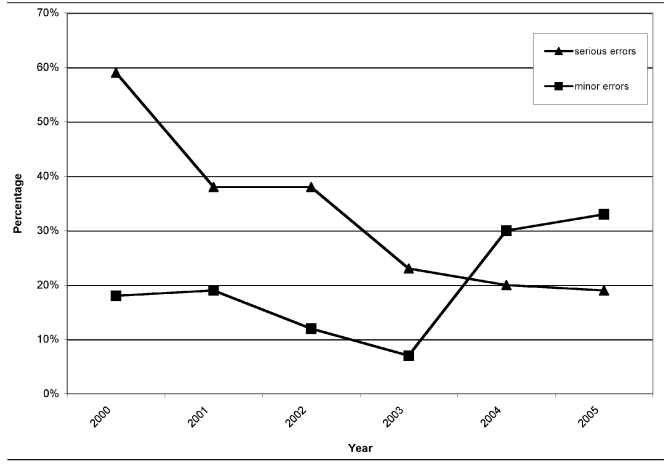
There were also a number of errors that we categorized as minor: misspellings of microorganism names or antimicrobial agents and obvious calculation errors. While unlikely to affect prescribing practices, these errors may indicate that laboratories should review cumulative antibiograms before distribution and, thus, were noted. Figure 4 compares percentages of serious and minor errors in cumulative antibiograms from 2000 through 2005.
Figure 4.
Percentage of cumulative hospital antibiograms submitted by clinical laboratories to the Michigan Department of Community Health with serious and minor errors, 2000–2005
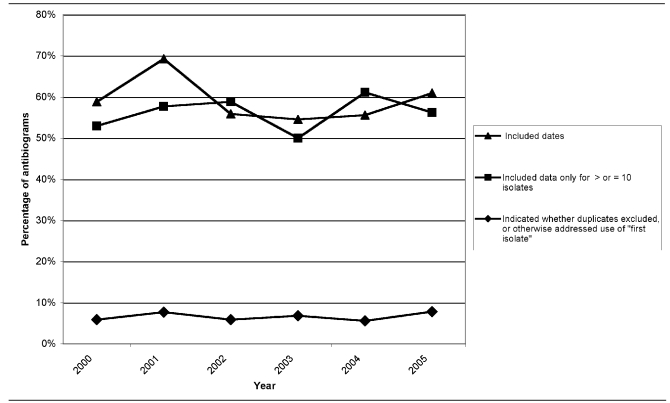
An easily implemented recommendation of M39-A is to indicate the period of time the susceptibility data were collected by printing inclusive dates on the cumulative antibiogram. The number of laboratories adopting this recommendation increased each year (10 in 2000, 18 in 2001, 19 in 2002, 24 in 2003, 30 in 2004, and 39 in 2005). However, when expressed as a percentage of cumulative antibiograms received, progress in adopting this recommendation fluctuated, due to the increasing number of facilities submitting data (59% in 2000, 69% in 2001, 56% in 2002, 55% in 2003, 56% in 2004, and 61% in 2005).
The 2002 version of M39-A recommends that laboratories calculate the percent susceptible for a particular organism only when data exist for at least 10 isolates of that organism. (In the 2005 version, M39-A2, the recommended number of isolates increased to 30.)9 Again, the number of laboratories implementing this recommendation increased every year (nine in 2000, 15 in 2001, 20 in 2002, 22 in 2003, 33 in 2004, and 36 in 2005); however, because the number submitted each year also increased, the percentage of cumulative antibiograms adhering to the recommendation decreased for 2003 and 2005 (53% in 2000, 58% in 2001, 59% in 2002, 50% in 2003, 61% in 2004, and 56% in 2005).
Perhaps one of the recommendations most difficult to implement in M39-A is to include only the first isolate of a microorganism from a patient in the data analysis. Both the number and percentage of cumulative antibiograms indicating whether duplicates were excluded or, at a minimum, explaining this issue in footnotes remained essentially unchanged during the period. Antibiogram compliance with these three recommendations is outlined in Figure 5.
Figure 5.
Compliance of cumulative hospital antibiograms submitted by clinical laboratories to the Michigan Department of Community Health with three recommendations from CLSI M39-A guideline, 2000–2005
CLSI = Clinical and Laboratory Standards Institute
DISCUSSION
The primary purpose of the cumulative antibiogram is to guide community clinicians in choosing empirical antimicrobial therapy during the 48- to 72-hour period before specific culture and sensitivity results are available.10,11 There were no standardized guidelines for preparing cumulative antibiograms prior to 2002, although the practice was common and had been well established for many years prior in most hospitals.12 Consequently, considerable variation exists in the data from one hospital to another,13 confounding our original purpose of using these data to construct a picture of resistance trends in Michigan.
The coincidental finding of errors in the cumulative antibiograms supported our hypothesis that some clinical laboratories need additional guidance in keeping up with the rapid changes in AST methods and interpretation. Although the percentage of cumulative antibiograms with serious errors decreased over time after MDCH provided the CLSI documents, at least 10 cumulative antibiograms each year included unlikely percent-susceptible results and/or inappropriate antimicrobials reported for some organisms (range: 10–13).
These findings are troubling from a clinical standpoint alone due to their impact on individual patient care, implications for empirical therapy, and influence on hospital formulary decision-making.14 But they should also raise concern for public health, because they represent possible gaps in clinical laboratory capacity to recognize and report emerging or novel antimicrobial resistance.
For example, it is highly improbable that there were actually 14 additional VRSA cases reported to physicians but not reported to MDCH from 2000 through 2005. What likely occurred is that the laboratories performed repeat testing on these unusual isolates but could not confirm the initial result; thus, no vancomycin resistance was reported. Cumulative antibiogram data in some laboratories may have been derived from automated testing instruments instead of laboratory computer information systems, and if the original incorrect results were not deleted from instrument data, they may have been included in the cumulative statistical analysis. We were not able to verify this explanation, but it could account for several of the anomalies noted, and it is an issue to address because it could present an inaccurate picture of local resistance. This and other studies indicate that infectious disease specialists, clinical microbiologists, and infection-control professionals should review cumulative antibiograms to identify and correct these abnormal findings and potential errors prior to distribution.14
Other authors have reported suboptimal AST practices, underscoring the complexity of AST and reporting and demonstrating the need for ongoing education and quality-assurance activities.15–17 Promotion and explanation of guidelines, intervention and motivation strategies, and training activities provided by CDC and state PHLs have all shown to be effective in improving AST and reporting.18,19 Clinical laboratory improvement has been identified as a Core Function of State Public Health Laboratories,20 and the results of this study support previous findings suggesting that PHLs can play a key role in providing guidance and support to clinical laboratories in the area of AST.18
The errors noted on cumulative antibiograms prompted MDCH to focus 2002–2003 outreach efforts on recognition of unusual resistance and the importance of verifying each patient result before releasing the laboratory report. We incorporated these topics into regional all-day workshops and sentinel laboratory update meetings, which took place in Michigan, and, beginning in 2002, the CLSI AST-related documents we provided to clinical laboratories included summary tables of unusual results requiring further verification. Reporting of misleading or dangerous antimicrobial-organism combinations on cumulative antibiograms decreased each study year through 2003, when none were noted. The reappearance of this type of error in 2004 and 2005 data could be explained by the participation of additional hospitals that had not previously submitted cumulative antibiograms; however, it also could indicate a need for ongoing education in AST practices. For example, PHL programs could assist smaller laboratories in orienting new microbiology staff.
More than half (52/95, 55%) of the serious errors occurred in cumulative antibiograms from hospitals with <100 beds in rural settings, but larger hospitals (>500 beds) in urban areas were not immune from cumulative antibiogram errors (28/95, 29%). The remaining 15 serious errors occurred in both rural and urban hospitals with 100–250 beds. Of the 86 total hospitals for which cumulative antibiograms were submitted, 27 (31%) had <100 beds, 21 (24%) had 100–250 beds, 17 (20%) had 250–500 beds, and seven (8%) had >500 beds. Fourteen hospitals (16%) were part of large health-care systems with central laboratories and were counted as having >500 beds in determining the size of the hospitals where these errors occurred.
The observed decrease in the percentage of cumulative antibiograms with serious errors over time (from 59% in 2000 to 19% in 2005) suggests that laboratories are improving their review of patient data.
Failure to indicate whether subsequent, duplicate isolates from patients were excluded may indicate the need for changes in computer algorithms for AST instruments and laboratory information systems, which are difficult to implement without additional technical support. The inclusion of data calculated on a low number of isolates (CLSI recommends calculations using no fewer than 10 isolates as of 2002 and no fewer than 30 as of 2005) may indicate a lack of training in statistical methods or demonstrate a need for guidance in this area. Addition of inclusive dates in the report is a straightforward recommendation that could be implemented by changing the spreadsheet or printing template used by the hospital. These findings may indicate there is still need for review of the cumulative antibiogram data before they are distributed.
Limitations
This analysis was subject to several limitations. Cumulative antibiograms were not obtained consistently from the same hospitals each year. For example, 16 of the 86 (19%) hospitals submitted data from only a single year. The number of cumulative antibiogram submissions increased each year, resulting in smaller sample sizes in the earliest years, when error rates were highest. We presumed cumulative antibiograms submitted to be self-explanatory, but many were photocopies, possibly missing additional explanatory pages or footnotes. We did not identify whether cumulative antibiograms were prepared and/or reviewed by laboratory, pharmacy, or infection-control staff. We also did not determine how data were extracted or compiled or whether data were derived from laboratory information systems or testing systems. Other authors have suggested that until there is greater compliance with M39-A guidelines, the cumulative antibiogram should include an explanation of the construction methodology.13
There were also many confounding variables. Changes in commercial assays and several new CLSI recommendations for testing, methodology, and interpretation of results occurred each year during this period. Some laboratories are known to have switched instrumentation, resulting in data loss during the transition period, but this is not apparent from the cumulative antibiograms.
CONCLUSIONS
Despite the statistical limitations, some conclusions remain valid: AST is nuanced and complex, and automated instrumentation does not eliminate the need for well-trained, experienced clinical microbiologists to oversee testing and review data.
Clinical microbiologists need guidance and continuing education designed to help them recognize emerging antimicrobial resistance patterns. PHL programs that provide and explain the AST standards and guidelines may encourage compliance with susceptibility testing standards and may reduce serious errors. Analysis of cumulative antibiograms by PHLs can provide useful information to focus educational efforts for AST.
Cumulative antibiograms may provide PHLs with a tool to monitor resistance in their jurisdictions, but the limitations must be understood. If laboratories follow the CLSI recommendation to include only the first isolate per patient per analysis period, subsequent emergence of resistance in an isolate from a given patient or acquisition of a second, more resistant isolate will not be reflected in the cumulative antibiogram. Also, to determine if any improbable resistant isolates were overlooked, one would have to analyze all isolates and not just the first per patient. Increased compliance with CLSI AST standards and cumulative antibiogram guidelines should provide more reliable local data for clinicians to guide their antimicrobial choice in initial infections. Based on these results, we propose continuing this activity, pending the approval of additional funding.
Acknowledgments
The authors thank Eric R. Simms, Tulane University, for technical assistance.
Footnotes
This study was supported by cooperative agreement #U10/CCU523520-02 from the Centers for Disease Control and Prevention (CDC). Its contents are solely the responsibility of the authors and do not necessarily reflect the official views of CDC.
REFERENCES
- 1.Staphylococcus aureus resistant to vancomycin—United States, 2002. [cited 2009 Mar 14];MMWR Morb Mortal Wkly Rep. 2002 51(26):565–7. Also available from: URL: http://www.cdc.gov/mmwr/preview/mmwrhtml/mm5126a1.htm. [PubMed] [Google Scholar]
- 2.State of Michigan Office of Administrative Hearings and Rules, Department of Community Health, Bureau of Epidemiology. Communicable disease rules. [cited 2009 Dec 16]. Available from: URL: http://www.state.mi.us/orr/emi/admincode.asp?AdminCode=Single&Admin_Num=32500171&Dpt=CH&RngHigh.
- 3.National Committee for Clinical Laboratory Standards. Analysis and presentation of cumulative antimicrobial susceptibility test data; approved guideline. NCCLS document M39-A. Wayne (PA): NCCLS; 2002. [Google Scholar]
- 4.National Committee for Clinical Laboratory Standards. Performance standards for antimicrobial susceptibility testing; 12th informational supplement. NCCLS document M100-S12. Wayne (PA): NCCLS; 2002. [Google Scholar]
- 5.National Committee for Clinical Laboratory Standards. Performance standards for antimicrobial disk susceptibility tests; approved standard. 8th ed. NCCLS document M2-A8. Wayne (PA): NCCLS; 2003. [Google Scholar]
- 6.National Committee for Clinical Laboratory Standards. Methods for dilution antimicrobial susceptibility tests for bacteria that grow aerobically; approved standard. 6th ed. NCCLS document M7-A6. Wayne (PA): NCCLS; 2003. [Google Scholar]
- 7.Turnidge JD, Ferraro MJ, Jorgensen JH. Susceptibility test methods: general considerations. In: Murray PR, editor. Manual of clinical microbiology. 9th ed. Washington: ASM Press; 2007. pp. 1146–51. [Google Scholar]
- 8.American Hospital Association. AHA guide to the health care field 2007. Chicago: AHA Press; 2006. [Google Scholar]
- 9.Clinical and Laboratory Standards Institute. Analysis and presentation of cumulative antimicrobial susceptibility test data; approved guideline. 2nd ed. CLSI document M39-A2. Wayne (PA): CLSI; 2005. [Google Scholar]
- 10.Hindler JF, Stelling J. Analysis and presentation of cumulative antibiograms: a new consensus guideline from the Clinical and Laboratory Standards Institute. Clin Infect Dis. 2007;44:867–73. doi: 10.1086/511864. [DOI] [PubMed] [Google Scholar]
- 11.Centers for Disease Control and Prevention (US) Campaign to prevent antimicrobial resistance in healthcare settings. [cited 2009 Mar 27]. Available from: URL: http://www.cdc.gov/drugresistance/healthcare/patients.htm.
- 12.Bantar C, Alcazar G, Franco D, Salamone F, Vesco E, Stieben T, et al. Are laboratory-based antibiograms reliable to guide the selection of empirical antimicrobial treatment in patients with hospital-acquired infections? J Antimicrob Chemother. 2007;59:140–3. doi: 10.1093/jac/dkl434. [DOI] [PubMed] [Google Scholar]
- 13.Lautenbach E, Nachamkin I. Analysis and presentation of cumulative antimicrobial susceptibility data (antibiograms): substantial variability across medical centers in the United States. Infect Control Hosp Epidemiol. 2006;27:409–12. doi: 10.1086/503342. [DOI] [PubMed] [Google Scholar]
- 14.Zapantis A, Lacy MK, Horvat RT, Grauer D, Barnes DJ, O'Neal B, et al. Nationwide antibiogram analysis using NCCLS M39-A guidelines. J Clin Microbiol. 2005;43:2629–34. doi: 10.1128/JCM.43.6.2629-2634.2005. [DOI] [PMC free article] [PubMed] [Google Scholar]
- 15.Diekema DJ, Lee K, Raney P, Herwaldt LA, Doern GV, Tenover FC. Accuracy and appropriateness of antimicrobial susceptibility test reporting for bacteria isolated from blood cultures. J Clin Microbiol. 2004;42:2258–60. doi: 10.1128/JCM.42.5.2258-2260.2004. [DOI] [PMC free article] [PubMed] [Google Scholar]
- 16.Edson DC, Glick T, Massey LD. Susceptibility testing practices for Streptococcus pneumoniae: results of a proficiency testing survey of clinical laboratories. Diagn Microbiol Infect Dis. 2006;55:225–30. doi: 10.1016/j.diagmicrobio.2006.01.010. [DOI] [PubMed] [Google Scholar]
- 17.Jones RN College of American Pathologists Microbiology Resource Committee. Method preferences and test accuracy of antimicrobial susceptibility testing: updates from the College of American Pathologists Microbiology Surveys Program. Arch Pathol Lab Med. 2001;125:1285–9. doi: 10.5858/2001-125-1285-MPATAO. [DOI] [PubMed] [Google Scholar]
- 18.Counts JM, Astles JR, Tenover FC, Hindler J. Systems approach to improving antimicrobial susceptibility testing in clinical laboratories in the United States. J Clin Microbiol. 2007;45:2230–4. doi: 10.1128/JCM.00184-07. [DOI] [PMC free article] [PubMed] [Google Scholar]
- 19.Rosner ER, Mulawski KK, Willis JR, Lipman HB, Boone AS, Hindler JF. Evaluation of effectiveness of a continuing education program on antimicrobial susceptibility testing. Clin Lab Sci. 2007;20:146–53. [PubMed] [Google Scholar]
- 20.Core functions and capabilities of state public health laboratories. [cited 2009 Mar 14];MMWR Recomm Rep. 2002 51(RR-14):1–8. Also available from: URL: http://www.cdc.gov/mmwr/preview/mmwrhtml/rr5114a1.htm. [PubMed] [Google Scholar]


