

Abstract
Inflammation is believed to play a role in prostate cancer (PCa) etiology, but it is unclear whether inflammatory markers C-reactive protein (CRP) and interleukin-6 (IL-6) associate with PCa risk in older men. Using Cox regression, we assessed the relationship between baseline concentrations of CRP and IL-6 and subsequent PCa risk in the Cardiovascular Health Study, a population-based cohort study of mostly European American men ages >64 years (n=2234; mean follow-up = 8.7 years; 215 incident PCa cases). We also tested associations between CRP and IL-6 tagSNPs and PCa risk, focusing on SNPs known to associate with circulating CRP and/or IL-6. Results: Neither CRP nor IL-6 blood concentrations were associated with PCa risk. The C allele of IL-6 SNP rs1800795 (-174), a known functional variant, was associated with increased risk in a dominant model (HR=1.44; 95% CI=1.03-2.01; p=0.03) but was not statistically significant after accounting for multiple tests (permutation p=0.21). Our results suggest that circulating CRP and IL-6 do not influence PCa risk. SNPs at the CRP locus are not associated with PCa risk in this cohort, while the association between rs1800795 and PCa risk warrants further investigation.
Keywords: Prostate cancer, inflammation, C-reactive protein (CRP), interleukin-6 (IL-6), IL-6 rs1800795 (-174)
Introduction
Inflammation may play a role in the etiology of prostate cancer (PCa) [1, 2]. Several surrogate measures of inflammatory status, such as history of prostatitis [3], history of sexually transmitted infections [4], and genetic variation in immune response genes [5], have been associated with PCa risk. In addition, inflammation is often present in prostate biopsies, radical prostatectomy specimens, and tissues resected to treat benign prostatic hyperplasia [6]. Blood concentrations of inflammatory markers C-reactive protein (CRP), an acute phase protein produced by the liver, and interleukin 6 (IL-6), a cytokine and inducer of CRP, have been associated with poor prognosis and survival in PCa patients [7-11].
However, few prospective studies have examined the relationship between circulating markers of inflammation and subsequent PCa risk. If blood concentrations of these markers associate with PCa risk, information on inflammatory markers could potentially be used to help identify individuals at high-risk for PCa and/or develop PCa prevention strategies. Prospective data from the Rotterdam study, a cohort of individuals age ≥55 (242 PCa cases) [12], and CLUE II, a cohort of adults (18+ years) in Washington Country, MD (264 cases) [13] suggest that circulating CRP concentration is not associated with prostate cancer risk. However, the relationship between CRP and PCa risk has not been evaluated in a cohort of men exclusively age 65 and older. Because the prevalence of chronic inflammation increases with age [14], it is important to evaluate its effects in older populations. The relationship between circulating IL-6 and PCa risk has not been evaluated previously.
In addition, several reports suggest that single nucleotide polymorphisms (SNPs) in or near CRP and IL-6 are associated with circulating concentrations of their respective protein products [15-19] and show functionality in vitro [15, 20, 21]. If these inflammatory markers are causally involved in prostate carcinogenesis, then genetic variation within the CRP and IL-6 gene regions may influence PCa risk and/or progression by altering gene regulation and protein expression. Furthermore, such regulatory SNPs may be more reliable indicators of long-term blood concentrations than circulating biomarkers measured at a single time point due temporal variation in blood concentrations. CRP or IL-6 SNPs could also influence PCa risk through alterations in protein structure and function.
In order to determine if circulating concentrations of CRP or IL-6 influence PCa risk in older men, we tested associations between baseline measures of these markers and subsequent PCa using data from the Cardiovascular Health Study (CHS) [22]. To further investigate the relationships between these markers and PCa risk, we tested associations between CRP and IL-6 tagSNP genotypes and PCa risk, focusing on SNPs previously shown to be associated with CRP and/or IL-6 blood concentrations in the CHS cohort [16, 18].
Materials and Methods
Study Sample
The Cardiovascular Health Study (CHS) is a population-based prospective, observational cohort study that was originally designed to investigate risk factors for coronary heart disease and stroke in the elderly (age 65 and older) [22]. Individuals were recruited from four communities in the U.S.: Sacramento County, CA; Forsyth County, NC; Pittsburgh, PA; and Washington County, MD [23]. A primarily European American (EA) cohort (n=5,201) was enrolled in 1989-1990, and an exclusively African American (AA) cohort (n=687) was enrolled in 1992-1993. Medicare eligibility lists were used to identify potential participants, and 57.3% of eligible individuals were enrolled [23].
At baseline, a clinical examination was completed to collect both physical and self-reported measures of potential risk factors for cardiovascular disease [23]. Phlebotomy was performed on the morning of the clinical exam after an 8–12 hour fast [24]. Anthropometric measures included height, weight, and waist and hip circumference. Standard questionnaires were administered to obtain information on demographics, medical history, and health-related behaviors. Informed consent was obtained from all participants using methods approved by institutional review committees at each site [22]. All activities for the present study were approved by the University of Washington's Human Subjects Review Committee.
Outcomes
CHS participants with a primary PCa diagnosis between 1989 and 2002 (n=215) were identified through record linkage with five population-based cancer registries serving the four CHS regions (described in [25]). Cancer registry records were estimated to be 93–100% complete as measured by the standard of the North American Association of Central Cancer Registries [25]. Male participants were eligible for this analysis if they had donated a blood sample at baseline, provided informed consent for DNA analysis, and had no history of PCa at baseline according to either registry or baseline interview data.
Registry data on stage and grade (collected using structured approaches) were used to classify tumors according to SEER summary stage and grade categories[26-28]. Tumors were classified as “local” (SEER summary stage 1, confined to prostate or clinically inapparent), “regional” (SEER summary stage 2-5: extension beyond the prostate capsule and/or regional lymph node involvement), or “distant” (SEER summary stage 7: distant site(s) and/or distant lymph nodes involved). SEER grades 1 (well-differentiated), 2 (moderately differentiated), and 3 (poorly differentiated) correspond to Gleason scores of 2-4, 5-7, and 8-10 respectively. In instances where cancers were recorded by two registries, stage categorizations were 100% concordant [27].
More aggressive PCa was defined as having either regional or distant stage or a Gleason score ≥8. PCa was classified as less aggressive if the tumor stage was local and the Gleason score was <8. If aggressiveness could not be determined due to missing data, aggressiveness was defined as “unknown”.
Biological Measurements and Genotyping
Samples were stored at -80°C for 5-6 years prior to CRP and IL6 measurement. The number of freeze-thaw cycles was similar for each sample (2 to 3), and no significant changes in CRP have been observed over 5 freeze-thaw cycles [29]. CRP was measured in the entire cohort using stored plasma and a validated in-house high-sensitivity enzyme-linked immunosorbent assay (ELISA) [30] (coefficient of variation (CV): 6.2%) [31]. IL-6 was measured using stored serum and a commercial ELISA kit (Quantikine IL-6, R&D Systems, Minneapolis, MN, USA) (CV: 6.3%) [32]. The minimum detectable concentration for the IL-6 assay is reported to be, on average, 0.039 pg/ml (Quantikine HS human IL-6 Immunoassay). All samples were run as one batch (same reagents used throughout) and in duplicate (resulting measures were averaged). Quality control samples were included on each plate (every 36 samples) to monitor differences between runs. CVs were calculated as the overall means of the QC samples divided by the standard deviation. IL-6 was measured successfully for fewer individuals than CRP due to insufficient serum volume, as the IL-6 assay has higher volume requirements.
SNPs with minor allele frequency (MAF) ≥0.05 were identified for both CRP [15, 16] and IL-6 [18] using sequence data obtained from 24 unrelated AA from the Coriell AA100 panel and 23 unrelated EAs from the Centre d'Etude du Polymorphisme Humain pedigrees as a part of the SeattleSNPs project (http://pga.mbt.washington.edu/). Based on race-specific linkage disequilibrium (LD) and haplotype patterns across the CRP and IL-6 genes, four CRP tagSNPs (rs1417938, rs1800947, rs1205, rs2808630) and six IL-6 tagSNPs (rs1800796, rs1800795, rs2069837, rs1554606, rs2069849, rs1818879) were selected for genotyping in the EA samples [15, 16]. One additional CRP tagSNP (rs3093058) and three additional IL-6 tagSNPs (rs2069830, rs1474347, and rs1524107) were genotyped in AA samples in order to capture genetic variation common only in DNA of African ancestry. SNPs were genotyped using TaqMan Assays-by-Design (Applied Biosystems, Foster City, CA) under standard conditions. Probe and primer sequences are available from the authors by request [16, 18].
Statistical Analysis
Cox proportional hazards regressions were used to test the associations between circulating markers, genotypes, and PCa risk, as implemented in STATA (StataCorp. 2005. Stata Statistical Software: Release 9. College Station, TX: StataCorp LP). Follow-up time was defined as the period between baseline interview and a first diagnosis of PCa, death, loss to follow-up, or the end of the study period (administrative censoring), whichever came first. Cancer registry data was available through different dates for the various registries, therefore administrative censor dates ranged from Dec. 1999 to Dec. 2004. The average follow-up time was 8.9 years (range: 0.02-14.20 years) for participants enrolled in 1989-90, and 7.3 (range: 0.01- 10.58 years) for participants enrolled in 1992-1993.
Individuals with CRP blood concentrations >10 mg/l were excluded from analyses of blood concentrations of inflammatory markers, due to the possibility that the elevated concentrations are the result of acute infection [33], but were included in analyses of tagSNP genotypes. CRP and IL-6 blood concentrations were analyzed by quartiles and as natural log-transformed values due to the skewness of their distributions (skewness was 1.48 before and 0.51 after transformation of CRP; 4.5 before and 0.53 after transformation of IL-6). Baseline CRP and IL-6 concentrations were tested for associations with PCa risk using two models. Model 1 was adjusted for age (65-69, 70-74, 75-79, 80-84, and ≥85 years), race (EA and AA), and enrollment period (1989-90 and 1993-94), with race and enrollment period treated as strata variables within the Cox model. Model 2 included additional variables that were associated with PCa risk in the CHS cohort at a conservative p<0.15 significance level in a multivariate Cox model, to control for confounding by potential PCa risk factors. Candidate risk factors included, BMI (<25, 25-29.9, >30), diabetes status, smoking status, physical activity, study site/clinic, and current NSAID use. Additional models were fit to investigate effect modification by BMI (above vs. below the median), and to test associations of CRP and IL-6 with more aggressive PCa (individuals with less aggressive PCa were censored at diagnosis date).
To more stringently test the hypothesis that elevated CRP or IL-6 is a PCa risk factor, additional analyses of baseline CRP and IL-6 concentrations were conducted using only individuals free of cancer at year 5 of follow-up. In other words, excluding individuals who developed cancer prior to year 5 reduced the probability that elevated CRP/IL-6 measurements were the consequence of undetected tumors, rather than a risk factor for tumor development.
For each tagSNP, Hardy-Weinberg Equilibrium (HWE) was assessed independently for AAs and EAs, using the Pearson chi-square statistic. Our primary hypothesis was that SNPs known to be associated with circulating CRP and/or IL-6 concentrations in the CHS cohort would be associated with PCa risk. Tests of other SNPs were exploratory in nature. Previous CHS reports suggest that in EAs, circulating CRP is associated with CRP SNPs rs1417938 (also referred to as 1919), rs1800947 (2667), and rs1205 (3872); and IL-6 SNPs rs1800795 (1510), rs2069837 (2892), rs1554606 (3572), and rs1818879 (7592). Associations with circulating IL-6 have been reported for IL-6 SNPs rs1800795 (1510) and rs1554606 (3572). In AA CHS participants, CRP SNPs rs3093058 (790) and rs1205 (3872) are associated with circulating CRP [16]. Associations for each SNP were tested in a multiplicative model (test of trend) and in dominant model (minor allele carriers vs. major allele homozygotes) using likelihood ratio tests, because their mode of inheritance with respect to circulating CRP and/or IL-6 is not always clear [16, 18]. Genotype analyses were adjusted for age and conducted separately for EAs and AAs. Hazard Ratios (HRs) for a codominant model are also presented to aid in the interpretation of our formal tests of significance. For SNPs associated with PCa risk, the proportional hazards assumption was tested on the basis of Schoenfeld residuals using the stphtest function in STATA.
To consider the consequences of multiple testing on our SNP analyses, we calculated permutation-based p-values using an in-house program written in STATA. For the seven SNPs that associated with either CRP or IL-6 concentrations in the CHS cohort, we randomly matched the genotype data (preserving LD structure) to the phenotype data for all 2,015 EA individuals, 1,000 times, generating 1,000 datasets. Each dataset was analyzed under multiplicative and dominant models, resulting in 14 likelihood ratio test p-values for each permutation. The lowest p-value from each permuted analysis was used to construct a null distribution of minimal p-values. This distribution was used to calculate a ‘permuted p-value’ for our lowest nominal p-value.
Results
Characteristics of the cohort are presented in Table 1. Of the 2,277 men that provided blood and consented to DNA analysis, 43 were diagnosed with PCa prior to baseline and were ineligible (Figure 1). Among the 2,234 participants eligible for analysis, there were 215 cases of incident PCa identified, during an average of 8.7 years of follow-up per person. At baseline, the mean age was 73.3 years, the mean BMI was 26.4 kg/m2, and the percentage of current smokers was 10.8 %. For men with CRP <10 mg/l, mean CRP was 2.61 ± 2.02 mg/l and mean IL-6 was 2.13 ± 1.61 mg/l. When compared to EAs, AA participants had a higher mean CRP concentration, lower mean physical activity, and a higher prevalence of current smoking.
Table 1. Characteristics of eligible participants from the Cardiovascular Health Study.
Values are shown as frequencies and (%) unless otherwise indicated
| Total | European Americans | African Americans | |
|---|---|---|---|
| N | 2,234 | 1,934 | 300 |
| Mean follow-up per person, years | 8.7 | 8.9 | 7.3 |
| Number of incident PCa cases | 215 (9.6) | 175 (9.1) | 40 (13.3) |
| Age in years at baseline, mean ± SD | 73.3 ± 5.7 | 73.4 ± 5.7 | 72.7 ± 5.8 |
| 65-69 | 684 (30.6) | 579 (29.9) | 105 (35.0) |
| 70-74 | 748 (33.5) | 640 (33.1) | 108 (36.0) |
| 75-79 | 449 (20.1) | 403 (20.8) | 46 (15.3) |
| 80-84 | 251 (11.2) | 225 (11.6) | 26 (8.7) |
| ≥85 | 102 (4.6) | 87 (4.5) | 15 (5.0) |
| BMI (kg/m2), mean ± SD | 26.4 ± 3.8 | 26.4 ± 3.7 | 26.6 ± 4.3 |
| <25.0 | 808 (36.2) | 703 (36.4) | 105 (35.0) |
| 25.0-29.9 | 1,077 (48.2) | 937 (48.5) | 140 (46.7) |
| ≥30.0 | 341 (15.3) | 287 (14.8) | 54 (18.0) |
| Missing | 8 (0.4) | 7 (0.4) | 1 (0.3) |
| Clinic | |||
| NC (Bowman Gray) | 541 (24.2) | 445 (23.0) | 96 (32.0) |
| CA (Davis) | 584 (26.1) | 495 (25.6) | 89 (29.7) |
| MD (Hopkins) | 530 (23.7) | 526 (27.2) | 4 (1.3) |
| PA (Pittsburg) | 579 (25.9) | 468 (24.2) | 111 (37.0) |
| Smoking | |||
| Never | 716 (32.1) | 619 (32.0) | 97 (32.3) |
| Former | 1,273 (57.0) | 1,131 (58.5) | 142 (47.3) |
| Current | 242 (10.8) | 182 (9.4) | 60 (20.0) |
| Missing | 3 (0.1) | 2 (0.1) | 1 (0.3) |
| Physical activity, kcal/mo | 481 ± 534 | 508 ± 550 | 312 ± 372 |
| Median (IQR) | 309 (119-663) | 330 (132-703) | 197 (67-423) |
| Diabetes | 753 (33.7) | 645 (33.4) | 108 (36.0) |
| Missing | 11 (0.5) | 1 (0.1) | 10 (3.3) |
| Current NSAID use | 220 (9.9) | 188 (9.7) | 32 (10.7) |
| Alcohol, beverages/week | 3.8 ± 8.3 | 3.9 ± 8.1 | 3.4 ± 9.0 |
| Median (IQR) | 0.25 (0.0-3.0) | 0.25(0.0-3.0) | 0.0 (0.0-2.0) |
| CRP blood concentration (mg/l)1 | |||
| Median (IQR) | 2.4 (1.2-4.2) | 2.3 (1.2-4.1) | 3.0 (1.5-5.2) |
| Mean ± SE | 4.7 ± 8.8 | 4.6 ± 9.1 | 5.1 ± 6.8 |
| Range | 0.1-142.6 | 0.1-142.6 | 0.2-61.3 |
| ln(CRP), mean ± SE | 0.9 ± 1.1 | 0.9 ± 1.0 | 1.1 ± 1.0 |
| Missing | 20 (0.9) | 14 (0.7) | 6 (2.0) |
| CRP >10 mg/l | 229 (11.2) | 186 (10.3) | 43 (16.3) |
| IL-6 blood concentration (pg/ml)2 | |||
| Median (IQR) | 1.8 (1.3-2.7) | 1.8 (1.3-2.7) | 1.7 (1.2-2.8) |
| Mean ± SE | 2.3 ± 1.9 | 2.4 ± 1.9 | 2.2 ± 1.6 |
| Range | 0.3-23.6 | 0.3-23.6 | 0.4-12.1 |
| ln (IL6), mean ± SE | 0.7 ± 0.6 | 0.7 ± 0.6 | 0.6 ± 0.6 |
| Missing | 211 (9.4) | 184 (9.5) | 27 (9.0) |
| Stage of disease | |||
| Local | 114 (53.0) | 88 (50.3) | 26 (65.0) |
| Regional | 26 (12.1) | 20 (11.4) | 6 (15.0) |
| Distant | 11 (5.1) | 10 (5.7) | 1 (2.5) |
| Unknown | 64 (29.8) | 57 (32.6) | 7 (17.5) |
| Gleason score | |||
| 2-4 | 31 (14.4) | 25 (14.3) | 6 (15.0) |
| 5-7 | 113 (52.6) | 89 (50.9) | 24 (60.0) |
| 8-10 | 49 (22.8) | 39 (22.3) | 10 (25.0) |
| Unknown | 22 (10.2) | 22 (12.6) | 0 (0.0) |
Based on a total sample size of 2,214 (20 missing)
Based on a total sample size of 2,023 (211 missing)
Figure 1.
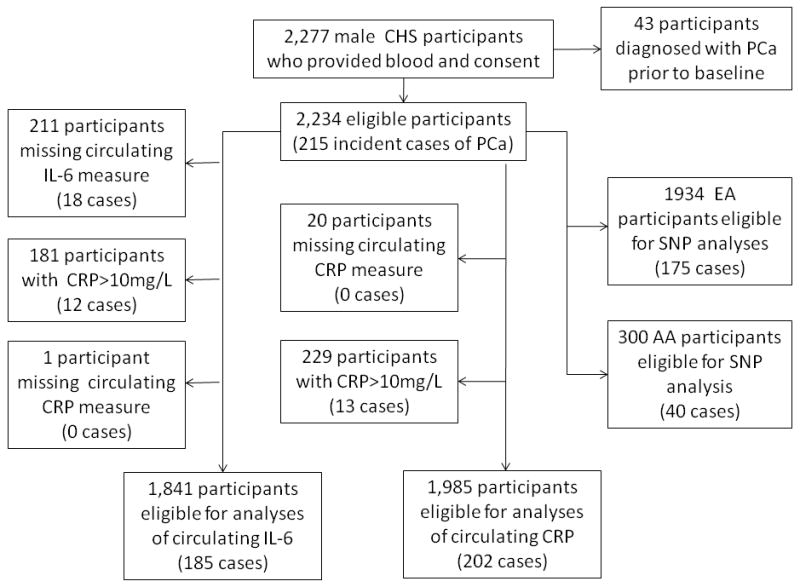
Description of the Cardiovascular Health Study participants eligible for analyses. PCa, prostate cancer; CRP, C-reactive protein; IL-6, interleukin-6; EA, European American; AA, African American
CRP and IL-6 blood concentrations and PCa risk
Of the eligible study participants, 2,214 and 2,023 individuals had measures for CRP (20 missing) and IL-6 (211 missing) blood concentrations, respectively (Table 1 and Figure 1). Of the individuals with CRP measurements, 229 had CRP >10 mg/l, suggesting acute infection. These individuals were excluded from primary analyses of CRP and IL-6 blood concentrations. Race, diabetes, age, NSAID use, and study site/clinic were determined to be independent predictors of PCa at the p=0.15 level, and each remained significant in a multivariate model. These variables were retained as potential confounders in all analyses of circulating CRP and IL-6.
Significant associations with PCa risk were observed for neither CRP nor IL-6, after adjustment for potential confounding factors (Table 2). Similar results were observed in analyses unadjusted for potential confounders (data not shown). HRs for CRP and IL-6 were similar by quartile. For both CRP and IL-6, a slight non-significant increase in risk was observed for the second and third quartiles, but no increase in risk was observed for the highest quartile. Similar associations were observed when CRP was analyzed using the American Heart Association's CRP categories (<1, 1-3, and >3 mg/l) [33], with elevated risk for the 1-3 mg/l category (HR=1.36; 95% CI=0.95-1.96) and no excess risk for the >3 mg/l category (HR=0.97; 95% CI=0.64-1.48). Results were similar when the analysis was repeated including participants with CRP >10mg/l (data not shown) and excluding men diagnosed with PCa within 5 years of enrollment (Table 2). When aggressive PCa was defined as the outcome (n=74), neither CRP nor IL-6 blood concentration was associated with PCa risk (test of trend p=0.84 and p=0.65, respectively). Further, no significant associations were observed when the data were analyzed stratified by race or the median BMI, or when a CRP-IL-6 interaction term was tested (data not shown).
Table 2. Hazard ratios (HR) and 95% confidence intervals (95% CI) for associations between baseline C-reactive protein and interleukin-6 concentrations (by quartiles) and prostate cancer risk1.
| No. Cases/cohort | Total Person-Years | HR2 | 95% CI2 | |
|---|---|---|---|---|
| CRP (mg/l) | ||||
| <1.10 | 46 | 4673 | 1.00 | Ref |
| 1.10-2.11 | 59 | 4572 | 1.27 | 0.86-1.87 |
| 2.11-3.47 | 55 | 4332 | 1.29 | 0.87-1.91 |
| >3.47 | 42 | 4024 | 1.03 | 0.67-1.57 |
| Log(CRP) | 1.02 | 0.85-1.21 | ||
| IL-6 (mg/l) | ||||
| <1.23 | 51 | 4668 | 1.00 | Ref |
| 1.23-1.69 | 57 | 4256 | 1.24 | 0.84-1.83 |
| 1.69-2.47 | 45 | 3800 | 1.17 | 0.78-1.76 |
| >2.47 | 32 | 3624 | 0.90 | 0.57-1.40 |
| Log(IL-6) | 0.97 | 0.74-1.27 | ||
| Excluding cases diagnosed in first 5 years | ||||
| CRP (mg/l) | ||||
| <1.10 | 17 | 4107 | 1.00 | Ref |
| 1.10-2.11 | 25 | 4188 | 1.38 | 0.74-2.56 |
| 2.11-3.47 | 18 | 4099 | 0.98 | 0.50-1.92 |
| >3.47 | 17 | 3975 | 1.06 | 0.54-2.10 |
| Log(CRP) | 1.01 | 0.76-1.36 | ||
| IL-6 (mg/l) | ||||
| <1.23 | 19 | 4010 | 1.00 | Ref |
| 1.23-1.69 | 28 | 3862 | 1.61 | 0.89-2.90 |
| 1.69-2.47 | 14 | 3726 | 0.83 | 0.41-1.70 |
| >2.47 | 14 | 3597 | 0.98 | 0.48-1.98 |
| Log(IL-6) | 0.84 | 0.54-1.29 | ||
Excluding individuals with baseline CRP >10 mg/l
Adjusted for age, race, enrollment period, diabetes status, current NSAID use, and clinic
CRP/IL-6 genotypes and PCa risk
For the CRP SNPs, no statistically significant deviations from HWE were detected in AAs or EAs. For the IL-6 SNPs, rs2069837 (2892) showed a significant deviation from HWE in EAs only (p=0.02), primarily due to an excess of rare homozygotes.
Associations between all SNP genotypes and PCa risk are shown in Table 3, with SNPs of putative functional significance shown in bold. No CRP SNPs showed significant association with PCa risk in EAs or AAs. In EAs, increased risk of PCa was associated with the C allele of IL-6 functional SNP rs1800795 (1510) when treated as the dominant allele (C carrier vs. TT HR=1.44; 95% CI=1.03-2.01; p=0.03). Increased risk was also observed for the C allele when it was tested as a dominant allele (LRT p=0.029; permutation-p=0.21). The magnitude of this association was stronger in the more aggressive PCa cases (C carrier vs. TT HR=1.79; 95% CI=0.98-3.27) than in the less aggressive cases (C carrier vs. TT HR=1.10; 95% CI=0.65-1.85). The proportional hazards assumption was not violated for either rs1800795, as indicated by Schoenfeld residuals.
Table 3. Associations1 between C-reactive protein and interleukin-6 tagSNPs and prostate cancer risk by race, adjusted for age, enrollment period, and clinic.
| EAs (n=2,015) | AAs (n=311) | |||||
|---|---|---|---|---|---|---|
| SNP2 (position3) | Cases/Cohort | HR | 95% CI | Cases/Cohort | HR | 95% CI |
| CRP SNPs | ||||||
| rs3093058 (790) | ||||||
| AT or TT | -- | 14/94 | 1.15 | 0.60-2.22 | ||
| AA | -- | 26/206 | 1.00 | Ref | ||
| AT | -- | 12/85 | 1.09 | 0.55-2.18 | ||
| TT | -- | 2/9 | 1.74 | 0.40-7.49 | ||
| Ptrend=0.56 | ||||||
| rs1417938 (1919) | ||||||
| AT or TT | 92/1013 | 1.02 | 0.75-1.36 | 9/70 | 0.88 | 0.42-1.85 |
| AA | 83/921 | 1.00 | Ref | 31/230 | 1.00 | Ref |
| AT | 69/830 | 0.92 | 0.67-1.27 | 8/66 | 0.84 | 0.39-1.83 |
| TT | 23/183 | 1.38 | 0.87-2.20 | 1/4 | 1.40 | 0.18-10.98 |
| Ptrend=0.45 | Ptrend=0.83 | |||||
| rs1800947 (2667) | ||||||
| GC or CC | 22/242 | 1.05 | 0.67-1.64 | 2/11 | 1.10 | 0.26-4.69 |
| GG | 153/1691 | 1.00 | Ref | 38/289 | 1.00 | Ref |
| GC | 21/236 | 1.02 | 0.65-1.62 | 2/11 | 1.10 | 0.26-4.69 |
| CC | 1/6 | 1.98 | 0.28-14.21 | 0/0 | -- | -- |
| Missing | 1 | 0 | ||||
| Ptrend=0.76 | Ptrend=0.90 | |||||
| rs1205 (3872) | ||||||
| GA or AA | 90/1062 | 0.89 | 0.66-1.20 | 13/102 | 0.99 | 0.51-1.94 |
| GG | 85/871 | 1.00 | Ref | 27/198 | 1.00 | Ref |
| GA | 72/845 | 0.91 | 0.67-1.25 | 11/94 | 0.90 | 0.44-1.82 |
| AA | 18/217 | 0.83 | 0.50-1.38 | 2/8 | 2.44 | 0.56-10.58 |
| Missing | 1 | 0 | ||||
| Ptrend=0.41 | Ptrend=0.74 | |||||
| rs2808630 (5237) | ||||||
| AG or GG | 86/908 | 1.08 | 0.80-1.46 | 16/116 | 1.03 | 0.54-1.96 |
| AA | 89/1026 | 1.00 | Ref | 24/184 | 1.00 | Ref |
| AG | 73/760 | 1.10 | 0.81-1.51 | 16/107 | 1.12 | 0.59-2.15 |
| GG | 13/148 | 0.98 | 0.54-1.75 | 0/9 | 0.00 | -- |
| Ptrend=0.76 | Ptrend=0.75 | |||||
| IL-6 SNPs | ||||||
| rs1800796 (1111) | ||||||
| GC or CC | 19/194 | 1.07 | 0.66-1.72 | 3/47 | 0.36 | 0.11-1.19 |
| GG | 156/1740 | 1.00 | Ref | 37/253 | 1.00 | Ref |
| GC | 19/192 | 1.08 | 0.67-1.74 | 2/46 | 0.25 | 0.06-1.05 |
| CC | 0/2 | 0.0 | -- | 1/1 | 3.47 | 0.39-30.96 |
| Ptrend=0.83 | Ptrend=0.14 | |||||
| rs1800795 (1510) | ||||||
| GC or CC | 127/1237 | 1.44 | 1.03-2.01 | 6/50 | 0.91 | 0.38-2.17 |
| GG | 48/696 | 1.00 | Ref | 34/250 | 1.00 | Ref |
| GC | 96/901 | 1.49 | 1.05-2.11 | 5/48 | 0.79 | 0.31-2.02 |
| CC | 31/336 | 1.30 | 0.82-2.04 | 1/2 | 4.14 | 0.53-32.68 |
| Missing | 1 | 0 | ||||
| Ptrend=0.14 | Ptrend=0.92 | |||||
| rs2069830 (2002) | ||||||
| CT or TT | -- | 8/31 | 1.52 | 0.96-3.31 | ||
| CC | -- | 32/259 | 1.00 | Ref | ||
| CT | -- | 7/38 | 1.44 | 0.63-3.28 | ||
| TT | -- | 1/3 | 2.51 | 0.30-20.65 | ||
| Ptrend=0.27 | ||||||
| rs2069837 (2892) | ||||||
| AG or GG | 29/319 | 1.04 | 0.70-1.56 | 10/53 | 1.70 | 0.82-3.50 |
| AA | 146/1613 | 1.00 | Ref | 30/247 | 1.00 | Ref |
| AG | 24/295 | 0.93 | 0.60-1.44 | 10/52 | 1.69 | 0.82-3.50 |
| GG | 5/24 | 2.46 | 1.00-6.06 | 0/1 | 0.67 | 0.00-- |
| Missing | 2 | 0 | ||||
| Ptrend=0.48 | Ptrend=0.17 | |||||
| rs1474347 (2989) | ||||||
| AC or CC | 13/93 | 1.04 | 0.53-2.03 | |||
| AA | -- | 27/207 | 1.00 | Ref | ||
| AC | -- | 10/81 | 0.90 | 0.43-1.88 | ||
| CC | -- | 3/12 | 2.05 | 0.60-7.00 | ||
| Ptrend=0.61 | ||||||
| rs1524107 (3084) | ||||||
| CT or TT | 2/33 | 0.36 | 0.08-1.51 | |||
| CC | -- | 38/267 | 1.00 | Ref | ||
| CT | -- | 2/33 | 0.36 | 0.08-1.51 | ||
| TT | -- | 0/0 | -- | -- | ||
| Ptrend=0.10 | ||||||
| rs1554606 (3572) | ||||||
| GT or TT | 128/1301 | 1.25 | 0.90-1.76 | 20/161 | 0.82 | 0.44-1.54 |
| GG | 47/623 | 1.00 | Ref | 20/138 | 1.00 | Ref |
| GT | 93/926 | 1.29 | 0.90-1.83 | 15/121 | 0.81 | 0.41-1.60 |
| TT | 35/375 | 1.16 | 0.76-1.83 | 5/40 | 0.84 | 0.31-2.26 |
| Missing | 10 | 1 | ||||
| Ptrend=0.38 | Ptrend=0.60 | |||||
| rs2069849 (6021) | ||||||
| CT or TT | 5/109 | 0.45 | 0.19-1.11 | 9/73 | 0.86 | 0.40-1.86 |
| CC | 170/1825 | 1.00 | Ref | 31/227 | 1.00 | Ref |
| CT | 5/108 | 0.46 | 0.19-1.11 | 8/69 | 0.81 | 0.37-1.81 |
| TT | 0/1 | -- | -- | 1/4 | 1.67 | 0.21-12.98 |
| Ptrend=0.05 | Ptrend=0.84 | |||||
| rs1818879 (7592) | ||||||
| GA or AA | 84/990 | 0.88 | 0.65-1.19 | 11/103 | 0.64 | 0.32-1.30 |
| GG | 91/944 | 1.00 | Ref | 29/197 | 1.00 | Ref |
| GA | 70/804 | 0.91 | 0.66-1.24 | 11/95 | 0.71 | 0.35-1.44 |
| AA | 14/186 | 0.78 | 0.44-1.37 | 0/8 | -- | -- |
| Ptrend=0.33 | Ptrend=0.13 | |||||
Discussion
In this population-based cohort of men age 65 and older, pre-diagnostic blood concentrations of neither CRP nor IL-6 appear to be associated with subsequent PCa risk overall, or with risk of a PCa with an aggressive phenotype. The C allele at IL-6 SNP rs1800795 (MAF = 0.41), a functional polymorphism located in the IL-6 promoter region, was associated with an increase in PCa risk (nominal p=0.03), but the permutation p-value (p=0.21) suggests that this finding may be a consequence of multiple testing.
Previous reports suggest that SNPs in the IL-6 promoter region, including rs1800795 (also known as IL-6 -174), are functional, influencing expression levels in HeLa cell lines [20, 21]. However, results from functional studies of rs1800795 are inconsistent: Fishman et al. and Terry et al. report increased IL6 transcription in HeLa cells for the G allele and the C allele, respectively, while Terry et al. demonstrates that regulation of IL6 transcription is cell specific. Observational studies in humans suggest that the C allele of rs1800795 is associated with elevated circulating IL-6 concentrations [34, 35] with some inconsistency [20]. These inconsistencies do not appear to be due to confusion related to the palindromic nature of this SNP. CHS investigators report that the C allele of rs1800795 is associated with elevated concentrations of circulating CRP (p=0.0008) and IL-6 (0.04) in the CHS cohort [18], suggesting that rs1800795, or a SNP in LD with rs1800795, may influence PCa risk through regulation of IL-6 RNA and subsequent protein expression. However, the lack of an association between circulating IL-6 concentration and PCa risk indicates that rs1800795 may influence PCa risk through an alternate mechanism, or that the true association between IL-6 and PCa risk has been masked by (1) an unmeasured confounder, (2) the instability of IL-6 in serum, or (3) the inadequacy of a single measurement of IL-6 as an indicator of long-term blood concentration. It is also possible that the association between rs1800795 and PCa risk is a false positive, as suggested by the p-value obtained via permutation (p=0.21). According to the SeattleSNPs Genome Variation Server (http://gvs.gs.washington.edu/GVS/), SNPs in strong LD (r2>0.8) with rs1800795 in EAs include rs1474347, rs1474348, rs1554606, rs1800797, rs2069832, rs2069833, and rs2069845, all non-coding variants.
Few studies have assessed the relationships between IL-6 or CRP SNPs and PCa risk. A large Swedish case-control study found no association between any of six IL-6 tagSNPs and PCa risk, although a non-significant association with increasing PCa risk (OR=1.18; 95% CI=0.91-1.52) was observed for the CC genotype of rs1800795, consistent with the results of this work [36]. In a small study of 95 PCa patients, the C allele at rs1800795 was associated with aggressiveness and recurrence of PCa [37]. For CRP, results from the Rotterdam Study suggest that common variation within the CRP gene is not associated with PCa risk [12], consistent with our results.
This study also suggests that there is no clear relationship between circulating concentrations of CRP or IL-6 and PCa risk, consistent with prospective data on CRP from the Rotterdam Study [12] and the CLUE II Study [13]. Ours is the first study to evaluate the association between circulating IL-6 and PCa risk, and no association was observed.
Because the present analysis considers the potential effects of both genotypes and blood concentrations of CRP and IL6, it provides a comprehensive picture of the relationships between PCa and these inflammatory markers. The use of pre-diagnostic measures of circulating biomarkers in a prospective study design minimizes the potential for reverse causality, and selection of tagSNPs insures that all common variation (MAF ≥5%) in the CRP gene region is tested. The complete ascertainment of PCa cases in this cohort reduces the potential for selection bias.
This work is limited by the lack of data on PCa screening and family history of PCa, two factors known to increase the probability of being diagnosed with PCa [38, 39]. If either of these factors is associated with CRP/IL6 concentrations or genotypes, the magnitude of the associations reported may be biased due to confounding. In addition, only 215 incident cases of PCa were observed in this cohort, limiting power to detect modest associations, especially in analyses of AAs only (40 PCa cases) and in analyses of the aggressive prostate cancer phenotype (74 PCa cases). For example, the minimum detectable allelic HR for CRP SNP rs3093058 (790), a functional SNP [15] present in AAs only, is 2.4, based on a multiplicative model. This study was also underpowered to detect statistical interactions between circulating biomarkers and SNP genotypes. Finally, this study investigates the role of only two biomarkers in the complex inflammation pathway, providing a limited view of the role of inflammation in PCa risk.
In conclusion, we found no relationship between PCa risk and blood concentrations of either CRP or IL-6. The results presented here are consistent with previous studies and suggest that circulating levels of CRP and IL-6 are not associated with PCa risk. Genetic variation within CRP does not appear to influence PCa risk in this cohort, while the association between IL-6 rs1800795 and PCa risk warrants further investigation.
Acknowledgments
The authors have no conflicts of interest to disclose. The authors would like to thank Dr. Leslie A. Lange and Elaine Cornell for their helpful suggestions related to this analysis. A full list of principal CHS investigators and institutions can be found at http://www.chs-nhlbi.org/pi.htm.
Financial Support: This work was supported by training grant R25-CA94880, contract numbers N01-HC-85079 through N01-HC-85086, N01-HC-35129, N01 HC-15103, N01 HC-55222, N01-HC-75150, N01-HC-45133, grant number U01 HL080295 from the National Heart, Lung, and Blood Institute, with additional contribution from the National Institute of Neurological Disorders and Stroke.
Footnotes
This work was performed at the Institute for Public Health Genetics at the University of Washington and the Fred Hutchinson Cancer Research Center
References
- 1.Sutcliffe S, Platz EA. Inflammation in the etiology of prostate cancer: an epidemiologic perspective. Urol Oncol. 2007;25:242–249. doi: 10.1016/j.urolonc.2006.09.014. [DOI] [PubMed] [Google Scholar]
- 2.De Marzo AM, Platz EA, Sutcliffe S, et al. Inflammation in prostate carcinogenesis. Nat Rev Cancer. 2007;7:256–269. doi: 10.1038/nrc2090. [DOI] [PMC free article] [PubMed] [Google Scholar]
- 3.Dennis LK, Lynch CF, Torner JC. Epidemiologic association between prostatitis and prostate cancer. Urology. 2002;60:78–83. doi: 10.1016/s0090-4295(02)01637-0. [DOI] [PubMed] [Google Scholar]
- 4.Dennis LK, Dawson DV. Meta-analysis of measures of sexual activity and prostate cancer. Epidemiology. 2002;13:72–79. doi: 10.1097/00001648-200201000-00012. [DOI] [PubMed] [Google Scholar]
- 5.Sun J, Turner A, Xu J, Gronberg H, Isaacs W. Genetic variability in inflammation pathways and prostate cancer risk. Urol Oncol. 2007;25:250–259. doi: 10.1016/j.urolonc.2006.10.001. [DOI] [PubMed] [Google Scholar]
- 6.Platz EA, De Marzo AM. Epidemiology of inflammation and prostate cancer. J Urol. 2004;171:S36–40. doi: 10.1097/01.ju.0000108131.43160.77. [DOI] [PubMed] [Google Scholar]
- 7.Latif Z, McMillan DC, Wallace AM, et al. The relationship of circulating insulin-like growth factor 1, its binding protein-3, prostate-specific antigen and C-reactive protein with disease stage in prostate cancer. BJU Int. 2002;89:396–399. doi: 10.1046/j.1464-4096.2001.01641.x. [DOI] [PubMed] [Google Scholar]
- 8.Lehrer S, Diamond EJ, Mamkine B, Droller MJ, Stone NN, Stock RG. C-reactive protein is significantly associated with prostate-specific antigen and metastatic disease in prostate cancer. BJU Int. 2005;95:961–962. doi: 10.1111/j.1464-410X.2005.05447.x. [DOI] [PubMed] [Google Scholar]
- 9.McArdle PA, McMillan DC, Sattar N, Wallace AM, Underwood MA. The relationship between interleukin-6 and C-reactive protein in patients with benign and malignant prostate disease. Br J Cancer. 2004;91:1755–1757. doi: 10.1038/sj.bjc.6602211. [DOI] [PMC free article] [PubMed] [Google Scholar]
- 10.Trautner K, Cooper EH, Haworth S, Ward AM. An evaluation of serum protein profiles in the long-term surveillance of prostatic cancer. Scand J Urol Nephrol. 1980;14:143–149. doi: 10.3109/00365598009179552. [DOI] [PubMed] [Google Scholar]
- 11.Ward AM, Cooper EH, Houghton AL. Acute phase reactant proteins in prostatic cancer. Br J Urol. 1977;49:411–418. doi: 10.1111/j.1464-410x.1977.tb04168.x. [DOI] [PubMed] [Google Scholar]
- 12.Siemes C, Visser LE, Coebergh JW, et al. C-reactive protein levels, variation in the C-reactive protein gene, and cancer risk: the Rotterdam Study. J Clin Oncol. 2006;24:5216–5222. doi: 10.1200/JCO.2006.07.1381. [DOI] [PubMed] [Google Scholar]
- 13.Platz EA, De Marzo AM, Erlinger TP, et al. No association between pre-diagnostic plasma C-reactive protein concentration and subsequent prostate cancer. Prostate. 2004;59:393–400. doi: 10.1002/pros.10368. [DOI] [PubMed] [Google Scholar]
- 14.Licastro F, Candore G, Lio D, et al. Innate immunity and inflammation in ageing: a key for understanding age-related diseases. Immun Ageing. 2005;2:8. doi: 10.1186/1742-4933-2-8. [DOI] [PMC free article] [PubMed] [Google Scholar]
- 15.Carlson CS, Aldred SF, Lee PK, et al. Polymorphisms within the C-reactive protein (CRP) promoter region are associated with plasma CRP levels. Am J Hum Genet. 2005;77:64–77. doi: 10.1086/431366. [DOI] [PMC free article] [PubMed] [Google Scholar]
- 16.Lange LA, Carlson CS, Hindorff LA, et al. Association of polymorphisms in the CRP gene with circulating C-reactive protein levels and cardiovascular events. Jama. 2006;296:2703–2711. doi: 10.1001/jama.296.22.2703. [DOI] [PubMed] [Google Scholar]
- 17.Paik JK, Kim OY, Koh SJ, et al. Additive effect of interleukin-6 and C-reactive protein (CRP) single nucleotide polymorphism on serum CRP concentration and other cardiovascular risk factors. Clin Chim Acta. 2007;380:68–74. doi: 10.1016/j.cca.2006.11.011. [DOI] [PubMed] [Google Scholar]
- 18.Walston JD, Fallin MD, Cushman M, et al. IL-6 gene variation is associated with IL-6 and C-reactive protein levels but not cardiovascular outcomes in the Cardiovascular Health Study. Hum Genet. 2007 doi: 10.1007/s00439-007-0428-x. [DOI] [PubMed] [Google Scholar]
- 19.Wong LY, Leung RY, Ong KL, Cheung BM. Plasma levels of fibrinogen and C-reactive protein are related to interleukin-6 gene -572C>G polymorphism in subjects with and without hypertension. J Hum Hypertens. 2007 doi: 10.1038/sj.jhh.1002233. [DOI] [PubMed] [Google Scholar]
- 20.Fishman D, Faulds G, Jeffery R, et al. The effect of novel polymorphisms in the interleukin-6 (IL-6) gene on IL-6 transcription and plasma IL-6 levels, and an association with systemic-onset juvenile chronic arthritis. J Clin Invest. 1998;102:1369–1376. doi: 10.1172/JCI2629. [DOI] [PMC free article] [PubMed] [Google Scholar]
- 21.Terry CF, Loukaci V, Green FR. Cooperative influence of genetic polymorphisms on interleukin 6 transcriptional regulation. J Biol Chem. 2000;275:18138–18144. doi: 10.1074/jbc.M000379200. [DOI] [PubMed] [Google Scholar]
- 22.Fried LP, Borhani NO, Enright P, et al. The Cardiovascular Health Study: design and rationale. Ann Epidemiol. 1991;1:263–276. doi: 10.1016/1047-2797(91)90005-w. [DOI] [PubMed] [Google Scholar]
- 23.Tell GS, Fried LP, Hermanson B, Manolio TA, Newman AB, Borhani NO. Recruitment of adults 65 years and older as participants in the Cardiovascular Health Study. Ann Epidemiol. 1993;3:358–366. doi: 10.1016/1047-2797(93)90062-9. [DOI] [PubMed] [Google Scholar]
- 24.Cushman M, Cornell ES, Howard PR, Bovill EG, Tracy RP. Laboratory methods and quality assurance in the Cardiovascular Health Study. Clin Chem. 1995;41:264–270. [PubMed] [Google Scholar]
- 25.Chen C, Lewis SK, Voigt L, Fitzpatrick A, Plymate SR, Weiss NS. Prostate carcinoma incidence in relation to prediagnostic circulating levels of insulin-like growth factor I, insulin-like growth factor binding protein 3, and insulin. Cancer. 2005;103:76–84. doi: 10.1002/cncr.20727. [DOI] [PubMed] [Google Scholar]
- 26.Johnson CH, editor. The SEER Program Coding and Staging Manual 2004, Revision 1. NIH Pub No 04-5581. Bethesda, MD: National Cancer Institute; 2004. [Google Scholar]
- 27.Sieh W, Edwards KL, Fitzpatrick AL, et al. Genetic Susceptibility to Prostate Cancer: Prostate-specific Antigen and its Interaction with the Androgen Receptor (United States) Cancer Causes Control. 2006;17:187–197. doi: 10.1007/s10552-005-0454-8. [DOI] [PubMed] [Google Scholar]
- 28.Young JL Jr, Roffers SD, Ries LAG, Fritz AG, Hurlbut AA, editors. The SEER Program Code Manual - 2000: Coes and Coding Instructions. NIH Pub No 01-4969. Bethesda, MD: National Cancer Institute; 2001. [Google Scholar]
- 29.Lewis MR, Callas PW, Jenny NS, Tracy RP. Longitudinal stability of coagulation, fibrinolysis, and inflammation factors in stored plasma samples. Thromb Haemost. 2001;86:1495–1500. [PubMed] [Google Scholar]
- 30.Harris TB, Ferrucci L, Tracy RP, et al. Associations of elevated interleukin-6 and C-reactive protein levels with mortality in the elderly. Am J Med. 1999;106:506–512. doi: 10.1016/s0002-9343(99)00066-2. [DOI] [PubMed] [Google Scholar]
- 31.Macy EM, Hayes TE, Tracy RP. Variability in the measurement of C-reactive protein in healthy subjects: implications for reference intervals and epidemiological applications. Clin Chem. 1997;43:52–58. [PubMed] [Google Scholar]
- 32.Jenny NS, Tracy RP, Ogg MS, et al. In the elderly, interleukin-6 plasma levels and the -174G>C polymorphism are associated with the development of cardiovascular disease. Arterioscler Thromb Vasc Biol. 2002;22:2066–2071. doi: 10.1161/01.atv.0000040224.49362.60. [DOI] [PubMed] [Google Scholar]
- 33.Pearson TA, Mensah GA, Alexander RW, et al. Markers of inflammation and cardiovascular disease: application to clinical and public health practice: A statement for healthcare professionals from the Centers for Disease Control and Prevention and the American Heart Association. Circulation. 2003;107:499–511. doi: 10.1161/01.cir.0000052939.59093.45. [DOI] [PubMed] [Google Scholar]
- 34.Brull DJ, Montgomery HE, Sanders J, et al. Interleukin-6 gene -174g>c and -572g>c promoter polymorphisms are strong predictors of plasma interleukin-6 levels after coronary artery bypass surgery. Arterioscler Thromb Vasc Biol. 2001;21:1458–1463. doi: 10.1161/hq0901.094280. [DOI] [PubMed] [Google Scholar]
- 35.Kelberman D, Fife M, Rockman MV, Brull DJ, Woo P, Humphries SE. Analysis of common IL-6 promoter SNP variants and the AnTn tract in humans and primates and effects on plasma IL-6 levels following coronary artery bypass graft surgery. Biochim Biophys Acta. 2004;1688:160–167. doi: 10.1016/j.bbadis.2003.11.010. [DOI] [PubMed] [Google Scholar]
- 36.Sun J, Hedelin M, Zheng SL, et al. Interleukin-6 sequence variants are not associated with prostate cancer risk. Cancer Epidemiol Biomarkers Prev. 2004;13:1677–1679. [PubMed] [Google Scholar]
- 37.Tan D, Wu X, Hou M, et al. Interleukin-6 polymorphism is associated with more aggressive prostate cancer. J Urol. 2005;174:753–756. doi: 10.1097/01.ju.0000168723.42824.40. [DOI] [PubMed] [Google Scholar]
- 38.Schaid DJ. The complex genetic epidemiology of prostate cancer. Hum Mol Genet. 2004;13(Spec No 1):R103–121. doi: 10.1093/hmg/ddh072. [DOI] [PubMed] [Google Scholar]
- 39.Zeegers MP, Jellema A, Ostrer H. Empiric risk of prostate carcinoma for relatives of patients with prostate carcinoma: a meta-analysis. Cancer. 2003;97:1894–1903. doi: 10.1002/cncr.11262. [DOI] [PubMed] [Google Scholar]