

Abstract
Silk proteins are a promising material for drug delivery due to their aqueous processability, biocompatibility, and biodegradability. A simple aqueous preparation method for silk fibroin particles with controllable size, secondary structure and zeta potential is reported. The particles were produced by salting out a silk fibroin solution with potassium phosphate. The effect of ionic strength and pH of potassium phosphate solution on the yield and morphology of the particles was determined. Secondary structure and zeta potential of the silk particles could be controlled by pH. Particles produced by salting out with 1.25 M potassium phosphate pH 6 showed a dominating silk II (crystalline) structure whereas particles produced at pH 9 were mainly composed of silk I (less crystalline). The results show that silk I rich particles possess chemical and physical stability and secondary structure which remained unchanged during post treatments even upon exposure to 100% ethanol or methanol. A model is presented to explain the process of particle formation based on intra- and intermolecular interactions of the silk domains, influenced by pH and kosmotrope salts. The reported silk fibroin particles can be loaded with small molecule model drugs, such as alcian blue, rhodamine B, and crystal violet, by simple absorption based on electrostatic interactions. In vitro release of these compounds from the silk particles depends on charge – charge interactions between the compounds and the silk. With crystal violet we demonstrated that the release kinetics are dependent on the secondary structure of the particles.
Keywords: silk, drug delivery, self-assembly, beta sheet
1. Introduction
Several applications in pharmaceutical and medical technology are based on dispersions of particles in a fluid or gel phase. Examples include specialty coatings, sustained-release and drug-delivery systems [1–4]. Suitable particles for such applications need to be biocompatible with the ability to control size, morphology and rate of biodegradation, as well as drug loading and release [5]. The production of suitable particles remains challenging since appropriate materials and processing must be considered, including avoiding organic solvents, surfactants, initiators or cross-linking agents [6–8]. Various synthetic (aliphatic polyesters, poly-anhydrides, aliphatic polycarbonates) and biopolymers (proteins, polysaccharides, polynucleotides) have been investigated to produce particulate carriers for sustained release [2, 4, 9–13]. Natural polymers are often preferred since they can be processed under ambient mild, aqueous conditions. Silk proteins are particularly promising for these needs due to their unique combination of biocompatibility, biodegradability, self-assembly, mechanical stability, controllable structure and morphology [14–24].
In principle two main concepts are utilized to produce small particles: template assisted techniques or phase separation. In the first case usually emulsion droplets are used to define shape and size [25–28]. This enables control but the preparation techniques have the disadvantage of being relatively complicated, and typically emulsion stabilizers and/or cross-linkers are involved [6, 29–31]. In contrast, the bottom up approach through dissolving or solvent shifting by addition of salts or miscible non-solvents is relatively simple and avoids the additions required in templating approaches [32–39]. Spider silk proteins form microparticles upon salting out with potassium phosphate [40–44], whereas for silk fibroin this technique has so far not been investigated in a systematic manner.
We report the assembly process of silk fibroin particles produced in an all-aqueous salting out process. The influence of processing parameters, ionic strength, pH and protein concentration, on yield of particle formation, size, secondary structure and zeta potential is reported. In agreement with previous publications, a model was developed to explain the observed assembly behavior and particle characteristics. Additionally we showed that small molecule model drugs are suitable for controlled sustained release from the silk particles. These investigations include loading, loading efficiencies and release kinetics in relation to molecular charge and size of the particle. Further, the manipulation of release behavior by controlling the secondary structure of silk fibroin particles was demonstrated.
2. Materials and methods
2.1. Materials
Model drugs rhodamine B (479 Da), crystal violet (408 Da), alciane blue (1299 Da) as well as mono- and dibasic potassium phosphate and all other chemicals used in the study were purchased from Sigma–Aldrich (St. Louis, MO). Ultrapure water from the Milli-Q system (Millipore, Billerica, MA) was used.
2.2. Silk purification
Silk fibroin aqueous stock solutions were prepared as previously described [45]. Briefly, cocoons of Bombyx mori were boiled for 30 min in an aqueous solution of 0.02 M sodium carbonate, and then rinsed thoroughly with distilled water. After air drying, the extracted silk fibroin was dissolved in 9.3 M LiBr solution at 60°C for 4 h, yielding a 20% (w/v) solution. The solution was dialyzed against distilled water using Slide-a-Lyzer dialysis cassettes (MWCO 3,500, Pierce) for 3 days to remove the salt. The solution was centrifuged 2 times at 10,000 rpm for 20 min to remove silk aggregates as well as debris from original cocoons. The final concentration of silk fibroin aqueous solution was approximately 8% (w/v), based on weighing the residual solid of a known volume of solution after drying at 60°C. The 8% sil k stock solution was stored at 4°C and diluted with ultrapure water before use.
2.3. Preparation of silk particles
Silk fibroin particles were prepared by inducing a phase separation from an aqueous protein solution by addition of potassium phosphate. Briefly, the silk solution was mixed with potassium phosphate in volumetric ratios of 1:5 using a pipette. The influence of process parameters (ionic strength, pH and protein concentration) on particle formation were studied systematically. The resulting particles were stored in the refrigerator for 2 h before centrifugation at 2,000 g for 15 min. Subsequently, particles were re-dispersed in purified water and washed three times. For experiments related to drug delivery a stock dispersion of protein particle concentration (10 mg/ml) was used. Particle concentrations (particles in mg/ml) were determined gravimetrically. Particles were produced by salting out a silk fibroin solution (c=5 mg/ml) with potassium phosphate (1.25 M, pH 8).
2.4. Post treatment of silk particles
In order to investigate the influence of different post treatments on the secondary structure of silk fibroin particles, FTIR spectra were collected after the various treatments. Particles were incubated in 5, 10, 20, 40, 70 and 100% ethanol or methanol for 24h. Changes in secondary structure were investigated upon sonication of a particle dispersion in a 2 ml Eppendorf tube by using a Branson ultrasonic cell disruptor with an energy output of 20% maximum amplitude for increasing exposure times (5, 10, 20, 30, 40, 60 s).
2.5. Chemical stability of silk particles
Silk particles were exposed to aqueous solutions of 4, 6, and 8 M urea, 2, 4 and 6 M guanidinium hydrochloride (GdmCl) and 6 M guanidinium thiocyanate (GdmSCN). After particle incubation for three days at room temperature, all samples were assessed by phase contrast microscopy and compared to the control sample (incubation in water). If no difference regarding the presence and integrity of the particles was detected, the particles were regarded chemically stable.
2.6. Loading silk particles
Drug loading of the silk particles was conducted as follows: 100 μl of a silk particle suspension containing 2.4 nmol of silk protein was mixed with 900 μl of a model drug solution containing different molar ratios (silk fibroin (SF):model drug (MD) = 5, 10, 20, 30, 40, 60, 100). After 10 min of incubation at room temperature samples were centrifuged for 15 min at 2,000g, and the supernatant was analyzed for residual drug concentration using UV-Vis spectrometry. Standard calibration curves for model drugs were used for drug quantification. A control group of samples containing 100 μl water mixed with 1.0 ml of model drug solution was prepared for each experiment. Drug concentrations of control and sample supernatants were used to calculate the amount of drug incorporated in the silk particles. All experiments were performed in triplicate. Encapsulation efficiency and loading were determined using equation (1) and (2), respectively:
| (1) |
| (2) |
2.7. Release of drugs from silk particles
Drug loaded silk particles were washed with distilled water and suspended in 1 ml PBS (pH 7.4) before incubation at 37°C with constan t shaking. Each vial contained 2 mg of drug loaded particles comprising 4.8 nmol silk protein. The solvent was periodically removed from each sample and replaced with fresh PBS (pH 7.4). The drug content in the medium was analyzed using UV-Vis-spectrometry. The percentage of cumulative model drug release (% w/w) was investigated as a function of incubation time. Each experiment was performed in triplicate. To study the effect of secondary structure of silk particles on release behavior, 2 mg drug loaded silk particles produced at pH 7, pH 8 and pH 9 were incubated in 1.0 ml PBS at pH 7.4 for 7 days. The solvent was withdrawn daily and the particles were redispersed in fresh media. Supernatants of drawn samples were analyzed for drug content with UV-Vis-spectrometry.
2.8. Characterization
2.8.1. UV-Vis-spectrometry
Ultraviolet–visible spectrometry, using a Genesys6 (Thermo Fisher Scientific Inc., Waltham, MA, USA), was employed for determination of drug concentration in supernatants as a basis for the calculation of loading efficiency and release behavior. Calibration curves for all model drugs were obtained by using five different concentrations of all stock solutions.
2.8.2. Fourier transform infrared (FTIR) spectroscopy
Washed silk particle samples were first cast on CaF2 IR transparent discs and then placed under a IMV-4000 multi-channel FTIR microscopic spectrometer (Jasco, Japan, interfaced to a FT/IR-6200 Spectrometer), with a liquid nitrogen cooled MCT (mercury cadmium telluride) detector. Analysis was performed in transmission mode using the microscope. The position and focus of the samples were adjusted microscopically through an aperture in the IR optical system. For each measurement, 128 scans were co-added and Fourier transformed employing a Genzel-Happ apodization function to yield spectra with a nominal resolution of 4 cm−1. The wave number ranged from 400 to 4000 cm−1. To identify secondary structures of protein samples from the absorption spectra, the amide I region (1595~1705 cm−1) was investigated by Fourier self-deconvolution [46] using the Opus 5.0 software from Bruker Optics Corp. (Billerica MA), as described previously. Using a high pass filter, the broad and indistinct amide I bands (C=O stretching bonds in protein backbones) were narrowed synthetically to provide a deconvoluted spectrum with better peak resolution [46]. The deconvoluted spectra were curve-fitted by subsequent Gaussian peaks [46]. Finally, the deconvoluted amide I spectra were area-normalized, and the relative areas of the single bands were used to determine the fraction of the secondary structural elements. Absorption bands in the frequency range of 1616–1637 cm−1 and 1695–1705 cm−1 represented enriched β-sheet structure in silk II form. Absorption bands in the frequency range of 1638–1655 cm−1 were ascribed to random coil, 1656–1663 cm−1 ascribed to alpha-helices and 1663–1695 cm −1 to turns [46].
2.8.3. Scanning electron microscopy (SEM) and light microscopy
Twenty microliters of the silk particle suspension in water (see above) were added directly on top of a conductive tape mounted on a SEM sample stub. The samples were dried overnight in air and then sputtered with platinum. The morphologies of silk spheres were imaged using a Zeiss Supra 55 VP SEM (Carl Zeiss SMT, Peabody, MA). For light microscopy, 20 μl silk particle suspensions on top of a glass slide were placed under an inverted light microscope (Carl Zeiss, Jena, Germany). Images were taken with the installed software.
2.8.4. Dynamic light scattering
DLS experiments were performed using a Brookhaven Instrument BI200-SM goniometer (Holtsville, NY) equipped with a diode laser operated at a wavelength, λ= 532 nm. The temperature was kept at 25°C with 0.05° C accuracy with a temperature-controlled re-circulating bath. Refractive indices of 1.33 for water and 1.60 for protein were taken for computation of particle sizes. In addition, a dry specimen of each preparation was analyzed by scanning electron microscopy (SEM) to confirm spherical shape and sphere size.
2.8.5. Zeta potential analysis
Zeta potential measurements were determined using a Nanoseries Malvern Zetasizer (Malvern, Worcestershire, UK). In order to investigate the influence of particle loading, zeta potential measurements were conducted as a function of model drug content.
2.8.6. Confocal Microscopy
The RhB-loaded silk particles were prepared and resuspended in purified water. A small portion of the suspension was imaged using a 63×, 1.4 N.A. water 14 immersion lens on a Leica DMIRE2 microscope (Welzlar, Germany) at an excitation wavelength of 555 nm and an emission wavelength of 580 nm. Several xy scans with an optical slice of 100 nm were stacked along the z-direction to obtain a 3-d image and visualize the crossections of silk particles and the distribution of encapsulated RhB.
3. Results and Discussion
3.1. Formation of silk particles
The influence of ionic strength on particle formation was studied by addition of potassium phosphate (pH 8) of different ionic strengths to an aqueous silk fibroin solution of c = 5 mg/ml. The salting out efficiency was calculated using equation (3). The presence of particles was examined by light microscopy.
| (3) |
Figure 1a illustrates the salting out efficiency as a function of ionic strength. The lower threshold for particle formation was determined to be approximately 0.75 M. The influence of pH on particle formation was studied by employing 1.25 M potassium phosphate. The pH was adjusted by mixing mono- and dibasic potassium phosphate solutions (KH2PO4 solution = pH 4; K2HPO4 solution = pH 9), which are almost identical in their salting-out efficiency. Only PO43− ions have a stronger salting-out behavior. Therefore, the influence of pH on salting-out can be monitored in the range from pH 4 to 9. Figure 1b shows the salting out efficiency as a function of pH and the micrographs taken of particles produced at pH 4, 6 and 9. Below pH 5 the particles aggregated into non-dispersible clusters due to dominating intermolecular hydrogen bonding, which correlates with the theoretical isoelectric point of silk fibroin, pI = 4.53 [47]. Figure 1c–e) shows scanning electron micrographs of the particles formed at pH 4, 5 and 6. No difference of particle morphology produced at pH > 6 was evident.
Figure 1.
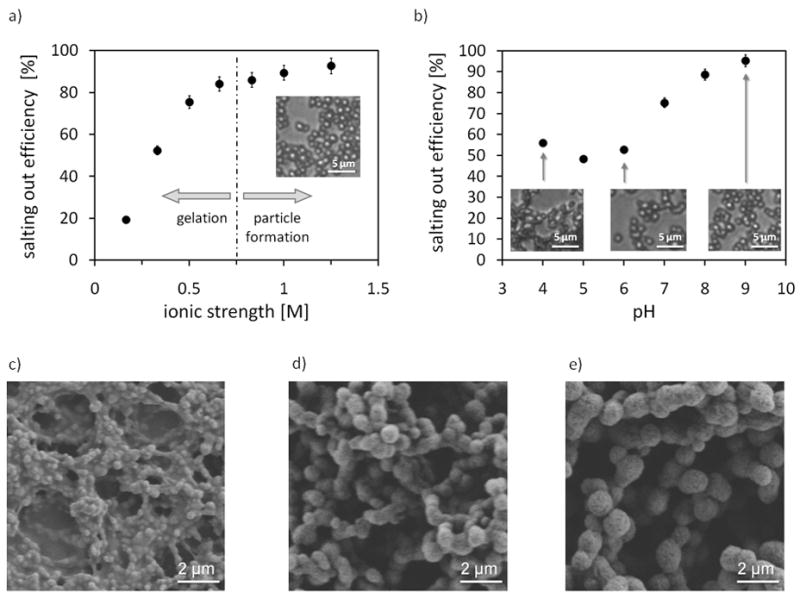
Influence of process parameters on silk particle formation by salting out. a) Salting out efficiency as a function of ionic strength of potassium phosphate at pH 8. b) Salting out efficiency as a function of pH employing 1.25 M potassium phosphate. c–e) Scanning electron micrographs of particles produced by salting out with 1.25 M potassium phosphate at c) pH 4, d) pH 5 and e) pH 6.
3.2. Post treatment
In order to investigate the influence of post processing treatment with alcohols or sonication on the secondary structure of silk fibroin particles, FTIR spectra were recorded. Figure 2a shows only minor changes in secondary structure upon treatments with increasing ethanol concentration. Therefore the particles can be sterilized with ethanol without affecting their secondary structure. Interestingly methanol treatments showed a similar result (Figure 2b) indicating that the silk I - conformation was stable. Sonication is often used for making particle suspensions in formulations. Since silk hydrogels with silk II conformation are formed upon sonication of a silk solution for exposure times < 30s [48], FTIR spectra were recorded of particles after sonication at 20% maximum amplitude for increasing exposure times (5, 10, 20, 30, 40, 60 s). Figure 2c shows that only with an exposure time >40s the silk I particles undergo a change in conformation to silk II. Microscopy analysis showed that particle integrity did not change.
Figure 2.
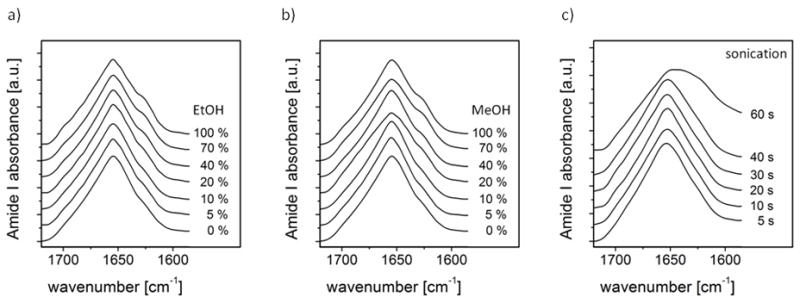
FTIR spectra of silk particles produced by salting out with potassium phosphate (1.25 M, pH 8) followed by treatment with ethanol, methanol or sonication. a) EtOH (incubated for 24h). b) MeOH (incubated for 24h). c) Sonication with 20% maximum amplitude for exposure times indicated.
3.3. Size control
Salting out silk fibroin with 1.25 M potassium phosphate (pH 8) revealed larger particles with increasing protein concentration. Dynamic light scattering showed that in the concentration range between 0.25 mg/ml and 2 mg/ml particle size increased linearly from an average diameter of 486 nm to 1.2 μm with a narrow size distribution (Figure 3a,b). From 4 mg/ml to 8 mg/ml the average size increased slightly from 1.4 to 2.0 μm with a broader size distribution (Figure 3a,b). Above a concentration of 10 mg/l the size distribution increased, and the formation of clusters and amorphous aggregates was observed (Figure 3a,b,e). The averages sizes were confirmed qualitatively by SEM (Figure 3c–d).
Figure 3.
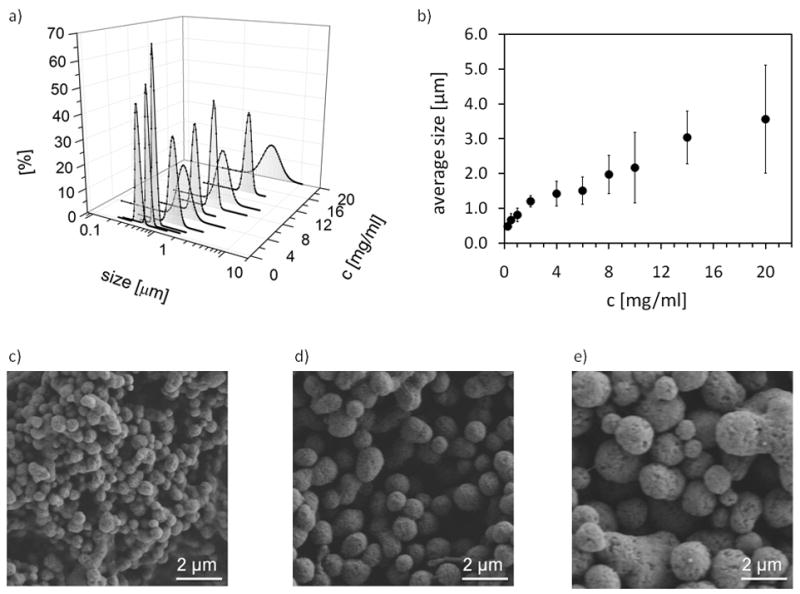
Size analysis of silk particles produced from different concentrations of protein by salting out with potassium phosphate (1.25 M, pH 8). a) Size distributions of silk particles as a function of protein concentration. b) Average size of silk particles as a function of protein concentration. Error bars indicate the width of the size distribution. c)–e) Scanning electron micrographs of silk particles produced by salting out with potassium phosphate (1.25 M, pH 8) from silk fibroin solution of c) 0.25 mg/ml, d) 2 mg/ml e) 20 mg/ml.
3.4. Control of secondary structure and zeta potential
FTIR analysis of silk fibroin particles produced at different pH values showed that the secondary structure changed from a silk II-rich structure at pH 4 to a silk I-rich structure at pH 9 (Figure 4a). The secondary structure composition of particles produced at different pHs was determined by Fourier self deconvolution (FSD). Example FSD spectra for pH 6 and pH 8 are shown in Figure 4c, d. Table 1 provides an overview of the secondary structures for the different particles produced. Zeta potential measurements of particles produced at different pH values indicate that the zeta potential increased from −26.3 mV (pH 4) to −46.0 mV (pH 9) when measured after washing three times with ultrapure water (Figure 4b).
Figure 4.
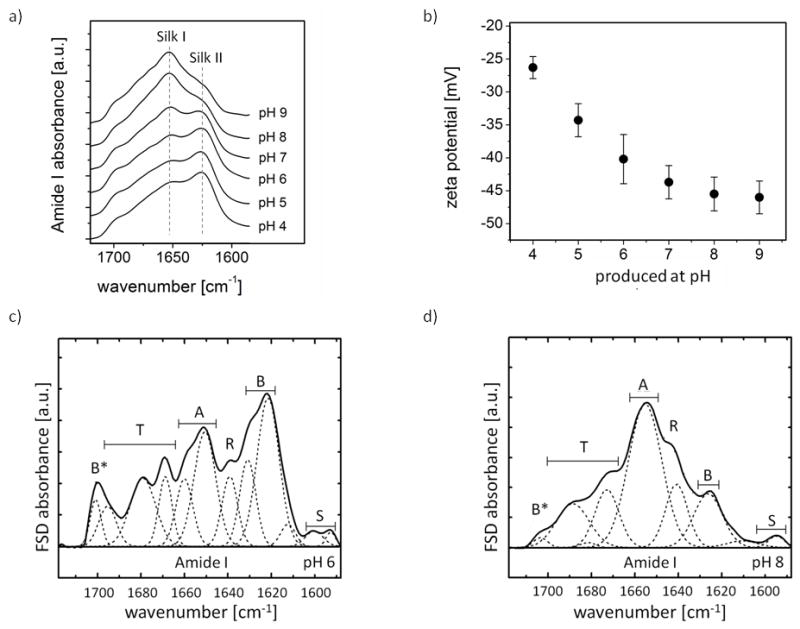
Control of secondary structure and zeta potential of silk fibroin particles. a) FTIR spectra of particles produced by salting out with 1.25 M potassium phosphate at different pH values. b) Zeta potential of particles produced by salting out with 1.25 M potassium phosphate at different pH values. Error bars indicate the width of the zeta potential distribution of the particles. c–d) Fourier self deconvolution of FTIR spectra for particles produced by salting out with 1.25 M potassium phosphate at c) pH 6 and d) pH 8.
Table 1.
Secondary structure content of silk fibroin particles produced by salting out with 1.25 M potassium phosphate at different pH values.
| Particles produced at | pH 4 | pH 5 | pH 6 | pH 7 | pH 8 | pH 9 |
|---|---|---|---|---|---|---|
| Secondary structure | ||||||
| Beta-sheets [%] (±2%) (1610–1635 cm−1, 1695–1700 cm−1) |
39.4 | 37.4 | 37.4 | 31.1 | 15.1 | 21.5 |
| Alpha-Helix [%] (1647–1664 cm−1) (±2%) |
24.1 | 25 | 26.1 | 29.9 | 44.1 | 38.4 |
| Random-coil [%] (1635–1645 cm−1) (±1%) |
9.2 | 8.6 | 10.3 | 10.6 | 12.5 | 10.2 |
| Beta-turns [%] (1666–1695 cm−1) (±2%) |
25.7 | 26.8 | 24.3 | 27.3 | 26.7 | 28.7 |
| others [%] (1590–1605 cm−1) (±0.5%) |
1.6 | 1.2 | 1.9 | 1.1 | 1.6 | 1.2 |
| (1699–1703cm−1) (±1%) | 5.5 | 3.1 | 3.7 | 1.1 | 1.2 | 2 |
3.5. Chemical Stability
The chemical stability of particles produced at pH 7, pH 8 and pH 9 was assessed by incubation of particles in urea and chaotrope salts like GdmHCl and GdmSCN at different concentrations. All particles were stable in water and dissolved in 6M GdmSCN (Table 2). Within the studied pH range the chemical stability of the particles decreased when the particles were produced at lower pH values (with higher silk II structural content) (Table 2).
Table 2.
Solubility of silk fibroin particles produced at different pH values in water; at 4, 6, 8M Urea; at 2, 4, 6 M GdmHCl and at 6 M GdmSCN.
| Resolved in | Water | Urea | Urea | GdmHCl | GdmHCl | GdmHCl | GdmSCN |
|---|---|---|---|---|---|---|---|
| 6 M | 8 M | 2 M | 4 M | 6 M | 6 M | ||
| Particles produced at | |||||||
| pH 9 | − | − | − | − | − | − | + |
| pH 8 | − | − | − | − | − | +/− | + |
| pH 7 | − | − | +/− | − | +/− | + | + |
After particle incubation for three days at room temperature, all samples were assessed by phase contrast microscopy and compared to the control sample (incubation in water). If no difference regarding the presence and integrity of the particles was detected the particles were regarded chemically stable.. + fully resolved particles, − non-soluble/stable intact particles, +/− morphology change of particles into a gel like structure.
3.6. Model for silk fibroin particle formation
The influence of pH on the secondary structure and zeta potential of silk particles is based on the amino acid composition of silk fibroin. Characteristics of the silk protein heavy(H) and light(L)-chain is shown in Figure 5a. The H- and L-chains are linked by a single disulfide bond at the twentieth residue from the carboxyl terminus of H-chain (Cys-c20) and Cys-172 of L-chain [49]. For determining the salting-out behavior, the protein has been (virtually) subdivided into four domains (N-Terminus, repetitive part, C-Terminus and L-chain). To compute the values of physico-chemical properties (charge, isoelectric point (pI), hydropathicity [50] and size) for each domain the ProtParam tool (ExPASy: Expert Protein Analysis System) was used [51]. The amino acid sequences for H-fibroin and L-fibroin have been employed based on the Swiss-Prot/TrEMBL accession numbers P05790 and P21828. The amino acids were classified as positively charged (R and K), negatively charged (D and E), hydrophobic (A, G, L, V, W, C, I, M, F, P), and hydrophilic (N, Q, S, T, Y, R, D, E, H, K). The N- and C-termini are hydrophilic domains with the N-terminus being negatively charged (pI = 4.6) and the C-terminus (pI = 10.5) being positively charged. The repetitive part (pI = 3.8) consists of long hydrophobic domains with short intervening hydrophilic blocks (spacers) with negative charges. The L-chain has a counterbalanced amphiphilicity and a slightly dominant average negative charge. Based on these characteristics of the domains and previously published data regarding the relationships between amino acid composition and silk protein phase separation, salting-out behavior and self-assembly [43, 52–60], a model for particle formation has been developed. The theoretical pI of the domains can be used to describe the influence of pH on the charge distribution of the silk fibroin protein associated with self-assembly due to intra- and intermolecular forces. At pH 9 all charged amino acid side chains except the C-terminus are negatively charged resulting in a likely rather elongated molecular conformation in solution due to repulsive charge-charge interactions along the biopolymer backbone (Figure 5b, right). As the pH is lowered the repulsive interactions along the protein are suppressed, resulting in a less extended and more compact conformation (Figure 5b, middle). At pH 4, electrostatic repulsion is suppressed allowing the approaching of neighboring residues and molecules and the formation of hydrophobic interactions and later hydrogen bonds between molecules [53]. The formation of particles is based on the salting-out effect of kosmotropic salts like potassium phosphate. In a first step the protein chains form micellar like structures due to the enhancement of hydrophobic interactions. Depending on the structural conformation of the silk fibroin predetermined by pH, different micellar structures with different packing densities are formed. In a second step the micelles form particulate globules by further hydrophobic interactions. The micelles formed at pH 9 reveal a less dense packing than those made at acidic pH. Therefore, tighter packing of the micelles in the particles is possible due to additional hydrophobic interactions, which might lead to the detected higher chemical stability (although the silk I structure should be thermodynamically less stable than the silk II structure the particles with high silk I content a chemically more stable than those with silk II structure).
Figure 5.
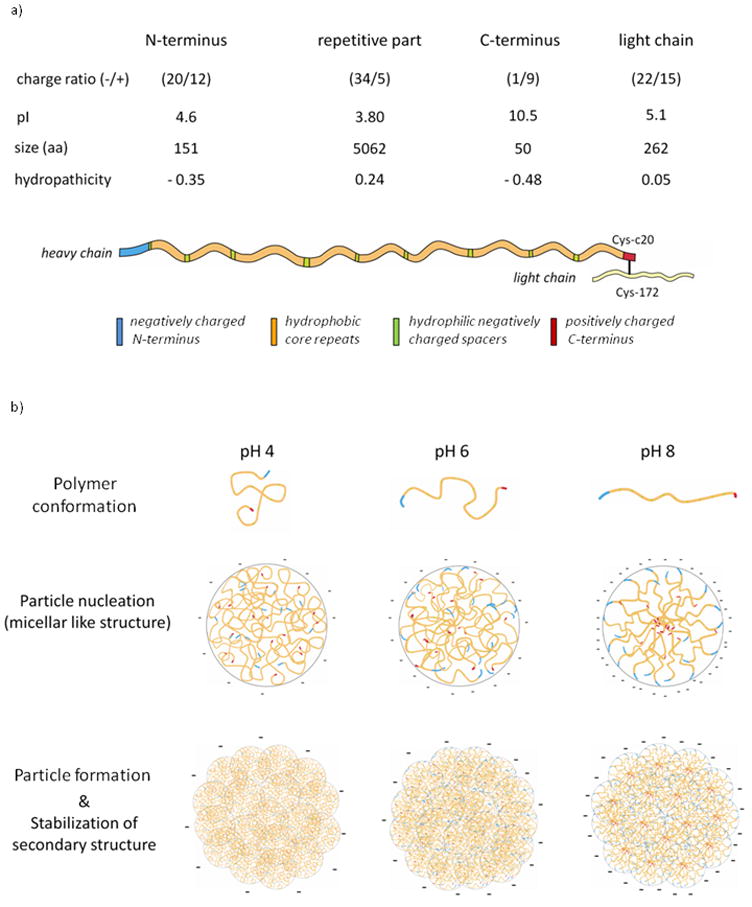
Silk fibroin characteristics and particle formation. a) Characteristics of silk fibroin considering the charge distribution along the amino acid chain. b) Model for silk fibroin particle formation. Top: Assumed configuration of amino acid chains at different pHs. Middle: Particle nucleation of micellar like structures. Bottom: Particle formation and stabilization of secondary structures through clustering of micellar like structures in the presence of potassium phosphate (>1.0 M).
3.7. Loading
In order to investigate the applicability of silk fibroin particles as a drug delivery systems, three positively charged low molecular model drugs (alcian blue (6 positive charges, MW=1,299 Da); rhodamine B (hybrid ion, MW=479 Da); crystal violet (1 positive charge, MW=408)) were loaded on negatively charged silk fibroin particles by charge-charge interaction. Upon incubation of particles in drug solution, drug molecules adhere to the surface followed by diffusion into the protein matrix. The loading was studied with respect to the molar ratio of the model drug (MD) to silk fibroin (SF) (Figure 6a,b). Loading efficiencies above 95% are achieved up to 6% matrix loading (exemplarily shown for crystal violet and alcian blue). After 6% loading, the loading efficiency decreases indicating that the protein matrix is saturated. Confocal images of RhB loaded silk fibroin particles illustrate that small molecular drugs diffuse into the matrix (Figure 6d). Zeta potential measurements of extracted particles showed that the zeta potential decreases with increasing loading and in the case of alcian blue the potential becomes positive for loadings >7% (Figure 6c) accompanying the decreasing loading efficiency of alcian blue (Figure 6a,b).
Figure 6.
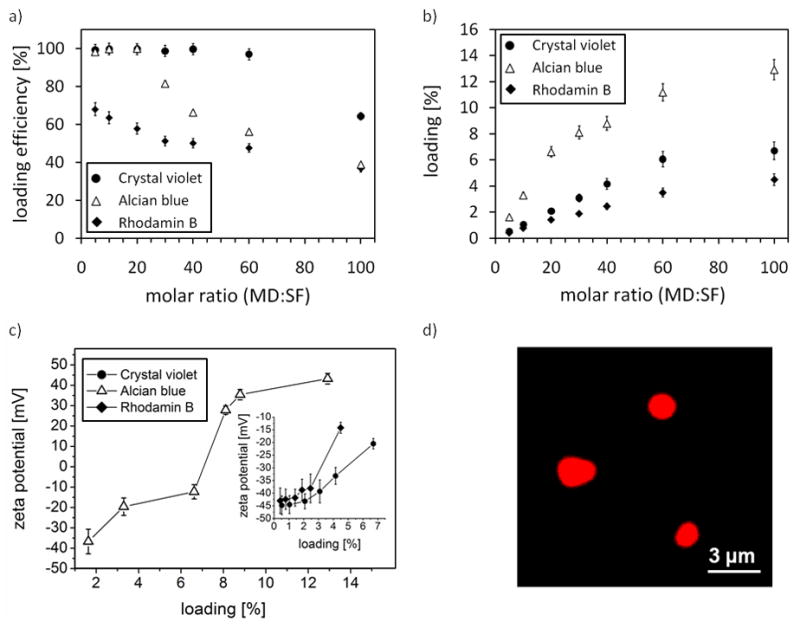
Loading of silk fibroin particles. a) Loading efficiencies of silk fibroin particles incubated in aqueous solutions containing the model drugs (MD) crystal violet, alcian blue and rhodamin B of different concentrations yielding molar ratios of model drug (MD) : silk fibroin (SF) as indicated. b) Loading of particles (i.e. model drug content). c) Zeta potential of crystal violet, alcian blue and rhodamine B loaded particles as a function of loading. d) Confocal microscopy of RhB loaded particles.
3.8. Release
The in vitro release behavior of the model drugs from the particles showed that positively charged molecules were released in a more prolonged or sustained fashion. The initial burst (cumulative release within the first 3 hours) was 83% for rhodamine B, 17% for crystal violet, and 3% for alcian blue (Figure 7a). The influence of the secondary structure of the particles on their release behavior was studied with crystal violet (CV). Particles with a higher content of silk II structure showed an increased initial burst with release of 29% CV for particles produced at pH 7, 17% CV for particles produced at pH 8, and 11% CV for particles produced at pH 9 (Figure 7b). Particles produced at pH 7 show an increased release rate over the whole period of time compared to particles produced at pH 8 and pH 9 (Figure 7b).
Figure 7.
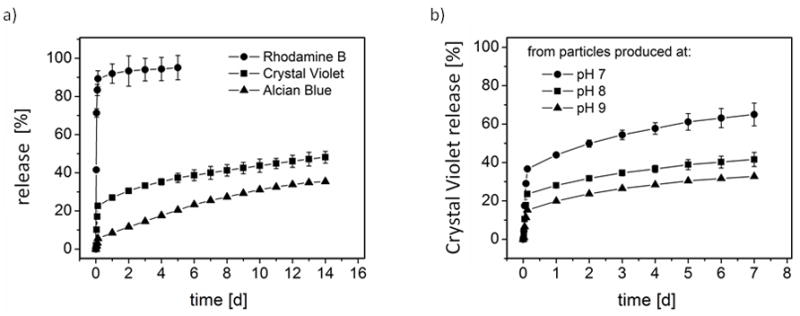
Release from silk fibroin particles. a) Release of rhodamine B, crystal violet and alcian blue from particles produced by salting with potassium phosphate (1.25 M, pH 8) b) Crystal violet release from particles produced at different pH values.
4. Conclusions
Silk fibroin particles of controllable sizes (500 nm - 2 μm) can be obtained in an all-aqueous process by salting out with potassium phosphate (>0.75 M). Additionally the secondary structure and the zeta potential of the particles can be controlled by varying the pH. The chemical stability (Urea, GdmHCl, GdmSCN) of silk particles as well as the stability of secondary structure upon post treatments (EtOH and MeOH) indicate that the particles with silk I structure are very stable and can be sterilized without affecting their secondary structure. We propose a model to explain the observed influence of pH on secondary structure and zeta potential and conclude that larger particles produced by salting out are comprised of smaller micellar like structures. We showed the applicability of the particles for controlled release. The negative surface charge of the particles enables loading with positively charged small molecules by simple charge-charge interaction and diffusion into the particle matrix. In vitro release revealed that the release of small molecules depends on their charge as well as the silk structure. The simplicity of the all-aqueous production and loading process, as well as the tunable secondary structures suggest that these silk particles have an interesting potential as drug carriers in diverse biomedical applications.
Acknowledgments
This work was supported by the International Graduate School of Science and Engineering (IGSSE to AL) within the Elite Network of Bavaria and SFB840 (TP8) to TS and the NIH P41 EB002520 Tissue Engineering Resource Center and the AFOSR to DK.
Footnotes
Publisher's Disclaimer: This is a PDF file of an unedited manuscript that has been accepted for publication. As a service to our customers we are providing this early version of the manuscript. The manuscript will undergo copyediting, typesetting, and review of the resulting proof before it is published in its final citable form. Please note that during the production process errors may be discovered which could affect the content, and all legal disclaimers that apply to the journal pertain.
References
- 1.Langer R. New methods of drug delivery. Science. 1990;249:1527–33. doi: 10.1126/science.2218494. [DOI] [PubMed] [Google Scholar]
- 2.Freiberg S, Zhu XX. Polymer microspheres for controlled drug release. Int J Pharm. 2004;282:1–18. doi: 10.1016/j.ijpharm.2004.04.013. [DOI] [PubMed] [Google Scholar]
- 3.Edlund U, Albertsson AC. Degradable polymer microspheres for controlled drug delivery. In: Albertsson AC, editor. Degradable Aliphatic Polyesters. Berlin: Springer; 2002. pp. 67–112. [Google Scholar]
- 4.Langer R, Peppas NA. Advances in biomaterials, drug delivery, and bionanotechnology. AIChE J. 2003;49:2990–3006. [Google Scholar]
- 5.Daniel SK. Microparticles and nanoparticles for drug delivery. Biotechnol Bioeng. 2007;96:203–9. doi: 10.1002/bit.21301. [DOI] [PubMed] [Google Scholar]
- 6.Vandelli MA, Rivasi F, Guerra P, Forni F, Arletti R. Gelatin microspheres crosslinked with, -glyceraldehyde as a potential drug delivery system: preparation, characterisation, in vitro and in vivo studies. Int J Pharm. 2001;215:175–84. doi: 10.1016/s0378-5173(00)00681-5. [DOI] [PubMed] [Google Scholar]
- 7.Arshady R. Review: Biodegradable microcapsular drug delivery systems: manufacturing methodology, release control and targeting prospects. J Bioact Compat Pol. 1990;5:315–42. [Google Scholar]
- 8.George AD, Thomas BG, Vinod PS. Cross-linking of gelatin capsules and its relevance to their in vitro-in vivo performance. J Pharm Sci. 1994;83:915–21. doi: 10.1002/jps.2600830702. [DOI] [PubMed] [Google Scholar]
- 9.George M, Abraham TE. Polyionic hydrocolloids for the intestinal delivery of protein drugs: alginate and chitosan -- a review. J Control Release. 2006;114:1–14. doi: 10.1016/j.jconrel.2006.04.017. [DOI] [PubMed] [Google Scholar]
- 10.Liu X, Sun Q, Wang H, Zhang L, Wang J-Y. Microspheres of corn protein, zein, for an ivermectin drug delivery system. Biomaterials. 2005;26(1):109–15. doi: 10.1016/j.biomaterials.2004.02.013. [DOI] [PubMed] [Google Scholar]
- 11.Won Y-W, Kim Y-H. Recombinant human gelatin nanoparticles as a protein drug carrier. J Control Release. 2008;127:154–61. doi: 10.1016/j.jconrel.2008.01.010. [DOI] [PubMed] [Google Scholar]
- 12.Sahin S, Selek H, Ponchel G, Ercan MT, Sargon M, Hincal AA, et al. Preparation, characterization and in vivo distribution of terbutaline sulfate loaded albumin microspheres. J Control Release. 2002;82:345–58. doi: 10.1016/s0168-3659(02)00141-4. [DOI] [PubMed] [Google Scholar]
- 13.Latha MS, Rathinam K, Mohanan PV, Jayakrishnan A. Bioavailability of theophylline from glutaraldehyde cross-linked casein microspheres in rabbits following oral administration. J Control Release. 1995;34:1–7. [Google Scholar]
- 14.Allmeling C, Jokuszies A, Reimers K, Kall S, Choi CY, Brandes G, et al. Spider silk fibres in artificial nerve constructs promote peripheral nerve regeneration. Cell Proliferat. 2008;41:408–20. doi: 10.1111/j.1365-2184.2008.00534.x. [DOI] [PMC free article] [PubMed] [Google Scholar]
- 15.Vollrath F, Barth P, Basedow A, Engström W, List H. Local tolerance to spider silks and protein polymers in vivo. In Vivo. 2002;16:229–34. [PubMed] [Google Scholar]
- 16.Hardy JG, Römer LM, Scheibel TR. Polymeric materials based on silk proteins. Polymer. 2008;49:4309–27. [Google Scholar]
- 17.Altman GH, Diaz F, Jakuba C, Calabro T, Horan RL, Chen J, et al. Silk-based biomaterials. Biomaterials. 2003;24:401–16. doi: 10.1016/s0142-9612(02)00353-8. [DOI] [PubMed] [Google Scholar]
- 18.Horan RL, Antle K, Collette AL, Wang Y, Huang J, Moreau JE, et al. In vitro degradation of silk fibroin. Biomaterials. 2005;26:3385–93. doi: 10.1016/j.biomaterials.2004.09.020. [DOI] [PubMed] [Google Scholar]
- 19.Hofmann S, Wong Po Foo CT, Rossetti F, Textor M, Vunjak-Novakovic G, Kaplan DL, et al. Silk fibroin as an organic polymer for controlled drug delivery. J Control Release. 2006;111:219–27. doi: 10.1016/j.jconrel.2005.12.009. [DOI] [PubMed] [Google Scholar]
- 20.Wang Y, Rudym DD, Walsh A, Abrahamsen L, Kim H-J, Kim HS, et al. In vivo degradation of three-dimensional silk fibroin scaffolds. Biomaterials. 2008;29:3415–28. doi: 10.1016/j.biomaterials.2008.05.002. [DOI] [PMC free article] [PubMed] [Google Scholar]
- 21.Huang F, Sun L, Zheng J. In Vitro and In Vivo Characterization of a silk fibroin-coated polyester vascular prosthesis. Artif Organs. 2008;32:932–41. doi: 10.1111/j.1525-1594.2008.00655.x. [DOI] [PubMed] [Google Scholar]
- 22.Lammel A, Keerl D, Römer L, Scheibel T. Proteins: Polymers of natural origin. In: Hu J, editor. Recent Advances in Biomaterials Research. Trivandrum: Transworld Research Network; 2008. pp. 1–22. [Google Scholar]
- 23.Heim M, Keerl D, Scheibel T. Spider silk: From soluble protein to extraordinary fibers. Angew Chem Int Ed Engl. 2009;48:3584–96. doi: 10.1002/anie.200803341. [DOI] [PubMed] [Google Scholar]
- 24.Heim M, Römer L, Scheibel T. Hierarchical structures made of protein. Chem Soc Rev. 2010;39:156–64. doi: 10.1039/b813273a. [DOI] [PubMed] [Google Scholar]
- 25.Donath E, Sukhorukov GB, Caruso F, Davis SA, Möhwald H. Novel Hollow polymer shells by colloid-templated assembly of polyelectrolytes. Angew Chem Int Ed Engl. 1998;37:2201–5. doi: 10.1002/(SICI)1521-3773(19980904)37:16<2201::AID-ANIE2201>3.0.CO;2-E. [DOI] [PubMed] [Google Scholar]
- 26.Hermanson KD, Huemmerich D, Scheibel T, Bausch AR. Engineered microcapsules fabricated from reconstituted spider silk. Adv Mater. 2007;19:1810–15. [Google Scholar]
- 27.Wang X, Wenk E, Matsumoto A, Meinel L, Li C, Kaplan DL. Silk microspheres for encapsulation and controlled release. J Control Release. 2007;117:360–70. doi: 10.1016/j.jconrel.2006.11.021. [DOI] [PubMed] [Google Scholar]
- 28.Wenk E, Wandrey AJ, Merkle HP, Meinel L. Silk fibroin spheres as a platform for controlled drug delivery. J Control Release. 2008;132:26–34. doi: 10.1016/j.jconrel.2008.08.005. [DOI] [PubMed] [Google Scholar]
- 29.Gobin AS, Rhea R, Newman RA, Mathur AB. Silk-fibroin-coated liposomes for long-term and targeted drug delivery. Int J Nanomed. 2006;1:81–7. doi: 10.2147/nano.2006.1.1.81. [DOI] [PMC free article] [PubMed] [Google Scholar]
- 30.Rubino OP, Kowalsky R, Swarbrick J. Albumin Microspheres as a drug delivery system: Relation among turbidity ratio, degree of cross-linking, and drug release. Pharmaceut Res. 1993;10:1059–65. doi: 10.1023/a:1018979126326. [DOI] [PubMed] [Google Scholar]
- 31.MacAdam AB, Shafi ZB, James SL, Marriott C, Martin GP. Preparation of hydrophobic and hydrophilic albumin microspheres and determination of surface carboxylic acid and amino residues. Int J Pharm. 1997;151:47–55. [Google Scholar]
- 32.Weber C, Coester C, Kreuter J, Langer K. Desolvation process and surface characterisation of protein nanoparticles. Int J Pharm. 2000;194:91–102. doi: 10.1016/s0378-5173(99)00370-1. [DOI] [PubMed] [Google Scholar]
- 33.Brick MC, Palmer HJ, Whitesides TH. Formation of colloidal dispersions of organic materials in aqueous media by solvent shifting. Langmuir. 2003;19:6367–80. [Google Scholar]
- 34.Zhang Y-Q, Shen W-D, Xiang R-L, Zhuge L-J, Gao W-J, Wang W-B. Formation of silk fibroin nanoparticles in water-miscible organic solvent and their characterization. J Nanopart Res. 2007;9:885–900. [Google Scholar]
- 35.Allémann E, Gurny R, Doelker E. Preparation of aqueous polymeric nanodispersions by a reversible salting-out process: influence of process parameters on particle size. Int J Pharm. 1992;87:247–53. [Google Scholar]
- 36.Reza A. Microspheres and microcapsules, a survey of manufacturing techniques Part II: Coacervation. Polym Eng Sci. 1990;30:905–14. [Google Scholar]
- 37.Reza A. Microspheres and microcapsules, a survey of manufacturing techniques: Part III: Solvent evaporation. Polym Eng Sci. 1990;30:915–24. [Google Scholar]
- 38.Horn D, Rieger J. Organic nanoparticles in the aqueous phase - Theory, experiment, and use. Angew Chem Int Ed Engl. 2001;40:4330–61. doi: 10.1002/1521-3773(20011203)40:23<4330::aid-anie4330>3.0.co;2-w. [DOI] [PubMed] [Google Scholar]
- 39.Cao Z, Chen X, Yao J, Huang L, Shao Z. The preparation of regenerated silk fibroin microspheres. Soft Matter. 2007;3:910–15. doi: 10.1039/b703139d. [DOI] [PubMed] [Google Scholar]
- 40.Slotta UK, Rammensee S, Gorb S, Scheibel T. An engineered spider silk protein forms microspheres. Angew Chem Int Ed Engl. 2008;47:4592–4. doi: 10.1002/anie.200800683. [DOI] [PubMed] [Google Scholar]
- 41.Lammel A, Schwab M, Slotta U, Winter G, Scheibel T. Processing conditions for the formation of spider silk microspheres. Chem Sus Chem. 2008;1:413–6. doi: 10.1002/cssc.200800030. [DOI] [PubMed] [Google Scholar]
- 42.Rammensee S, Slotta U, Scheibel T, Bausch AR. Assembly mechanism of recombinant spider silk proteins. Proc Natl Acad Sci USA. 2008;105:6590–5. doi: 10.1073/pnas.0709246105. [DOI] [PMC free article] [PubMed] [Google Scholar]
- 43.Liebmann B, Hümmerich D, Scheibel T, Fehr M. Formulation of poorly water-soluble substances using self-assembling spider silk protein. Colloids Surf A. 2008;331:126–32. [Google Scholar]
- 44.Lammel A, Schwab M, Hofer M, Winter G, Scheibel T. Spider silk submicroparticles for controlled drug delivery. submitted for publication. [Google Scholar]
- 45.Sofia S, McCarthy MB, Gronowicz G, Kaplan DL. Functionalized silk-based biomaterials for bone formation. J Biomed Mat Res. 2001;54:139–48. doi: 10.1002/1097-4636(200101)54:1<139::aid-jbm17>3.0.co;2-7. [DOI] [PubMed] [Google Scholar]
- 46.Hu X, Kaplan DL, Cebe P. Determining beta-sheet crystallinity in fibrous proteins by thermal analysis and infrared spectroscopy. Macromolecules. 2006;39:6161–70. [Google Scholar]
- 47.Foo CWP, Bini E, Hensman J, Knight DP, Lewis RV, Kaplan DL. Role of pH and charge on silk protein assembly in insects and spiders. Appl Phys A. 2006;82:223–33. [Google Scholar]
- 48.Wang X, Kluge JA, Leisk GG, Kaplan DL. Sonication-induced gelation of silk fibroin for cell encapsulation. Biomaterials. 2008;29:1054–64. doi: 10.1016/j.biomaterials.2007.11.003. [DOI] [PMC free article] [PubMed] [Google Scholar]
- 49.Tanaka K, Kajiyama N, Ishikura K, Waga S, Kikuchi A, Ohtomo K, et al. Determination of the site of disulfide linkage between heavy and light chains of silk fibroin produced by Bombyx mori. Biochim Biophys Acta. 1999;1432:92–103. doi: 10.1016/s0167-4838(99)00088-6. [DOI] [PubMed] [Google Scholar]
- 50.Kyte J, Doolittle RF. A simple method for displaying the hydropathic character of a protein. J Mol Biol. 1982;157:105–32. doi: 10.1016/0022-2836(82)90515-0. [DOI] [PubMed] [Google Scholar]
- 51.Swiss Institute of Bioinformatics. ExPASy Proteomics Server. 2009 December; Available from URL: http://www.expasy.ch/
- 52.Jin H-J, Kaplan DL. Mechanism of silk processing in insects and spiders. Nature. 2003;424:1057–61. doi: 10.1038/nature01809. [DOI] [PubMed] [Google Scholar]
- 53.Terry AE, Knight DP, Porter D, Vollrath F. pH Induced Changes in the rheology of silk fibroin solution from the middle division of bombyx mori silkworm. Biomacromolecules. 2004;5:768–72. doi: 10.1021/bm034381v. [DOI] [PubMed] [Google Scholar]
- 54.Mita K, Ichimura S, James TC. Highly repetitive structure and its organization of the silk fibroin gene. J Mol Evol. 1994;38:583–92. doi: 10.1007/BF00175878. [DOI] [PubMed] [Google Scholar]
- 55.Sponner A, Unger E, Grosse F, Weisshart K. Conserved C-termini of spidroins are secreted by the major ampullate glands and retained in the silk thread. Biomacromolecules. 2004;5:840–5. doi: 10.1021/bm034378b. [DOI] [PubMed] [Google Scholar]
- 56.Bini E, Knight DP, Kaplan DL. Mapping domain structures in silks from insects and spiders related to protein assembly. J Mol Biol. 2004;335:27–40. doi: 10.1016/j.jmb.2003.10.043. [DOI] [PubMed] [Google Scholar]
- 57.Chen P, Kim HS, Park C-Y, Kim H-S, Chin I-J, Jin H-J. pH-triggered transition of silk fibroin from spherical micelles to nanofibrils in water. Macromol Res. 2008;16:539–43. [Google Scholar]
- 58.Eisoldt L, Hardy J, Heim M, Scheibel T. The role of salt and shear on the storage and assembly of spider silk proteins. J Struct Biol. 2010 doi: 10.1016/j.jsb.2009.12.027. accepted for publication. [DOI] [PubMed] [Google Scholar]
- 59.Heim M, Ackerschott C, Scheibel T. Characterisation of recombinantly produced spider flagelliform domains. J Struct Biol. 2010 doi: 10.1016/j.jsb.2009.12.025. accepted for publication. [DOI] [PubMed] [Google Scholar]
- 60.Hagn F, Eisoldt L, Hardy J, Vendrely C, Coles M, Scheibel T, et al. A highly conserved spider silk domain acts as a molecular switch that controls fibre assembly. Nature. 2010 doi: 10.1038/nature08936. accepted for publication. [DOI] [PubMed] [Google Scholar]