

Abstract
In receptor binding assays with ultra-high-affinity radioligands, it is difficult, in practice, to adhere to the golden rule that the receptor concentration in the assay should be substantially (at least 10-fold) lower than the dissociation constant (Kd) of the radioligand and inhibition constant (Ki) of compound. Especially for low specific activity radioligands (usually tritiated ligands of a couple of TBq/mmol), routinely applied in concentrations at around or below the Kd, the use of extremely small amounts of receptor protein per assay will result in low levels of bound radioactivity; the alternative use of larger assay volumes will make it difficult to apply 96-well filtration devices. For assessing the inhibition constant (Ki) of competitive inhibitors under conditions violating the above golden rule, equations are available incorporating both [receptor] and [ligand] versus Kd; however, their application requires precise knowledge of [receptor] or initial bound/free [radioligand] ratio. In this study, we present the theoretical basis for determining the Ki for a competitive inhibitor in a new protocol at high [protein] and high [radioligand] with the simple Cheng-Prusoff correction without the need to correct for [receptor] or initial bound/free [radioligand] ratio. In addition, we present results on the binding of the ultra-high-affinity ligand [3H]spiperone to dopamine D2 and D3 receptors validating the Ki values calculated with the new protocol for competitive inhibitors as compared with those calculated with the most comprehensive equation available to date, that of Munson and Rodbard (1988). Binding was measured at varying [radioligand] and [receptor], test compounds (including (−)5-OH-DPAT, (±)7-OH-DPAT, and ropinirole) were run with varying [receptor], and simulations were done at vastly varying [radioligand] for inhibitors with vastly different Kis. The modified high [radioligand] protocol presented here removes a major hindrance in the proper execution of binding assays with ultra-high-affinity tritiated ligands with Kd values in the subnanomolar range, allowing the use of 96-well plates with small volumes of 100-200 μl per binding assay.
Keywords: competition inhibition curve, dopamine receptor, high-affinity binding assay, spiperone, receptor concentration
1. Introduction
Dopamine (DA) receptors are G-protein-coupled receptors broadly categorized as D1-like (stimulating adenylate cyclase) or D2-like (inhibiting adenylate cyclase). Within the latter category, D2 and D3 subtype DA receptors have been studied abundantly as targets for antipsychotic and antiparkinsonian medications, respectively(Sokoloff et al., 1992;Girault and Greengard, 2004; McCall et al., 2005;Strange 2008). Although D2 and D3 receptors are regulated differently, they share a similar molecular structure and pharmacological profile (Sokoloff et al., 1990; Werner et al., 1996; Levant, 1997). Site-directed mutagenesis and molecular modeling studies have provided insight into differences in the ligand-binding domain of D2 and D3 receptors (Mansour et al., 1992;Sokoloff et al. 1992; Lundstrom et al., 1998; Watts et al., 1998; Sartania and Strange, 1999; Strange, 2001; Dutta et al., 2002; Mach et al., 2003; McCall et al. 2005; Saur et al., 2007).
Because of the similarity between D2 and D3 receptors, development of compounds selective for one over the other receptor subtype is challenging. An essential component of the drug development process is the ability to test the receptor potency of compounds with a protocol that is devoid of artifactual distortions due to improper conditions for the receptor under study. In the case of D2 and D3 receptors, competitive inhibition of [3H]spiperone binding has been used widely to measure compound affinities. Most antipsychotics, including spiperone, bind to both D2 and D3 receptors with high affinity, i.e. nanomolar or sub-nanomolar Kd (equilibrium dissociation constant) (Gardner et al., 1996;Strange, 2001 ). A ground rule for receptor binding studies with competitive inhibitors is that the concentration of radioactive ligand in relation to its Kd must be taken into account in converting the IC50 (concentration of compound to inhibit 50% of radioligand binding) to Ki (equilibrium dissociation constant of inhibitor) with the Cheng-Prusoff correction (Cheng and Prusoff, 1973). It is important to recall that in the Cheng-Prusoff equation, IC50 denotes the free (not totally added) concentration of inhibitor giving 50% inhibition, and the concentration of radioactive ligand is the free (not totally added) concentration. Differences between free and totally added concentrations can be minimized - creating valid conditions for applying the Cheng-Prusoff equation - by making sure that less than 10% of the total added radioligand is actually bound (zone A binding, see Bennett and Yamamura, 1985), and that the receptor concentration in the assay is substantially (at least 10-fold) lower than the Kd or Ki of radioligand or inhibiting compound, respectively (Chang et al., 1975; Bennett and Yamamura, 1985). In order to minimize the impact of the Cheng-Prusoff correction, most researchers also choose a radioligand concentration at or below its Kd. In the case of [3H]spiperone or other tritiated ultra-high-affinity ligands that bind with a subnanomolar Kd, the above considerations necessitate the use of extremely low receptor concentrations that result in low levels of bound radioactivity with routinely used binding assay volumes of 0.2 ml or less in 96-well filtration devices combined with 96-format plate scintillation counting. With deep-well plates and some harvesters, one can increase the assay volume from 0.2 to 0.8 ml in order to get a higher amount of bound radioactivity without increasing the receptor concentration but this factor of 4 is not always enough for obtaining sufficient counts for proper counting; deep-well plates are also harder to work with in terms of making additions and ensuring proper mixing of assay components. One could, for ultra-high-affinity ligands, decide to increase the receptor concentration beyond the recommended 10% of Kd, and compute the Ki for a competitive inhibitor by applying equations that take into account the receptor concentration (Jacobs et al., 1975; Linden, 1982). This is problematic in experiments with brain tissue where the receptor density is not known unless specifically measured, and even in cell lines stably expressing receptors where receptor density can be affected by cell culture confluence, culture time and passage number, as well as culture medium conditions. The most comprehensive treatment of ligand and receptor concentration available to date is with an equation that requires the initial (without inhibitor) ratio of bound over free radioligand rather than the receptor concentration (Munson and Rodbard,1988). The Munson-Rodbard equation shows that high receptor concentrations by themselves (even with radioligand concentrations substantially below Kd), can result in high corrections factors going from IC50 to Ki. For example, with an initial bound over free ratio of 5, radioligand over Kd ratio of 0.1, and Ki ~ Kd, the correction factor is 10. Day-to-day variation in initial bound over free will have substantial impact on the computed Ki values.
In this study, we present the theoretical basis for determining the Ki inhibitor at high receptor protein and high radioligand concentration with the simple Cheng-Prusoff correction without the need to correct for receptor concentration or initial bound over free. In addition, we present results on [3H]spiperone binding to DA D2 and D3 receptors validating the Ki values calculated in this manner as compared with those calculated with the Munson-Rodbard equation (1988). Simulations were run at vastly varying [radioligand] for inhibitors with vastly different Kis for assessing the accuracy of the new protocol. The method presented here allows small-volume assays in 96-well format and can be applied to other ultra-high-affinity radioligand binding studies.
2. Materials and methods
2.1. Materials
Human embryonic kidney (HEK) 293 cells, stably transfected with rat D2L and rat D3 cDNAs, were gifts from Dr. Kim Neve (Portland VA Medical Center, Portland, Oregon). They were cultured in Dulbecco’s Modified Eagle Medium, supplemented with of 10% Bovine Calf Serum, 2mM glutamine and 2 μg/ml puromycin to keep selection pressure at 37°C and 5% CO2. [3H]spiperone (15Ci/mmole) was purchased from PerkinElmer(Waltham, Massachusetts). (−)5-OH-DPAT, (±)7-OH-DPAT, ropinirole, D341, D342, D343 and D344 were synthesized by Dr. Aloke Dutta(Wayne State University, Detroit, MI). Other chemicals were provided by commercial sources.
2.2. [3H]Spiperone binding assays
“Hot saturation” assays were performed to determine the dissociation constant of [3H]spiperone to DA D2 and D3 receptors. Crude membranes were prepared from HEK293-rD2 and HEK293-rD3 cells, as described before (Zhen et al., 2004). In a total reaction volume of 0.8ml, [3H]spiperone (0.3 pM to 3 nM, final concentration) and crude membranes were incubated together in assay buffer (50 mM Tris-HCl, pH 7.4, with 0.9% NaCl, 0.025% ascorbic acid and 0.001% Bovine Serum Albumin) for 1 h at 30°C in deep-well plates in a water-bath shaker. 2 μM (+)-butaclamol was used as nonspecific binding definition for each concentration of [3H]spiperone. Assays were terminated by the addition of ice-cold 0.9% saline and filtration through a glass fiber filtermat in the Brandel-96 cell harvester. The filtermat was being washed 3 times and dried under hot air. The radioactivity was counted in a Microbeta liquid scintillation counter (PerlinElmer) after adding 10 ml of Betaplate Scint (PerkinElmer) to each filtermat. In competitive inhibition assays, appropriate concentrations of non-radioactive spiperone were included. Kinetic parameters (Kd, Bmax, and IC50) were calculated using the computer-fitting programs LIGAND (Biosoft, Cambridge, UK) and ORIGIN (Microcal Software, Inc., Northampton, MA, USA). Protein level was determined with the Lowry method (see (Zhen et al., 2004)). IC50 values were converted to inhibition constants (Ki) by the Cheng–Prusoff equation (Cheng and Prusoff, 1973) and Munson-Rodbard equation (Munson and Rodbard, 1988). To validate the modified protocol, the reaction volume was reduced from 0.8 ml (deep-well plates) to 0.2 ml (regular plates) with increased concentration of [3H]spiperone and protein level under conditions as described in the text.
2.3. Data simulation of competitive inhibition with random error added
Competitive inhibition was simulated to examine the accuracy of the modified binding protocol with high concentration of radioligand. The Kd was set at 1 nM; Ki values were calculated as described by Cheng and Prusoff (1973) and Munson and Rodbard (1988) with varying concentrations of receptor and radioligand. The ratio of Cheng-Prusoff Ki to Munson-Rodbard Ki was calculated to judge the error introduced to Ki when [receptor] was higher than Ki. In a different simulation set, competition curves were generated based on a one-binding site model with relative random error added as follows. In the presence of inhibitor (Ki=1 nM), we chose three conditions for generating binding curves, i.e. at concentrations of radioligand equal to 0.1 nM, 1 nM or 10 nM. Under all the conditions, the initial bound/free ratio was set to 0.1. The actual random values of bound equaled to the sum of the theoretic values and random errors calculated from a Gaussian distribution with a relative S.D. equal to 10% with the GraphPad Prism software (La Jolla, CA). IC50s were fitted from the generated curves and averaged, for each radioligand concentration, for 3 independent simulations with the 10% scatter.
3. Results
3.1. Theoretical basis for allowing the use of [receptor] > Kd and [radioligand] >> Kd
A complex equation to convert IC50 to Ki that takes into account not only the radioligand concentration but also the receptor concentration has been derived by Jacobs et al. (1975):
| eq.1 |
in which [Lt] (= Ho in equation 10 in (Jacobs et al., 1975)) equals the total concentration of radioligand (in our case [3H]spiperone), [Rt] (= Ro in (Jacobs et al., 1975)) is the total concentration of receptor, and [LRmax] (=RH in (Jacobs et al., 1975)) stands for the concentration of receptor-radioligand complex in the absence of unlabeled ligand. In further comparing above equation 1 with equation 10 in Jacobs et al. (1975) please note that IC50 = Kd’ (app), Ki = Kd’, and Ki/Kd = n.
According to the mass law, at equilibrium and in the absence of inhibitor(R + L ↔ RL), the relationship of [L], [R], and [LR] can be described as
| eq.2 |
where Kd equals the dissociation constant for [3H]spiperone, [L] the concentration of unbound [3H]spiperone, [R] the concentration of free DA receptor and [LR] the concentration of the [3H]spiperone-DA receptor complex. We can write:
| eq.3 |
| eq.4 |
Substituting [R] in Eq.3 with its equivalent in Eq.4, we obtain:
| eq.5 |
If [Lt]>>Kd, it follows that
| eq.6 |
And thus Eq.1 can be rewritten as
| eq.7 |
When [Lt]>>[Rt], we find that
| eq. 8 |
which equals the Cheng-Prusoff conversion.
In summary, provided [Lt]>>Kd as well as [Lt]>>[Rt], the complex equation of Jacobs et al. (1975) is equal to the Cheng-Prusoff correction. Thus, according to the above derivation, the complex equation taking into account [receptor] reverts to the simple Cheng-Prusoff equation if a radioligand concentration is applied that is much higher than the Kd and the total receptor concentration. Another conclusion from the above kinetic analysis is that high [Lt] allows the use of higher [receptor] as long as the latter is much less than [Lt].
3.2. Experimental validation for applying [Rt] > Kd and [Lt] >> Kd and [Rt] in the case of spiperone binding to D2 and D3 DA receptors
Spiperone has been reported to have sub-nanomolar affinity to D2 and D3 DA receptors (Chio et al., 1994; Gardner et al., 1996; Zaworski et al., 1999). We determined the Kd and Bmax (maximal binding) under our conditions in a “hot saturation” assay with varying [3H]spiperone (0.3pM – 3nM) and 2 μM (+)-butaclamol for defining non-specific binding. The Kd was found to be 0.057 ± 0.013 nM for D2 and 0.125 ± 0.033 nM for D3 DA receptors (mean ± SEM for 3 experiments). The Bmax in these experiments was 2.41 ± 0.26 pmol/mg of protein for D2 and 1.08 ± 0.14 pmol/mg of protein for D3 receptors (see representative experiments in Fig. 1).
Figure 1. Saturation analysis of [3H]spiperone binding to HEK293-rD2 (A) and HEK-rD3 (B).

Data shown are from one representative experiment carried out in triplicate. Insets show Scatchard analysis. For three independent experiments, the average Kd and Bmax values were 0.057 ± 0.013 nM and 2.41 ± 0.26 pmole/mg protein for HEK293-rD2, and 0.125 ± 0.033 nM and 1.08 ± 0.14pmole/mg protein for HEK293-rD3, respectively.
If the aim is to have [receptor] < 10% of Kd (see Introduction), one can, with the above Kd and Bmax values, calculate the need for [receptor] < 0.0057 nM for D2 and < 0.0125 nM for D3 assays, i.e. < 2.35 μg/ml for D2 and < 11.6 μg/ml for D3 assays. Our modified high-affinity radioligand protocol with [radioligand] > Kd claims that higher [receptor] can be used as long as [receptor] << [radioligand]. To test the modified protocol, [3H]spiperone binding was monitored for HEK-rD2 and HEK-rD3 cells as follows. An amount of 10 μg of D2 and 40 μg of D3 cell membrane was applied in 0.8 ml assay volume (i.e., 12.5 and 50 μg/ml), resulting in [Rt] values for D2 and D3 receptors of 0.03 nM and 0.05 nM, respectively (see Table 1, first 3 experimental conditions for each cell line). Under these conditions, a wide range of [radioligand]s was applied from 0.16 nM to 1.2 nM. Throughout this range, [Lt] >> 0.5 [Rt] as well as [Lt] > Kd, and the Cheng-Prusoff conversion for inhibition by unlabeled spiperone yielded similar Ki values (~ 0.06 nM for D2 and ~ 0.1 nM for D3, Table 1) despite vastly varying IC50 values (from 0.2 to 1.1 nM for D2 and from 0.2 to 0.9 nM for D3, see Fig. 2). The effect of an even higher protein level was studied next. The assay volume was reduced from 0.8 ml to 0.2 ml, with 20 μg D2 and 50 μg D3 cell membranes (i.e., 100 and 250 μg/ml), resulting [Rt] levels of 0.24 nM for D2 and 0.25 nM for D3 (Table 1, last experimental condition for each cell line). Under this condition, with [Lt] >> 0.5 [Rt] as well as [Lt] >> Kd, the Cheng-Prusoff conversion for inhibition by unlabeled spiperone yielded a Ki value that was similar to the values obtained with lower protein concentrations despite an extremely high value for the Cheng-Prusoff conversion factor (Table 1).
Table1.
Inhibition constant of unlabelled spiperone in [3H]spiperone binding assay with HEK293-rD2 (1a) and HEK293-rD3 (1b), obtained with Cheng-Prusoff or Munson-Rodbard conversion, under conditions of varying radioligand concentration and protein level
| 1a: HEK293-rD2 | |||||
|---|---|---|---|---|---|
| [Lt]nM | [Rt] nM |
IC50 nM |
Bound/free radioligand |
Ki by Cheng-Prusoff correction nM |
Ki by Munson- Rodbard correction nM |
| 0.16 | 0.03 | 0.255 | 0.129 | 0.067 | 0.064 |
| 0.6 | 0.03 | 0.616 | 0.047 | 0.053 | 0.053 |
| 1.2 | 0.03 | 1.149 | 0.024 | 0.052 | 0.052 |
| 4.6 | 0.24 | 6.897 | 0.05 | 0.084 | 0.085 |
| 1b: HEK293-rD3 | |||||
|---|---|---|---|---|---|
| [Lt] nM |
[Rt] nM |
IC5 nM |
Bound/free radioligand |
Ki by Cheng-Prusoff correction nM |
Ki by Munson-Rodbard correction nM |
| 0.16 | 0.05 | 0.206 | 0.168 | 0.080 | 0.078 |
| 0.6 | 0.05 | 0.684 | 0.052 | 0.118 | 0.116 |
| 1.2 | 0.05 | 0.887 | 0.039 | 0.084 | 0.082 |
| 4.6 | 0.25 | 4.793 | 0.056 | 0.127 | 0.127 |
In the conversion from IC50 to Ki, the Kd of [3H]spiperone was 0.057 nM for D2 and 0.125 nM for D3. Data are from single experiments carried in triplicate. For the respective corrections, see text and Cheng and Prusoff (1973) as well as Munson and Rodbard (1988).
Figure 2. Competition curves describing inhibition of [3H]spiperone binding by unlabeled spiperone as a function of radioligand concentration in HEK-rD2 (A) and HEK-rD3 (B) cells.

A rightward shift occurs upon increasing [radioligand] from 0.16 nM to 0.62 nM and to 1.2 nM. The IC50 values from least squares computer analysis were converted to Ki values with the Cheng-Prusoff and Munson-Rodbard equations, shown in Table 1.
Further, we applied the modified protocol to determine IC50s and Kis of ropinirole. (±)7-OH-DPAT, (−)5-OH-DPAT and four new drugs, D341, D342, D343, and D344, under the two conditions: low protein level (i.e. 0.8 ml assay volume, 12.5 μg/ml for D2 and 50 μg/ml for D3) and high protein level (i.e. 0.2 ml assay volume, 100 μg/ml for D2 and 250 μg/ml for D3). Between the two conditions, though their IC50s are varied greatly, Kis were not affected by the protein level (Fig 3).
Figure 3. Comparison of potencies of test compounds obtained in low- and high- protein level assays on HEK-rD2 (A) and HEK-rD3 (B).

IC50s (grey bars on right side of ordinate) and Kis (white bars on left side of ordinate) in the assays of low-protein level (diagonally striped bars, i.e. in a volume of 0.8ml: 12.5 μg/ml for HEK-rD2 and 50 μg/ml for HEK-rD3 cells) and high-protein level (open bars, i.e. in a volume of 0.2ml: 100 μg/ml for HEK-rD2 and 250 μg/ml for HEK-rD3 cells). The IC50 values were converted to Ki values with the Cheng-Prusoff equation.
3.3. Simulations of competitive inhibition curves for assessing the accuracy of Ki with high radioligand concentration
We mimicked the binding of radioligand (Kd=1 nM) in the presence of inhibitor (Ki=1 nM) with [radioligand] fixed at 0.1 nM, 1 nM or 10 nM (Fig. 4). For each [radioligand], three independent simulations with 10% random scatter were done to mimic three independent experiments. For these conditions, [receptor] was kept at a level resulting in the same initial bound/free ratio (y=0.1) (italic, bold text in table 2). Kis were converted from the fitted IC50s with the Cheng-Prusoff equation. In the simulations with different [radioligand], IC50s and Kis were 0.967 ± 0.107 nM and 0.879 ± 0.098 nM ([Lt]=0.1 nM); 1.83 ± 0.28 nM and 0.913 ± 0.138 nM ([Lt]=1 nM); 12.7 ± 1.8 nM and 1.15 ± 0.16 nM ([Lt]=10 nM) (Fig.4).
Figure 4. Simulated competition inhibition curves with three different concentrations of radioligand.
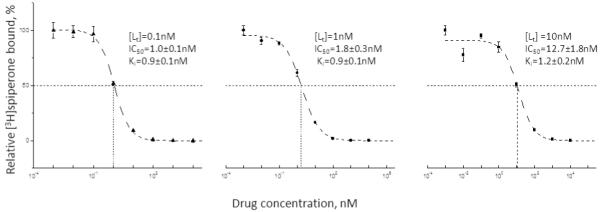
Data mimicking experimental conditions with random error (10%) added, were simulated at a ligand concentration 10 times below the Kd (closed square), equal to the Kd (open circle), and 10 times higher than the Kd (open triangle). Experimental data were simulated at various concentrations of an inhibitor with a Ki of 1 nM with the Kd of the radiolabeled ligand set at 1 nM (see table 2) and receptor concentration set to give y equal to 0.1 (y is the ratio of bound over free radioligand in the absence of unlabeled ligand in the Munson-Rodbard correction). The ordinate shows radioligand binding in the presence of inhibitor divided by that in the absence of inhibitor. At each radioligand concentration, three simulations with 10% random scatter were averaged, and each data point shows the mean ± SEM (vertical bar). Inserts show the mean ± SEM of curve-fitting results of the three simulated experiments at each radioligand concentration.
Table 2.
Comparison of Cheng-Prusoff correction with Munson-Rodbard correction in converting IC50 to Ki in simulated binding assays. Value of Kd is set at 1 nM in the simulations. Corrections were calculated as described by Cheng and Prusoff (1973) and Munson and Robard (1988). Error ratio was the ratio of Cheng-Prusoff Ki to Munsin-Rodbard Ki. The italicized and bolded text indicates the conditions used to generate competitive inhibition curves with random error added (Fig.4).
| Bound/free radioligand |
IC50 nM |
[Rt] nM |
[Lt] nM |
Ki by Cheng-Prusoff correction, nM |
Ki by Munson-Rodbard correction, nM |
Error ratio |
|---|---|---|---|---|---|---|
| 0.10 | 11 | 1.01 | 10 | 1 | 0.986 | 1.02 |
| 0.10 | 1.10 | 1.01 | 10 | 0.10 | 0.056 | 1.79 |
| 0.10 | 0.11 | 1.01 | 10 | 0.01 | -* | |
| 0.01 | 1.10 | 0.11 | 10 | 0.10 | 0.095 | 1.05 |
| 0.01 | 0.11 | 0.11 | 10 | 0.01 | 0.005 | 1.98 |
| 0.001 | 0.11 | 0.011 | 10 | 0.01 | 0.010 | 1.05 |
|
| ||||||
| 0.10 | 2 | 0.19 | 1 | 1 | 0.926 | 1.08 |
| 0.10 | 0.20 | 0.19 | 1 | 0.10 | 0.050 | 2.01 |
| 0.10 | 0.02 | 0.19 | 1 | 0.01 | -* | |
| 0.01 | 0.20 | 0.02 | 1 | 0.10 | 0.095 | 1.06 |
| 0.01 | 0.02 | 0.02 | 1 | 0.01 | 0.005 | 2.00 |
| 0.001 | 0.02 | 0.002 | 1 | 0.01 | 0.009 | 1.05 |
|
| ||||||
| 0.10 | 1.1 | 0.11 | 0.1 | 1 | 0.873 | 1.14 |
| 0.10 | 0.11 | 0.11 | 0.1 | 0.10 | 0.044 | 2.25 |
| 0.10 | 0.01 | 0.11 | 0.1 | 0.01 | -* | |
| 0.01 | 0.11 | 0.011 | 0.1 | 0.10 | 0.094 | 1.06 |
| 0.01 | 0.01 | 0.011 | 0.1 | 0.01 | 0.005 | 2.02 |
| 0.001 | 0.01 | 0.001 | 0.1 | 0.01 | 0.009 | 1.17 |
Simulation generated a negative Ki value.
4. Discussion
The theoretical analysis presented in this work shows that the complex equation of Jacobs et al. (1975) taking into account [receptor] and [radioligand] in receptor binding assays reverts to the simple Cheng-Prusoff equation if the radioligand concentration is much higher than the Kd and the total receptor concentration. Additionally, the analysis indicates that high [Lt] allows the use of higher [receptor]. As long as [Lt] >> Kd and [Lt] >> [Rt], there is also no more requirement for the routinely applied rule of [Rt] << Kd because the receptor concentration term present in the general equation 1 is absent in equation 8 derived from the general case for the conditions of [Lt] >> Kd and [Lt] >> [Rt]. With these restrictions, the use of high [Lt] combined with raised [receptor] allows the application of small-volume, 96-well-format binding assays to the measurement of binding of ultra-high-affinity radioligand in a manner similar to that applied to radioligands with less extreme affinities. This is especially useful for tritiated radioligands with specific activities in the range of a couple of TBq/mmol; with 125I-labeled radioligands this is less of an issue as their higher specific activity (up to 81 TBq/mmol) allows lower bound concentrations that are still easily detectable.
In agreement with the theoretical analysis, experiments on inhibition by spiperone of [3H]spiperone binding to D2 and D3 DA receptors showed that with increased radioligand concentration, though protein level was higher than Kd, Ki was not affected (Table 1). One should keep in mind that in the present experiments Ki = Kd with spiperone inhibiting [3H]spiperone binding. When the unlabeled inhibitor has a much higher affinity than the radioligand (Ki <= 0.1Kd), a 2-fold or larger error can be introduced (Munson and Rodbard, 1988). Our previous studies with the dopamine transporter showed the phenomenon of high protein concentrations increasing 4- to 5-fold the Ki of the compound (+)-R, R-D-84 (Zhen et al., 2004).
The most comprehensive analysis of all conditions affecting receptor binding is implemented by the Munson-Rodbard correction (1988). It is of interest that with our protocol, the computations of Ki values are virtually identical whether using the exact correction of Munson-Rodbard or the simple Cheng-Prusoff correction (Table 1). To assess the valid working range of our modified protocol, we simulated experimental conditions with varying [receptor], represented by the value of bound/free radioligand (defined as yo in the Munson-Rodbard equation), and [radioligand] (Table 2). Kd was set at 1 nM for the simulations and error ratio was defined as the ratio of Ki corrected with the Cheng-Prusoff equation over that with the Munson-Rodbard equation. With the restriction that radioligand is not depleted in the assay (bound/free radioligand ≤ 0.1), we found that the error ratio is less than 2.25 for a wide range of IC50 and [L] values. Only when the Munson-Rodbard Ki ≤ 0.06 Kd, error ratios of 1.79 and up were found; otherwise, error ratios were only 1.02 – 1.17 (Table 2). It should be noted this is independent of radioligand concentration (compare [L]=10 × Kd, 1× Kd and 0.1 × Kd). The simulations for conditions where Ki ≤ 0.1× Kd also show that binding conditions can be optimized for smaller values of the error ratio by reducing bound/free radioligand, which can be accomplished by lowering receptor concentration and /or increasing radioligand concentration. It could be thought that the use of a radioligand concentration high relative to its Kd value increases the error of the Cheng-Prusoff correction. We therefore simulated data mimicking experimental conditions with random error (10%) added at a ligand concentration 10 times below the Kd, equal to the Kd, and 10 times higher than the Kd. Experimental data were simulated at various concentrations of an inhibitor with a Ki of 1 nM, and IC50 values were computed in the same way from these data as from actual experiments. Each IC50 value was converted into a Ki by the Cheng-Prusoff correction, and the error was calculated for the average of 3 simulated experiments at each radioligand concentration. With 0.1 nM, 1 nM and 10 nM of radioligand, the apparent Kis were 0.879 ± 0.098 nM, 0.913 ± 0.138 nM and 1.15 ± 0.16 nM, respectively. No significant differences were found between the groups (one way ANOVA), and the relative error was not found to increase at higher radioligand concentration. Clearly, using a radioligand concentration 10 times over Kd, resulting in a correction factor of 11, puts great weight onto the value of Kd used in converting IC50s to Kis. It will be important to accurately determine the Kd of radioligand binding, and rigorously maintain the same assay conditions between experiments such that between-experiment variation be minimized. Since the Kd is a property of the receptor in its interaction with the radioligand, its value is a constant when assessed under identical conditions of temperature, assay buffer composition, cell line hosting the receptor, or brain region for a given animal species. In this fashion, a meaningful comparison can be made between compounds screened in the assay over different experimental days.
A final consideration is that the above analysis applies to competitive inhibitors. Compounds that inhibit by a different mechanism cannot be strictly compared on a Ki basis. For example, compounds that show an apparent noncompetitive inhibitory profile (not to be equated with actual noncompetitive inhibition of enzyme activity, see (Tomlinson, 1988)), will inhibit binding to the same extent at any [radioligand]; a general enzyme kinetics analysis of inhibition by such compounds shows IC50 to equal Ki (Cheng and Prusoff, 1973; for this discussion, binding terms were substituted for velocity terms). Thus, computation of their Ki at progressively higher [radioligand] by the competitive-inhibition-correction of Cheng-Prusoff (see above equation 8) will result in progressively smaller values, overestimating their affinity compared with calculation at low [radioligand] (risk of false positives in drug screening). Apparent uncompetitive inhibitors, for which Cheng and Prusoff (1973) derive that IC50 = Ki (1 + Km/S), will display an IC50 two times the Ki at a radioligand concentration close to Kd as routinely applied in many binding studies; further increasing radioligand concentration will cause IC50 to approach Ki. Therefore, such compounds, as apparent noncompetitive inhibitors, will also be subject to the risk of false positives in drug screening with higher ligand concentrations resulting in progressive reductions in Ki when applying the correction for competitive inhibitors (equation 8). In drug screening projects, such false positives can be weeded out in subsequent functional assays. In addition, in assessing structure-activity relationships in a series of closely related chemicals one can expect a similar mechanism of inhibition, and, thus, Ki evaluations for such compounds will still provide valid relative comparisons. Inspection of the analysis of Cheng and Prusoff (1973) shows that, when the radioligand concentration is appreciably smaller than the Kd, the IC50 seriously deviates from (becomes higher than) Ki for uncompetitive inhibitors, whereas for competitive or noncompetitive inhibitors the IC50 is practically equal to Ki; when [radioligand] ~ Kd, the IC50 is close to Ki (within a factor of 2) for all three inhibition mechanisms (Cheng and Prusoff, 1973). Therefore, if one has a tritiated radioligand with Kd in the nanomolar range, or an ultra-high-affinity ligand with sufficient specific activity (iodinated), it it advisable to keep the radioligand concentration close to Kd, and receptor concentration much below Kd, in order to reduce the impact of mechanism of inhibition and corrections in general.
With the bulk of inhibitors of receptor binding belonging to the class of competitive inhibitors, we believe the modified protocol presented here removes a major hindrance in the proper execution of binding assays with ultra-high-affinity tritiated ligands with Kd values in the subnanomolar range. This major hindrance is the routinely accepted requirement for low receptor concentration (<< Kd), resulting in unworkable conditions for most 96-format binding assays. Bmax values for cell lines overexpressing a given receptor can be much higher than those encountered in brain regions; in the latter case, in increasing receptor concentration in the binding assay, one needs to consider the upper limit of protein the filtration device can handle without showing clogging problems. For cells, and brain tissue with the above restriction, our modified protocol allows the use of 96-well plates with small volumes of 100-200 μL per binding assay, removing the need for large binding assay volumes that result in large quantities of consumed expensive radioligand and filtration systems producing single filters for each assay to be counted individually in scintillation vials with expensive scintillation cocktail. The modified protocol presented here is scientifically sound and at the same time less expensive and more environment-friendly than previous methods adhering to binding rules routinely accepted as dogma.
Acknowledgements
This work was supported by a grant from the National Institutes of Health (NS047198 to A.K. Dutta).
Appendix
1) Juan Zhen, Department of Psychiatry, New York University School of Medicine, Room MHL HN-518, 550 First Ave, New York, NY 10016, USA, juan.zhen@nyumc.org, Phone: 1-212-263-8181, Fax: 1-212-263-8183
2) Tamara Antonio, Department of Psychiatry, New York University School of Medicine, Room MHL HN-518, 550 First Ave, New York, NY 10016, USA, Tamara.Antonio@nyumc.org
3) Aloke K. Dutta, Room # 3128, Department of Pharmaceutical Sciences, Eugene Applebaum College of Pharmacy and Health Sciences, Wayne State University, Detroit, MI 48202, Phone: (313) 577-1064, Fax: (313) 577-2033, af8308@wayne.edu
4) Maarten E.A. Reith, Departments of Psychiatry and Pharmacology, New York University School of Medicine, Room MHL HN-518, 550 First Ave, New York, NY 10016, USA, reithm01@yahoo.com
Footnotes
Publisher's Disclaimer: This is a PDF file of an unedited manuscript that has been accepted for publication. As a service to our customers we are providing this early version of the manuscript. The manuscript will undergo copyediting, typesetting, and review of the resulting proof before it is published in its final citable form. Please note that during the production process errors may be discovered which could affect the content, and all legal disclaimers that apply to the journal pertain.
References
- Bennett JP, Jr, Yamamura HI. Neurotransmitter, Hormone, or Drug Receptor Binding Methods. In: Yamamura HI, Enna SJ, Kuhar MJ, editors. Neurotransmitter Receptor Binding. 2nd ed. Raven Press; New York: 1985. pp. 61–89. [Google Scholar]
- Chang KJ, Jacobs S, Cuatrecasas P. Quantitative aspects of hormone-receptor interactions of high affinity. Effect of receptor concentration and measurement of dissociation constants of labeled and unlabeled hormones. Biochim. Biophys. Acta. 1975;406:294–303. doi: 10.1016/0005-2736(75)90011-5. [DOI] [PubMed] [Google Scholar]
- Cheng Y, Prusoff WH. Relationship between the inhibition constant (K1) and the concentration of inhibitor which causes 50 per cent inhibition (I50) of an enzymatic reaction. Biochem. Pharmacol. 1973;22:3099–108. doi: 10.1016/0006-2952(73)90196-2. [DOI] [PubMed] [Google Scholar]
- Chio CL, Lajiness ME, Huff RM. Activation of heterologously expressed D3 dopamine receptors: comparison with D2 dopamine receptors. Mol. Pharmacol. 1994;45:51–60. [PubMed] [Google Scholar]
- Dutta AK, Fei XS, Reith ME. A novel series of hybrid compounds derived by combining 2-aminotetralin and piperazine fragments: binding activity at D2 and D3 receptors. Bioorg. Med. Chem. Lett. 2002;12:619–22. doi: 10.1016/s0960-894x(01)00820-4. [DOI] [PubMed] [Google Scholar]
- Gardner B, Hall DA, Strange PG. Pharmacological analysis of dopamine stimulation of [35S]-GTP gamma S binding via human D2short and D2long dopamine receptors expressed in recombinant cells. Br. J. Pharmacol. 1996;118:1544–50. doi: 10.1111/j.1476-5381.1996.tb15572.x. [DOI] [PMC free article] [PubMed] [Google Scholar]
- Girault JA, Greengard P. The neurobiology of dopamine signaling. Arch. Neurol. 2004;61:641–4. doi: 10.1001/archneur.61.5.641. [DOI] [PubMed] [Google Scholar]
- Jacobs S, Chang K-J, Cuatrecasas P. Estimation of hormone receptor affinity by competitive displacement of labeled ligand: effect of concentration of receptor and of labeled ligand. Biochem. Biophys. Res. Commun. 1975;66:687–92. doi: 10.1016/0006-291x(75)90564-1. [DOI] [PubMed] [Google Scholar]
- Levant B. The D3 dopamine receptor: neurobiology and potential clinical relevance. Pharmacol. Rev. 1997;49:231–52. [PubMed] [Google Scholar]
- Linden J. Calculating the dissociation constant of an unlabeled compound from the concentration required to displace radiolabel binding by 50% J. Cyclic. Nucleotide. Res. 1982;8:163–72. [PubMed] [Google Scholar]
- Lundstrom K, Turpin MP, Large C, Robertson G, Thomas P, Lewell XQ. Mapping of dopamine D3 receptor binding site by pharmacological characterization of mutants expressed in CHO cells with the Semliki Forest virus system. J. Recept. Signal. Transduct. Res. 1998;18:133–50. doi: 10.3109/10799899809047741. [DOI] [PubMed] [Google Scholar]
- Mach RH, Huang Y, Freeman RA, Wu L, Blair S, Luedtke RR. Synthesis of 2-(5-bromo-2,3-dimethoxyphenyl)-5-(aminomethyl)-1H-pyrrole analogues and their binding affinities for dopamine D2, D3, and D4 receptors. Bioorg. Med. Chem. 2003;11:225–33. doi: 10.1016/s0968-0896(02)00341-3. [DOI] [PubMed] [Google Scholar]
- Mansour A, Meng F, Meador-Woodruff JH, Taylor LP, Civelli O, Akil H. Site-directed mutagenesis of the human dopamine D2 receptor. Eur. J. Pharmacol. 1992;227:205–14. doi: 10.1016/0922-4106(92)90129-j. [DOI] [PubMed] [Google Scholar]
- McCall RB, Lookingland KJ, Bedard PJ, Huff RM. Sumanirole, a highly dopamine D2-selective receptor agonist: in vitro and in vivo pharmacological characterization and efficacy in animal models of Parkinson’s disease. J. Pharmacol. Exp. Ther. 2005;314:1248–56. doi: 10.1124/jpet.105.084202. [DOI] [PubMed] [Google Scholar]
- Munson PJ, Rodbard D. An exact correction to the “Cheng-Prusoff” correction. J. Recept. Res. 1988;8:533–46. doi: 10.3109/10799898809049010. [DOI] [PubMed] [Google Scholar]
- Sartania N, Strange PG. Role of conserved serine residues in the interaction of agonists with D3 dopamine receptors. J. Neurochem. 1999;72:2621–4. doi: 10.1046/j.1471-4159.1999.0722621.x. [DOI] [PubMed] [Google Scholar]
- Saur O, Hackling AE, Perachon S, Schwartz JC, Sokoloff P, Stark H. N-(4-(4-(2-Halogenophenyl)piperazin-1-yl)butyl) substituted cinnamoyl amide derivatives as dopamine D2 and D3 receptor ligands. Arch. Pharm. (Weinheim) 2007;340:178–84. doi: 10.1002/ardp.200600196. [DOI] [PubMed] [Google Scholar]
- Sokoloff P, Giros B, Martres MP, Bouthenet ML, Schwartz JC. Molecular cloning and characterization of a novel dopamine receptor (D3) as a target for neuroleptics. Nature. 1990;347:146–51. doi: 10.1038/347146a0. [DOI] [PubMed] [Google Scholar]
- Sokoloff P, Martres MP, Giros B, Bouthenet ML, Schwartz JC. The third dopamine receptor (D3) as a novel target for antipsychotics. Biochem. Pharmacol. 1992;43:659–66. doi: 10.1016/0006-2952(92)90227-a. [DOI] [PubMed] [Google Scholar]
- Strange PG. Antipsychotic drugs: importance of dopamine receptors for mechanisms of therapeutic actions and side effects. Pharmacol. Rev. 2001;53:119–33. [PubMed] [Google Scholar]
- Strange PG. Antipsychotic drug action: antagonism, inverse agonism or partial agonism. Trends Pharmacol. Sci. 2008;29:314–21. doi: 10.1016/j.tips.2008.03.009. [DOI] [PubMed] [Google Scholar]
- Tomlinson G. Potential misconceptions arising from the application of enzyme kinetic equations to ligand-receptor systems at equilibrium. Can. J. Physiol Pharmacol. 1988;66:342–9. doi: 10.1139/y88-059. [DOI] [PubMed] [Google Scholar]
- Watts VJ, Wiens BL, Cumbay MG, Vu MN, Neve RL, Neve KA. Selective activation of Galphao by D2L dopamine receptors in NS20Y neuroblastoma cells. J. Neurosci. 1998;18:8692–9. doi: 10.1523/JNEUROSCI.18-21-08692.1998. [DOI] [PMC free article] [PubMed] [Google Scholar]
- Werner P, Hussy N, Buell G, Jones KA, North RA. D2, D3, and D4 dopamine receptors couple to G protein-regulated potassium channels in Xenopus oocytes. Mol. Pharmacol. 1996;49:656–61. [PubMed] [Google Scholar]
- Zaworski PG, Alberts GL, Pregenzer JF, Im WB, Slightom JL, Gill GS. Efficient functional coupling of the human D3 dopamine receptor to G(o) subtype of G proteins in SH-SY5Y cells. Br. J. Pharmacol. 1999;128:1181–8. doi: 10.1038/sj.bjp.0702905. [DOI] [PMC free article] [PubMed] [Google Scholar]
- Zhen J, Maiti S, Chen N, Dutta AK, Reith ME. Interaction between a hydroxypiperidine analogue of 4-(2-benzhydryloxy-ethyl)-1-(4-fluorobenzyl)piperidine and Aspartate 68 in the human dopamine transporter. Eur. J. Pharmacol. 2004;506:17–26. doi: 10.1016/j.ejphar.2004.10.028. [DOI] [PubMed] [Google Scholar]